
Adele
Agricultural Sciences Memorandum - Grade 12 June 2021 Exemplars
MEMORANDUM
SECTION A
QUESTION 1
1.1
1.1.1 D √√
1.1.2 A √√
1.1.3 B √√
1.1.4 A √√
1.1.5 C √√
1.1.6 D √√
1.1.7 B √√
1.1.8 D √√
1.1.9 C √√
1.1.10 A √√ (10 x 2) (20)
1.2
1.2.1 Both A and B √√
1.2.2 Both A and B √√
1.2.3 A only √√
1.2.4 B only √√
1.2.5 None √√ (5 x 2) (10)
1.3
1.3.1 Anaemia √√
1.3.2 Antibodies √√
1.3.3 Ectoparasites/External parasites √√
1.3.4 Impotence √√
1.3.5 Therapeutic √√ (5 x 2) (10)
1.4
1.4.1 Pearson √
1.4.2 Creep √
1.4.3 Sterility √
1.4.4 Dystocia √
1.4.5 Foley catheter √ (5 x 1) (5)
TOTAL SECTION A: 45
SECTION B
QUESTION 2: ANIMAL NUTRITION
2.1 The representation of the alimentary canal of a farm animal
2.1.1 Identification of letters B, C and G
- B: Reticulum √
- C: Omasum √
- G: Ventriculus / Gizzard √ (3)
2.1.2 Classification of alimentary canals
- Non-ruminant √ (1)
2.1.3 Justification
- Simple stomach / Single stomach √
- Presence of pro-ventriculus √
- Presence of ventriculus / gizzard √
- Presence of crop √
- Presence of caeca / 2 caecum √ (Any 1) (1)
2.1.4 Identification of a letter
- F √ (1)
2.1.5 Identification of the letter that represents the part
- H √ (1)
- D / B √ (1)
2.2 The vitamins and deficiency diseases
2.2.1 Vitamin D √ (1)
2.2.2 Vitamin B2/Riboflavin √ (1)
2.3 Identification of the feed
2.3.1 Fishmeal / Feed D √ (1)
2.3.2 Lick / Feed C √ (1)
2.3.3 Maize / Feed B √ (1)
2.3.4 Hay / Feed A √ (1)
2.4 Compounding a ration for farm animals
2.4.1 Identification of a suitable example
- Concentrate: Sunflower oilcake meal / Maize √ (1)
- Roughage: Silage √ (1)
2.4.2 Calculation of digestibility co-efficient of silage
- Dry matter of silage = 80% of 25 kg = 20 kg √
OR
- Dry matter of silage = 20% moisture of 25 kg = 5 kg, then
25 kg – 5 kg = 20 kg √ - DC = Dry material intake (kg) – Dry mass of manure (kg) x 100 √
Dry material intake (kg) 1
= 20 kg – 8 kg x 100 √
20 kg 1
OR
- = 12 kg x 100 √
20 1
= 60% √ (5)
2.4.3 Calculation of the nutritive ratio (NR) of sunflower oilcake meal
- NR = 1 : TDN – DP √
DP
NR = 1 : 85 – 17 √
17
NR = 1 : 4 √
OR
- NR = 1 : % DNNS √
% DP
= 1 : 68 √
17
= 1 : 4 √ (3)
2.4.4 Categorising the NR value:
- Sunflower oilcake meal: Narrow √
- Maize meal: Wide √ (2)
2.4.5 Justification for the suitability of sunflower oilcake meal for fattening of matured animals
- Sunflower oilcake meal is NOT suitable for fattening √
- Reason: Very high in protein / Narrow nutritive ratio √ (2)
2.5 Fodder-flow programme
2.5.1 Identification of the month during which the farmer only used natural pasture to feed farm animals
- January √
- December √ (Any 1) (1)
2.5.2 Justification for the answer in QUESTION 2.5.1.
- No supplementation during both months √ (1)
2.5.3 Calculations
- Determination of the amount of natural pasture needed in December
45 sheep x 2,5 kg per day x 31 days √ = 3 487,5 kg √ (2) - Indication of shortage or surplus
4,3 tons x 1 000 = 4 300 kg √
4 300 kg (feed available) – 3 487,5 kg (feed required) √
= 812,5 kg √ (3)
[35]
QUESTION 3: ANIMAL PRODUCTION, PROTECTION AND CONTROL
3.1 Animal production systems
3.1.1 Identification production systems A and B
- PICTURE A: Extensive production system √
- PICTURE B: Intensive production system √ (2)
3.1.2 Justification for QUESTION 3.1.1
- Sustainable use of natural resources:
In the extensive system good sustainable use of resources / less use of energy / less waste production / less pollution √ (Any 1) (1)
In the intensive system poor sustainable use of resources / high use of energy / more production of animal waste / more pollution √ (Any 1) (1) - Capital investment:
In the extensive system less capital investment / less production inputs √ (Any 1) (1)
In the intensive system more capital investment / more production inputs √ (Any 1) (1)
3.1.3 Indication of the farming system associated with each of the animal production systems identified in QUESTION 3.1.1
- A/Extensive production system: Subsistence farming system √
- B/Intensive production system: Commercial farming system √ (2)
3.2 Pictures showing housing facilities for farm animals
3.2.1 Identification of facilities 1 and 2
- Facility 1: Broiler house √
- Facility 2: Farrowing crate/ Farrowing pen √ (2)
3.2.2 Indication of the main purpose for part A and B
- Part A of FACILITY 1: Insulation / Ventilation √ (Any 1) (1)
- Part B of FACILITY 2: Separate the sow from its litter / prevents the sow from laying over its litter √ (Any 1) (1)
3.2.3 ONE equipment found in FACILITY 1
- Foot baths √
- Feeders √
- Water trays √
- Weighing scale √
- Lighting facilities √
- Thermometer √
- Fans / air conditioners √
- Heaters / infrared lights √ (Any 1) (1)
3.2.4 Indication of TWO ways in which animals lose body heat
- Heat radiation √
- Sweating √
- Evaporation √
- Conduction √
- Convection √ (Any 2) (2)
3.3
3.3.1 Provision of labels for letters A–F
- A: African Swine Fever √
- B: Bacteria √
- C: Quarantine infected animals/Burn and bury carcasses / Dispose manure and bedding of infected areas/vaccination √
- D: Protozoan √
- E: Ringworm √
- F: Fungi √ (6)
3.4 Graph on reported cases of rabies outbreak in South Africa
3.4.1 Graph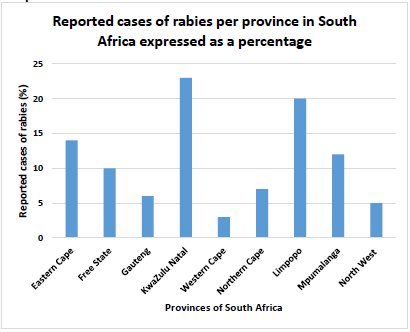
Criteria for marking
- Type of graph (bar) √
- Correct heading √
- Correct units (%)√
- Correct labelling and calibration on y-axis (Reported cases of rabies) √
- Correct labelling and calibration on x-axis
(Provinces of South Africa) √ (5)
3.4.2 The trend for rabies reported cases from the table
- Reported cases of rabies were high in 2017 √ and dropped in 2018 √ (2)
3.4.3 Indication of possible reason for the trend
- Public awareness √
- Vaccination programme √ (Any 1) (1)
3.5 Parasites
3.5.1 Example of categories of ticks
- Single-host ticks: Blue tick √
- Three-host ticks: Bont tick √ (2)
3.5.2 TWO application methods used to control ectoparasites chemically
- Plunge dip √
- Spray races √
- Pour-ons √
- Injectable drugs √
- Hand spraying √ (Any 2) (2)
3.6 TWO services rendered by the state to protect animals from infection by diseases
- Quarantine services √
- Enforce legislation √
- Movement permits √
- Import bans √
- Government animal health schemes
- Veterinary services √
- Importation of vaccines √
- Research √
- Public awareness √ (Any 2) (2)
[35]
QUESTION 4: ANIMAL REPRODUCTION
4.1 The reproductive system of a bull
4.1.1 Identification of parts
- B: Seminal vesicles √
- C: Urethra √
- E: Glans penis √ (3)
4.1.2 Indication of the process taking place in part F
- Spermatogenesis √ (1)
4.1.3 TWO functions of the hormone secreted in part F
- Development of secondary sexual characteristics √
- Stimulates normal mating behaviour √
- Necessary for the functioning of accessory glands √
- Assists in the production of spermatozoa √
- Maintenance of the male reproductive system √ (Any 2) (2)
4.1.4 Matching functions with the letter
- G √
- A / I √
- B √ (3)
4.1.5 Explanation for the importance of part H in the control of temperature for effective functioning of F and G
- During cold weather scrotum muscles draw the testes closer to the body to heat up √
- During hot weather scrotum muscles move the testis downwards away from the body to cool off √ (2)
4.2 Reproductive process in farm animals
4.2.1 Identification of the reproductive process illustrated in the diagram
- Oogenesis / Ovigenesis √ (1)
4.2.2 Indication of the name of an organ where the reproductive process identified in QUESTION 4.2.1 occurs
- Ovaries √ (1)
4.2.3 Division process taking place at A and B in the diagram above
A: Mitosis √ (1)
B: Meiosis √ (1)
4.3 Oestrus process
4.3.1 Oestrus
- It is a period when non pregnant female animals are receptive √
- to male animals/allow mating √ (2)
4.3.2 TWO visible signs of oestrus
- Vulva is swollen / reddish √
- Mucous discharge √
- Cow is restless √
- Mounting other cows √
- Cow sniffs genitalia of other cows √
- Isolation √
- Decrease in food intake/loss of appetite √
- Legs and flanks are muddy √
- Allows mating √
- Hair on the tail head and rump is fluffed up √ (Any 2) (2)
4.3.3 TWO practical methods to identify cows on heat
- Observation of animal behaviour √
- Place a bull in pen near the cows √
- Bulls marked with a chin ball marker √
- Use of pedometer √
- Tail paint on tail head/tail paint markers / tail-chalking √
- Heat mount detectors √ (Any 2) (2)
4.4 Re-arranging the stages of nuclear transfer process presented in the list to its chronological order
- Enucleation of an unfertilised egg √
- Nucleus containing DNA from donor is transferred into cytoplasm of the enucleated egg √
- Egg is treated and cultured in the laboratory for fusion to take place √
- Manipulated cell is artificially activated to start dividing until it is a blastocyst √
- Transferred into the uterus of recipient cows to grow until adulthood √ (5)
4.5 Name of an organ where each of the following female hormones are produced
4.5.1 Oestrogen: Graafian follicle / ovary √ (1)
4.5.2 Gonadotrophic releasing hormone (GnRH): Hypothalamus √ (1)
4.5.3 Progesterone: Corpus luteum / ovary √ (1)
4.5.4 Follicle-stimulating hormone (FSH): Anterior pituitary gland √ (1)
4.5.5 Oxytocin: Hypophysis √ (1)
4.6 Multiple births
4.6.1 Identification of the type of multiple births represented by DIAGRAM A and B
A: Monozygotic / Identical twins √
B: Dizygotic / Fraternal twins √ (2)
4.6.2 Justification for the answer to QUESTION 4.6.1
- A: Developed from one single ovum fertilised by one sperm cell √
- B: Developed from two different ova fertilised by different sperm cells √ (2)
[35]
TOTAL SECTION B: 105
GRAND TOTAL: 150
Agricultural Sciences Questions - Grade 12 June 2021 Exemplars
INSTRUCTIONS AND INFORMATION
- This question paper consists of TWO sections, namely SECTION A and SECTION B.
- Answer ALL the questions in the ANSWER BOOK.
- Start EACH question on a NEW page.
- Number the answers correctly according to the numbering system used in this question paper.
- You may use a non-programmable calculator.
- Show ALL your calculations, including units and formulae, where applicable.
- Write neatly and legibly.
QUESTIONS
SECTION A
QUESTION 1
1.1 Various options are provided as possible answers to the following questions. Choose the answer and write only the letter (A–D) next to the question numbers (1.1.1–1.1.10) in the ANSWER BOOK, for example 1.1.11 A.
1.1.1 An animal deficient in cobalt will show symptoms of … disease.
- osteomalacia
- parakeratosis
- swayback
- wasting
1.1.2 During … nutrient molecules move against the concentration gradient.
- active transport
- osmosis
- passive transport
- diffusion
1.1.3 The following volatile fatty acids are the end product of fermentation that is absorbed in the wall of the rumen:
- Carbonic acid, butyric acid and propionic acid
- Butyric acid, acetic acid and propionic acid
- Propionic acid, hydrochloric acid and acetic acid
- Ammonia, acetic acid and propionic acid
1.1.4 The following occurs in the abomasum:
- Secretion of gastric juices, hydrochloric acid and digestive enzymes
- Churning of food by muscular walls into chyme
- Microbial hay fermentation results in the production of volatile fatty acids
- Pepsin and rennin are secreted in the abomasum to digest proteins and curdle milk respectively
Choose the correct combination below:
- (i), (ii) and (iv)
- (ii), (iii) and (iv)
- (i), (ii) and (iii)
- (i), (iii) and (iv)
1.1.5 The instrument or equipment shown in the picture below is used by farmers to manage animal diseases and is known as a(n) …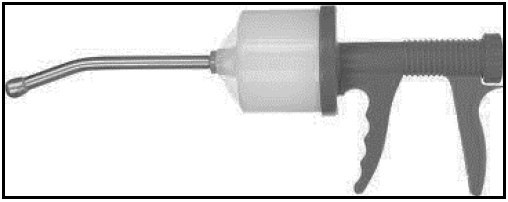
- injection gun.
- spraying gun.
- drenching gun.
- balling gun.
1.1.6 The possible advantages of a feedlot in animal production are listed below:
- Stocking density is increased
- Weaning stress on female animals is increased
- Zero grazing is applied
- The production output is increased
Choose the correct combination below:
- (i), (ii) and (iv)
- (i), (ii) and (iii)
- (ii), (iii) and (iv)
- (i), (iii) and (iv)
1.1.7 The most effective way to prevent viral diseases in farm animals is to use ...
- dosing.
- vaccination.
- dipping.
- antibiotics.
1.1.8 A process where superior cows are treated with hormones to allow production of more mature ova during a single oestrus cycle:
- Synchronisation of oestrus
- Nuclear transfer
- Embryo flushing
- Superovulation
1.1.9 The main reason for drying off a high-producing dairy cow before she starts her next lactation period is to ...
- ensure that the cow becomes pregnant early.
- shorten the gestation period.
- allow recovery of tissue and glandular material.
- reduce problems during parturition.
1.1.10 ONE of the factors listed below can cause sterility in bulls:
- Cryptorchidism
- Freemartinism
- Retained placenta
- Metritis (10 x 2) (20)
1.2 Indicate whether each of the following descriptions in COLUMN B applies to A ONLY, B ONLY, BOTH A AND B or NONE of the items in COLUMN A. Write A only, B only, both A and B or None next to the question number (1.2.1–1.2.5) in the ANSWER BOOK, for example 1.2.6 B only.
COLUMN A | COLUMN B | ||
1.2.1 | A: | Urea | Recommended as a supplement for protein in the ration of ruminant animals |
B: | Biuret | ||
1.2.2 | A: | Pancreatic juice | The juice in the digestive system that neutralises acidic condition |
B: | Bile juice | ||
1.2.3 | A: | Protozoan | An example is heartwater disease |
B: | Fungal | ||
1.2.4 | A: | Farrowing pen | Narrow stalls used in intensive farming to keep pregnant sows throughout the 16 weeks period |
B: | Gestation crates | ||
1.2.5 | A: | Maceration | Sign of parturition in cows and heifers |
B: | Mummification | ||
(5 x 2) (10)
1.3 Give ONE term/phrase for each of the following descriptions. Write only the term/phrase next to the question number (1.3.1–1.3.5) in the ANSWER BOOK.
1.3.1 The deficiency symptom in farm animals caused by a shortage of iron leading to paleness
1.3.2 Protein substances produced by white blood cells in response to specific foreign antigens
1.3.3 A collective name for classifying mites, nasal worms and lice
1.3.4 The condition where the bull is interested in a cow, but lacks the ability to service it
1.3.5 The type of nuclear transfer where embryonic stem cells are produced for medical reasons (5 x 2) (10)
1.4 Change the UNDERLINED WORD(S) in EACH of the following statements to make them TRUE. Write only the answer next to the question numbers (1.4.1–1.4.5) in the ANSWER BOOK.
1.4.1 The Punnett square is a method used to determine the ratio of two feeds to get a required nutrient value.
1.4.2 Maintenance feeding is a protein enriched feed given to piglets to attain a higher weaning weight.
1.4.3 Infertility is the total loss of fertility which cannot be corrected if diagnosed.
1.4.4 Gestation describes abnormal conditions that interfere with normal parturition.
1.4.5 An instrument used for the recovery of fertilised eggs during embryo transfer is known as pistollete.
(5 x 1) (5)
TOTAL SECTION A: 45
SECTION B
QUESTION 2: ANIMAL NUTRITION
Start this question on a NEW page.
2.1 The diagrams below represent the alimentary canals of farm animals.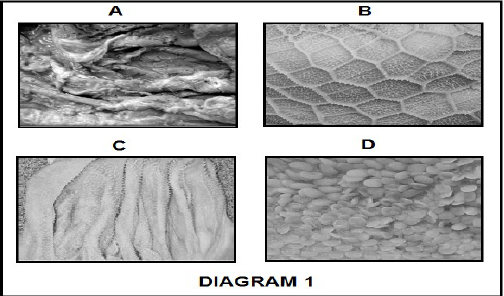
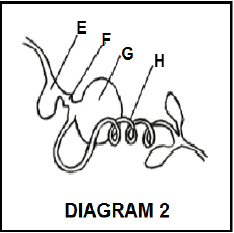
2.1.1 Identify parts represented by letters B, C and G from DIAGRAM 1 and DIAGRAM 2 above. (3)
2.1.2 Classify the animal with an alimentary canal such as the one in DIAGRAM 2. (1)
2.1.3 Justify with a visible reason the answer in QUESTION 2.1.2. (1)
2.1.4 Identify the letter of the part in DIAGRAM 2 that performs the same function as part A in DIAGRAM 1. (1)
2.1.5 Identify the letter (A–H) that represents the part where each of the following occurs:
- Maximum absorption of digested nutrients (1)
- Main site for the absorption of volatile fatty acids (1)
2.2 Suggest the name of the vitamin that causes the following deficiency symptoms:
2.2.1 Rickets which causes porous bones in young animals (1)
2.2.2 Curled toe paralysis in chickens (1)
2.3 The pictures below show different animal feeds.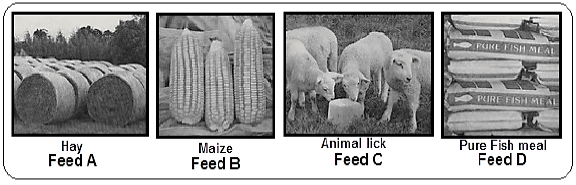
Identify the feed from the pictures above that can be associated with each of the following purposes:
2.3.1 Improve fertility in rams (1)
2.3.2 Correct mineral deficiencies (1)
2.3.3 To finish off beef animals for the abattoir (1)
2.3.4 Supply bulkiness in rations for ruminants (1)
2.4 The feeds below are available to compile a ration for farm animals.
FEEDS | COMPOSITION INDICATORS | NUTRITIVE RATIO (NR) | |||
Dry matter (%) | Moisture (%) | TDN (%) | DP (%) | ||
Maize meal | 85 | 15 | 75 | 10 | 1 : 7 |
Sunflower oil-cake meal | 89 | 11 | 85 | 17 | |
Silage | 80 | 20 | 65 | 7 | 1 : 8 |
2.4.1 Identify from the above table an example for each of the following:
- Concentrate (1)
- Roughage (1)
2.4.2 A heifer was fed 25 kg of silage from the above table and it excreted 8 kg of dry manure. Calculate the digestibility co-efficient of silage. Show ALL calculations. (5)
2.4.3 Calculate the nutritive ratio (NR) of sunflower oil-cake meal. Show ALL calculations. (3)
2.4.4 Categorise the NR value of sunflower oilcake meal and maize meal. (2)
2.4.5 Justify, with a reason, the suitability of sunflower oil-cake meal for the fattening of matured animals. (2)
2.5 The pie chart below illustrates a fodder-flow programme for a farm in South Africa.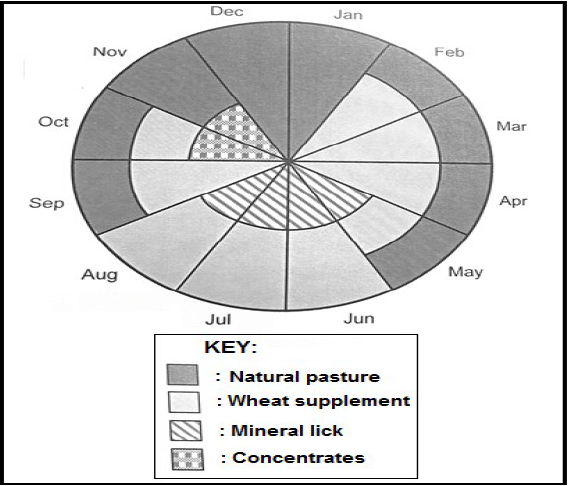
2.5.1 Identify the month during which the farmer only used natural pasture to feed farm animals. (1)
2.5.2 Justify the answer in QUESTION 2.5.1 by referring to the above pie chart. (1)
2.5.3 The farmer revealed that the farm supplied 4,3 tons of natural pasture in December.
- Determine the amount of natural pasture, in kilograms, that will be needed in December to feed 45 sheep if each sheep consumes 2,5 kg natural pasture per day. (2)
- The sheep farmer experienced a surplus. Justify this statement by calculating the surplus amount. Show ALL calculations.(3)
[35]
QUESTION 3: ANIMAL PRODUCTION, PROTECTION AND CONTROL
Start this question on a NEW page.
3.1 The pictures below represent two animal production systems.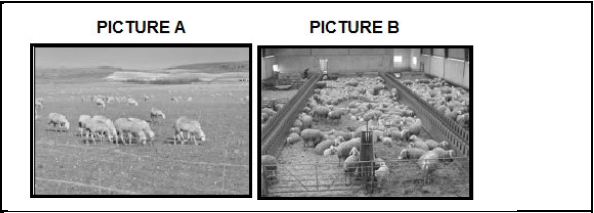
3.1.1 Identify the animal production systems represented in PICTURE A and PICTURE B above. (2)
3.1.2 Justify the answer in QUESTION 3.1.1 based on the following:
- Sustainable use of natural resources (2)
- Capital investment (2)
3.1.3 Indicate the farming system associated with each of the animal production systems identified in QUESTION 3.1.1. (2)
3.2 The pictures below shows housing facilities for farm animals.
3.2.1 Identify FACILITY 1 and FACILITY 2 in the picture above. (2)
3.2.2 Indicate the main purpose of part A in FACILITY 1 and part B in FACILITY 2 (2)
3.2.3 Name ONE equipment that can be found in FACILITY 1. (1)
3.2.4 Indicate TWO ways in which farm animals can lose body heat if FACILITY 1 is not provided. (2)
3.3 The table below represents different animal diseases commonly found in South Africa.
DISEASES | TYPE OF ANIMAL | PATHOGEN | MAIN SYMPTOMS | PREVENTAT IVE MEASURE |
A | Pigs | Virus | Vomiting and bleeding from the nose and rectum | Slaughter and disposal of infected animals and their products |
Anthrax | Cattle, sheep goats, horses and pigs | B | Swelling of neck and throat resulting in respiratory distress, muscle tremors with staggers and convulsions | C |
Heartwater | Cattle, sheep and goats | D | Thin diarrhoea with intestinal mucosa and blood | Good sanitation. Prevention of overcrowding |
E | Cattle, sheep, goats and pigs | F |
| Isolation of infected animals |
3.3.1 Complete the table by providing labels for letters A–F. (6)
3.4 The following table indicates the number of reported rabies outbreak cases per province in South Africa.
Province | Number of reported cases of rabies in 2017 | Reported cases of rabies as a percentage (%) in 2017 | Number of reported cases of rabies in 2018 |
Eastern Cape | 12 | 14 | 6 |
Free State | 9 | 10 | 3 |
Gauteng | 5 | 6 | 2 |
KwaZulu-Natal | 20 | 23 | 10 |
Western Cape | 3 | 3 | 2 |
Northern Cape | 6 | 7 | 3 |
Limpopo | 17 | 20 | 8 |
Mpumalanga | 10 | 12 | 5 |
North West | 4 | 5 | 2 |
3.4.1 Draw a bar graph representing the percentages of reported rabies cases per province in South Africa. (5)
3.4.2 Explain the trend of reported rabies cases from the table. (2)
3.4.3 Indicate the possible reason for the trend observed in QUESTION 3.4.2. (1)
3.5 Parasites live on the animal as a host and may cause harm that reduces production.
3.5.1 Provide an example for each of the following categories of ticks:
- Single-host ticks
- Three-host ticks (2)
3.5.2 Indicate TWO application methods used to control ectoparasites chemically. (2)
3.6 Name TWO services rendered by the state to protect animals from infection by diseases. (2)
[35]
QUESTION 4: ANIMAL REPRODUCTION
Start this question on a NEW page.
4.1 The diagram below illustrates the reproductive system of a bull.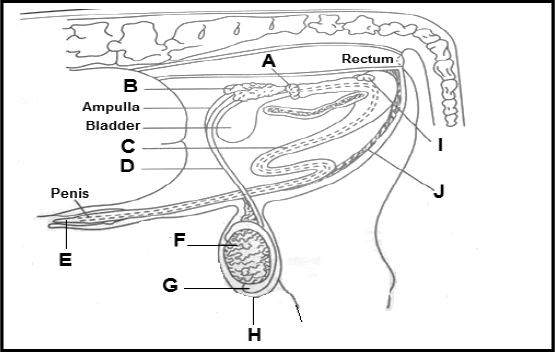
4.1.1 Identify the parts labelled B, C and E from the above DIAGRAM. (3)
4.1.2 Indicate the process taking place in part F. (1)
4.1.3 Give TWO functions of the hormone secreted in part F. (2)
4.1.4 Match the functions listed below with a letter (A–H) from the diagram above:
- Stores and allows the spermatozoa to mature (1)
- Secretes a substance that lubricates and cleans the urethra for ejaculation (1)
- Provide nutrients for the sperm cells (1)
4.1.5 Explain the importance of part H in the control of temperature for effective functioning of parts F and G. (2)
4.2 The diagram below illustrates a reproductive process occurring in farm animals.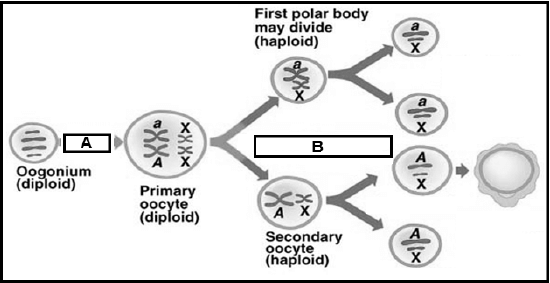
4.2.1 Identify the reproductive process illustrated in the diagram above. (1)
4.2.2 Indicate the name of an organ where the reproductive process identified in QUESTION 4.2.1 occurs. (1)
4.2.3 Name the division process taking place at A and B in the above diagram. (2)
4.3 The oestrogen hormone assists the cow with the initiation of oestrus signs.
4.3.1 Define the term oestrus. (2)
4.3.2 State TWO visible signs of oestrus in cows. (2)
4.3.3 Indicate TWO practical methods a farmer can use in identifying cows on heat. (2)
4.4 The list below represents stages during nuclear transfer process:
- Transferred into the uterus of recipient cows to grow until adulthood
- Enucleation of an unfertilised egg
- Manipulated cell is artificially activated to start dividing until it is a blastocyst
- Egg is treated and cultured in the laboratory for fusion to take place
- Nucleus containing DNA from donor is transferred into cytoplasm of the enucleated egg
Re-arrange the stages of nuclear transfer process presented in the list above into its chronological order. (5)
4.5 Give the name of a(n) organ/structure where each of the following female hormones are produced:
4.5.1 Oestrogen (1)
4.5.2 Gonadotrophic releasing hormone (GnRH) (1)
4.5.3 Progesterone (1)
4.5.4 Follicle-stimulating hormone (FSH) (1)
4.5.5 Oxytocin (1)
4.6 Multiple births is the phenomenon occurring in farm animals.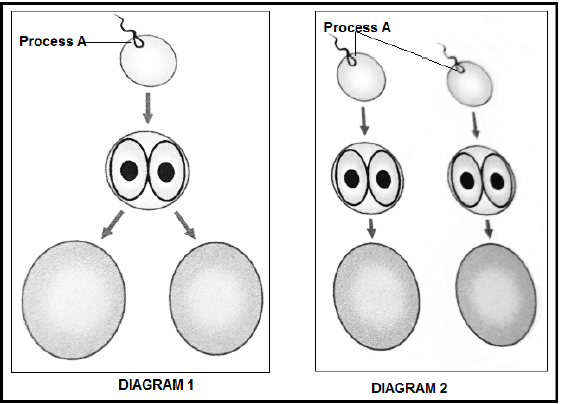
4.6.1 Identify the type of multiple births represented by DIAGRAM 1 and DIAGRAM 2. (2)
4.6.2 Justify the answer in QUESTION 4.6.1. (2) [35]
TOTAL SECTION B: 105
GRAND TOTAL: 150
Accounting Paper 2 Memorandum - Grade 12 June 2021 Exemplars
MARKING PRINCIPLES:
- Penalties for foreign items are applied only if the candidate is not losing marks elsewhere in the question for that item (no foreign item penalty for misplaced items). No double penalty applied.
- Penalties for placement or poor presentation (e.g. details) are applied only if the candidate is earning marks on the figures for that item.
- Full marks for correct answer. If the answer is incorrect, mark the workings provided.
- If a pre-adjustment figure is shown as a final figure, allocate the part-mark for the working for that figure (not the method mark for the answer).
- Unless otherwise indicated, the positive or negative effect of any figure must be considered to award the mark. If no + or – sign or bracket is provided, assume that the figure is positive.
- Where indicated, part-marks may be awarded to differentiate between differing qualities of answers from candidates.
- In calculations, do not award marks for workings if numerator and denominator are swapped – this also applies to ratios.
- Where penalties are applied, the marks for that section of the question cannot be a final negative.
- Where method marks are awarded for operation, the marker must inspect the reasonableness of the answer before awarding the mark.
- Operation means ‘Check operation’. ‘One part correct’ means ‘Operation and one part correct’.
- In awarding method marks, ensure that candidates do not get full marks for any item that is incorrect at least in part. In such cases, do not award the method mark. Indicate by way of x.
- Be aware that some candidates provide valid alternatives beyond the marking guideline.
- Codes: f = foreign item; p = placement/presentation.
MEMORANDUM
QUESTION 1
1.1
1.1.1 | True ? |
1.1.2 | False ? |
1.2 CREDITORS’ RECONCILIATION
1.2.1
Creditors control | Creditors list | |
Preliminary balance/total | R589 010 | R585 050 |
A | + 5 630 ? | + 5 630 ? |
B | + 360 ? | |
C | + 645 ? | + 645 ? |
D | - 900 ?? (-R450; - R450) | |
E | - 167 000 ?? (-83 500; - 83 500) | - 167 000 ☑ (-83 500; - 83 500) |
F | + 34 000 ? | + 34 000 ? |
G | 0 ? | 0 ? |
H | - 4 500 ? | |
Correct balance/total | 457 785 ☑ * | 457 785 |
* 1 work with for both totals. Doesn’t need to be the same, but opening balance/total has to be included.
1.3 DEBTORS ANALYSIS
1.3.1 Give TWO reasons why preparing a Debtors age analysis is a useful tool in managing debtors.
Any TWO ?? ??
- Help to identify problematic debtors
- Identify debtors who are not adhering to credit terms
- See how collections are made
1.3.2 Calculate the debtors’ collection period for 2020 and comment on your findings. Keep in mind that the debtors’ collection period for 2019 was calculated at 45 days. Provide figures in your comments.
Discuss TWO points of advice which you can offer to the credit manager.
Calculation:
? ?
½ (68 540 + 104 190) x 365 = 70 days ☑ One part correct
448 320 ?
Comment:
The debtors’ collection period deteriorated from 45 days to 70 days, which is bad for the liquidity of the business. ??
Advice:
Any TWO ?? ??
- Encourage debtors to settle their accounts within 30 days by charging interest on accounts in arrears or by offering discounts for early settlements.
- No more credit sales allowed for debtors if account is not up to date.
- Remind debtors of oustanding amounts by sending them SMSs/e-mails. 10
QUESTION 1 TOTAL MARKS: 32
QUESTION 2
2.1 MATCHING CONCEPTS
2.1.1 C ?
2.1.2 B ?
2.1.3 A ?
2.1.4 D ? 4
2.2 INVENTORY
2.2.1 Calculate the value of closing stock for rugby jerseys.
- 988 x 500 = 494 000 ?
12 x 490 = 5 880 ?☑ One part correct
499 880 ☑ One part correct 4
2.2.2 Calculate the cost of sales for rugby jerseys.
? ? ? ☑ ☑ One part correct
- 528 000 + 1 358 000 – 6 000 – 499 880 = 1 380 120 5
2.2.3 Calculate the mark-up percentage on rugby jerseys.
- 2 271 200 – 1 380 120 = 891 080 (GP)
?☑ One part correct
891 080 x 100 = 64,6% ☑ One part correct Accept 65% 4
1 380 120 ☑ See 2.2.2
2.2.4 How many months will it take to sell the rugby jerseys on hand on 31 May 2020?
☑ See 2.2.1 ?
- = 499 880 x 12 = 4,2 months ☑ One part correct 4
1 380 120
☑ See 2.2.2
2.2.5
| Calculate the value of closing stock for rugby balls. ☑ One part correct 45 000 + 1 145 000 – 2 700 + 61 140 x 120 = 184 x 120 = 22 080 | 8 |
2.2.6
Calculate the number of rugby balls missing on 31 May 2020. | 5 |
2.3 FIXED ASSETS
2.3.1
Calculate the cost of the additional garage that was built. |
2.3.2 Calculate the balance of the Accumulated Depreciation on Equipment account on 30 April 2020. (You don’t need to show the account.)
- 1 440 000 x 20% = 288 000 one mark
But carrying value is only 120 000 à Dep = 119 999 ???
Opening balance = 1 320 000 ?
1 439 999 ☑ One part correct
2.3.3 Complete the Accumulated Depreciation on Vehicles account. The account must be balanced on 30 April 2020.
| ACCUMULATED DEPRECIATION ON VEHICLES | |||||
2020 | Asset disposal (192 999? + 79 200☑) | 271 200 ☑ | 2019 | Balance b/d | 192 000 ? |
2020 | Balance c/d | 26 000 ? | 2020 | Depreciation | 79 200 ?? |
2020 | Depreciation | 26 000 ?? | |||
297 200 | 297 200 | ||||
2020 | Balance b/d | 26 000 ☑ | |||
2.3.4 Complete the Asset Disposal account.
| ASSET DISPOSAL | |||||
2020 Jan 31 | Vehicles ? | 720 000 ? | 2020 Jan 31 | Accumulated deprecia-tion on Vehicles ? | 271 200 ☑ |
Profit on sale of asset ? | 11 200 ☑ | Creditors control ? | 460 000 ? | ||
731 200 | 731 200 | ||||
QUESTION 2: TOTAL MARKS 58
QUESTION 3
3.1
3.1.1 | True ? |
3.1.2 | False ? |
3.2.1 Note for Factory overhead costs
Indirect material (8 400 + 59 400 ? – 13 200 ?) | 54 600 | ☑* |
Salary: Factory foreman / Indirect labour | 288 000 | ? |
Electricity (78 408 x 75%) | 58 806 | ?☑* |
Factory maintenance | 81 000 | ? |
Rent expense (216 000 x 2/4) | 108 000 | ?☑* |
Depreciation (97 500 x 80%) | 78 000 | ?☑* |
668 406 | ☑* |
* 1 part must be correct; -1 Foreign items; Max. 1
3.2.2 Production cost statement on 29 February 2020.
Direct labour (1 072 400 + 47 520 ?+ 10 724 ??+ 64 800 ??) | 1 195 444 | ☑* |
Direct material (115 800 + 1 445 400 ? – 46 200 ? + 57 600 ? – 69 000 ?) | 1 503 600 | ☑* |
Prime cost DL + DM | 2 699 044 | ☑ |
Factory overhead costs See 3.2.1 | 668 406 | ☑ |
Total manufacturing costs PC + FOC | 3 367 450 | ☑ |
Work-in-process (1 March 2019) | 218 400 | |
3 585 850 | ||
Work-in-process (28 February 2020) | (120 600) | ? |
Cost of production of finished goods | 3 465 250 | ☑ |
* 1 part must be correct
3.3 COST ACCOUNTING
3.3.1 Calculate the break-even point for 2020.
? ? 2 marks
- 2 193 510 + 990 000 = 3 183 510 = 96 470 ☑ One part correct
80 – (18 + 22 + 7) 33
? ?☑ 3 marks
3.3.2 Calculate the units produced during 2020. (All products were sold.)
- 1 981 800 / 18 = 110 100 ?☑ One part correct
OR 2 422 200 / 22 = 110 100
OR 770 700 / 7 = 110 100
3.3.3 Should Mickey, the owner, be concerned about the level of production for Nail Art? Give TWO reasons, with supporting figures, to motivate your answer.
TWO reasons ? ? Figures ? ?
Mark comments on 2020, according to candidate’s calculations.
- No need for concern.
- During 2019, 92 000 units were produced and sold and the break-even was 102 000. No profits were made.
- During 2020, 110 100 (see 3.3.2) units were produced and sold and the break- even was 96 470 (see 3.3.1). Profits were made on 13 630 units.
QUESTION 3: TOTAL MARKS 42
QUESTION 4
4.1 CONCEPTS
4.1.1 External ?
4.1.2 Shareholders ?
4.2.1 What kind of audit report did Knights Sports Ltd receive for the financial year ended 31 May 2020? Give ONE reason for your answer.
Unqualified ?
The report states that the statements fairly represent the financial position. ?
4.2.2 Why does the Companies Act in South Africa require public companies to be audited?
Any ONE ??
- To protect shareholders.
- Public funds are used.
- To be accountable to stakeholders eg. shareholders, SARS.
- To discourage fraud.
4.2.3 The directors feel that the audit fees charged by the external auditors are excessive. Explain how better internal control will have a positive effect on fees charged by the external auditors.
Any ONE ??
- Internal auditors will correct mistakes made by bookkeepers.
- Internal auditors will make sure all documents are in order and easy to find. External auditors will spend less time on the auditing process.
4.3.1 To which GAAP principle was the internal auditor referring to when he expressed his concern about this matter?
- (Business) entity principle ??
4.3.2 Give TWO consequences for the company should the CEO ignore the internal auditors’ advice.
Any TWO responses ?? ??
- The external auditor could classify the audit report as a qualified report
- The extra expense would lead to a smaller profit and this could result in smaller dividends for shareholders
- Suspicions could be cast over the ethics of the CEO and the company
- Lack of confidence in the CEO and the company
4.3.3 At the annual general meeting (AGM), the directors suggested that the company should sponsor a childcare facility in the local community. Give TWO reasons why companies would get involved in these kinds of activities.
Any TWO responses ?? ??
- Investing in the community from which it gains profits
- Corporate social responsibility
- Investment in the community to enhance goodwill
- Create a good/positive image of the company
- BEE points for development
- Tax deductible
QUESTION 4: TOTAL MARKS 18
TOTAL: 150
Accounting Paper 2 Questions - Grade 12 June 2021 Exemplars
INSTRUCTIONS AND INFORMATION
Read the following instructions carefully and follow them precisely.
- Answer ALL the questions.
- A special ANSWER BOOK is provided in which to answer ALL the questions.
- A FORMULA SHEET for financial indicators is attached to this question paper. You may use it if necessary.
- Show ALL workings to earn part-marks.
- You may use a non-programmable calculator.
- You may use a dark pencil or blue/black ink to answer the questions.
- Where applicable, show all calculations to ONE decimal point.
- Write neatly and legibly.
- Use the information in the table below as a guide when answering the question paper. Try NOT to deviate from it.
QUESTION | TOPIC | MARKS | TIME |
1 | Reconciliation | 32 | 25 |
2 | Inventory Valuation and Fixed Assets | 58 | 45 |
3 | Manufacturing and Cost Accounting | 42 | 35 |
4 | Internal and Financial Control; Ethics | 18 | 15 |
QUESTIONS
QUESTION 1: RECONCILIATIONS AND INTERNAL CONTROL
(32 marks; 25 minutes)
1.1 CONCEPTS
Indicate whether the following statements are TRUE or FALSE. Write only ‘true’ or ‘false’ next to the question numbers (1.1.1–1.1.2) in the ANSWER BOOK.
1.1.1 Debtors forms part of current liabilities of a business.
1.1.2 Trade discount is entered as follows:
Debit Creditors Control and Credit Discount Received (2)
1.2 CREDITORS’ RECONCILIATION
You are provided with information on East Cape Traders. The Creditors’ Control Account and the Creditors’ List were prepared by an inexperienced bookkeeper on 31 May 2020.
The Creditors’ Control Account shows a credit balance of R589 010 and the Creditors’ List shows a total of R585 050.
As internal auditor, you discovered the errors and omissions given below.
REQUIRED:
1.2.1 Record the following errors and omissions in the given table in the ANSWER BOOK and calculate the correct balance and total. (16)
INFORMATION:
Errors and omissions discovered:
- A debit balance of R5 630 of one of the creditors must be transferred to their account in the debtors’ ledger.
- Discount received from a creditor, R590, was erroneously posted to the creditors’ ledger as R950.
- Interest of R645 on an overdue account, was not entered at all.
- An amount of R450 from the Creditors Allowance Journal was posted to the wrong side of the creditors’ account.
- Goods worth R83 500 returned to a creditor was incorrectly entered as a credit purchase.
- A credit invoice for goods purchased, R34 000 has not been entered at all.
- Goods purchased on credit from West Wholesalers for R72 000, was credited to the account of East Wholesalers.
- The column for creditors in the Creditors’ Allowance Journal was under cast by R4 500.
1.3 DEBTORS’ ANALYSIS
REQUIRED:
1.3.1 Give TWO reasons why preparing a Debtors’ age analysis is a useful tool in managing debtors. (4)
1.3.2 Calculate the debtors’ collection period for 2020 and comment on your findings. Keep in mind that the debtors’ collection period for 2019 was calculated at 45 days. Provide figures in your comments.
Discuss TWO points of advice which you can offer to the credit manager. (10)
INFORMATION:
Extract from the financial statements on year end:
29 February 2020 | 28 February 2019 | |
Total sales | 816 240 | 1 211 000 |
| 367 920 | 525 600 |
| 448 320 | 685 400 |
Cost of sales | 396 940 | 538 220 |
Trade debtors (net) | 104 190 | 68 540 |
[32]
QUESTION 2: INVENTORY; FIXED ASSETS
(58 marks; 45 minutes)
2.1 MATCHING CONCEPTS
Choose a description in COLUMN B that matches the term in COLUMN A. Write only the letters (A–D) next to the question numbers (2.1.1–2.1.4) in the ANSWER BOOK.
COLUMN A | COLUMN B | ||
2.1.1 | Specific identification method | A | Cost price minus accumulated depreciation |
2.1.2 | Weighted average method | B | Stock valuation method used for similar goods of low value |
2.1.3 | Carrying value | C | Stock valuation method used for expensive and diverse goods |
2.1.4 | FIFO | D | Stock system whereby the oldest stock is sold first |
(4 x 1) (4)
2.2 INVENTORY
You are provided with information on Champions Traders. They sell rugby jerseys and rugby balls. They use the periodic stock system.
REQUIRED:
2.2.1 Calculate the value of closing stock for rugby jerseys. (4)
2.2.2 Calculate the cost of sales for rugby jerseys. (5)
2.2.3 Calculate the mark-up percentage on rugby jerseys. (4)
2.2.4 How many months will it take to sell the rugby jerseys on hand on 31 May 2020? (4)
2.2.5 Calculate the value of closing stock for rugby balls. (8)
2.2.6 Calculate the number of rugby balls missing on 31 May 2020. (5)
INFORMATION:
A The stock valuation system used:
- for rugby jerseys is First-In-First-Out (FIFO).
- for rugby balls is the weighted average system.
B Stock values:
Rugby jerseys | Rugby balls | |||||
Number of units | Price per unit | Total value | Number of units | Price per unit | Total value | |
01/06/19 | 1 200 | R440 | R528 000 | 300 | R150 | R45 000 |
31/05/20 | 1 000 | ? | ? | 120 | ? | ? |
C Purchases during the year:
Rugby jerseys | Rugby balls | |||||
Number of units | Price per unit | Total value | Number of units | Price per unit | Total value | |
20/09/19 | 800 | R460 | R368 000 | 1 500 | R150 | R225 000 |
20/12/19 | 1 000 | R490 | R490 000 | 3 000 | R180 | R540 000 |
20/03/20 | 1 000 | R500 | R500 000 | 2 000 | R190 | R380 000 |
2 800 | R1 358 000 | 6 500 | R1 145 000 | |||
D Stock returned: (Faulty stock has to be returned within 5 days of purchase.)
- 12 rugby jerseys returned on 24 March 2020.
- 15 rugby balls returned on 23 December 2019.
E
- Delivery fees for rugby jerseys are included in the price charged by suppliers.
- Carriages paid on rugby balls, amounts to R61 140.
F Sales during the year:
- Rugby jerseys: 3 000 units to the value of R2 271 200.
- Rugby balls: 6 660 units to the value of R2 669 040.
2.3 FIXED ASSETS
The information below is taken from Praven Traders on 30 April 2020, end of the financial year.
REQUIRED:
2.3.1 Calculate the cost of the additional garage that was built. (1)
2.3.2 Calculate the balance of the Accumulated Depreciation on Equipment account on 30 April 2020. (You don’t need to show the account.) (5)
2.3.3 Complete the Accumulated Depreciation on Vehicles account. The account must be balanced on 30 April 2020. (10)
2.3.4 Complete the Asset Disposal account. (8)
INFORMATION:
A Balances:
| 30 April 2020 | 30 April 2019 | |
| Land and Buildings | 2 266 000 | 1 966 000 |
| Vehicles | 520 000 | 720 000 |
| Equipment | 1 440 000 | 1 440 000 |
| Accumulated depreciation on Vehicles | ? | 192 000 |
| Accumulated depreciation on Equipment | ? | 1 320 000 |
B. Additional information:
- During the year an additional garage was built to accommodate the bigger delivery vehicle that was purchased.
- At the beginning of the year Praven Traders only had one vehicle. On 31 January 2020 this vehicle was traded in for R460 000, on a new delivery vehicle from Blitz Motors.
- Vehicles are depreciated on the diminishing balance method at 20% p.a.
- Equipment are depreciated by 20% per year on cost.
[58]
QUESTION 3: MANUFACTURING AND COST ACCOUNTING
(42 marks; 35 minutes)
3.1 CONCEPTS
Indicate whether the following statements are TRUE of FALSE. Write only ‘true’ or ‘false’ next to the question numbers (3.1.1–3.1.2) in the ANSWER BOOK.
3.1.1 Fixed costs do not change when the number of units produced changes.
3.1.2 Primary costs consist of direct labour plus indirect labour. (2)
3.2 PRODUCTION COST STATEMENT
You are provided with information on Kyle’s Creations, the manufacturers of sports bags.
REQUIRED:
3.2.1 Complete the note for Factory overhead costs. (12)
3.2.2 Complete the Production cost statement on 29 February 2020. (16)
INFORMATION:
A Balances:
28 February 2019 | 29 February 2020 | ||
Raw material | 115 800 | 69 000 | |
Work-in-process | 218 400 | 120 600 | |
Indirect material | 8 400 | 13 200 | |
B Transactions during the year:
Raw materials purchased | 1 445 400 |
Raw materials returned | 46 200 |
Carriage on raw materials | 57 600 |
Production wages | 1 072 400 |
Pension contributions | 47 520 |
Salary: Factory foreman (contributions included) | 288 000 |
Advertisements | 117 776 |
Electricity | 78 408 |
Indirect material for factory use purchased | 59 400 |
Factory maintenance | 81 000 |
Rent expense | 216 000 |
Depreciation | 97 500 |
C Additional information:
- UIF payments for the year need to be added.
- Overtime needs to be taken into account: 6 workers worked a total of 270 hours each at a rate of R40 per hour.
- 75% of electricity expense is allocated to the factory.
- Rent are allocated as 2 : 1 : 1 to the factory, sales and administrative offices.
- 80% of depreciation is allocated to the factory.
3.3 COST ACCOUNTING
You are provided with information from the records of Nail Art, the producers of nail polish products on 30 April 2020.
REQUIRED:
3.3.1 Calculate the break-even point for 2020. (6)
3.3.2 Calculate the units produced during 2020 (All products were sold). (2)
3.3.3 Should Mickey, the owner, be concerned about the level of production for Nail Art? Give TWO reasons, with supporting figures, to motivate your answer. (4)
INFORMATION:
Total cost | Unit cost | |
Direct labour | 1 981 800 | 18,00 |
Direct material | 2 422 200 | 22,00 |
Selling and distribution cost | 770 700 | 7,00 |
Factory overhead cost | 2 193 510 | |
Administration cost | 990 000 | |
30 April 2020 | 30 April 2019 | |
Selling price per unit | 80,00 | 60,00 |
Units produced and sold | ? | 92 000 |
Break-even point | ? | 102 000 |
[42]
QUESTION 4: FINANCIAL AND INTERNAL CONTROL (18 marks; 15 minutes)
4.1 CONCEPTS
Choose the correct word from those given in brackets. Write only the chosen word next to the question numbers (4.1.1–4.1.2) in the ANSWER BOOK.
4.1.1 The audit report is compiled by the (internal/external) auditors.
4.1.2 Audit reports are directed to (shareholders/directors) of the company. (2)
4.2 FINANCIAL CONTROL
You are provided with information from the records of Knights Sports Ltd.
REQUIRED:
4.2.1 What kind of audit report did Knights Sports Ltd receive for the financial year ended 31 May 2020? Give ONE reason for your answer. (2)
4.2.2 Why does the Companies Act in South Africa require public companies to be audited? (2)
4.2.3 The directors feel that the audit fees charged by the external auditors are excessive. Explain how better internal control will have a positive
effect on fees charged by the external auditors. (2)
INFORMATION:
EXTRACT FROM THE AUDIT REPORT OF KNIGHTS SPORTS LTD In our opinion, the financial statements fairly present the financial position of the company in all material aspects on 31 May 2020. The results of operations and cash flow for the year ended are in accordance with International Financial Reporting Standards and in the manner required by the Companies Act in South Africa. LM Williams & Associates |
4.3 INTERNAL CONTROL
The internal auditor warned the chief executive officer (CEO) that it might create problems for the company should he insist to add his private vehicle expenses as part of Sundry expenses in the company’s Income statement.
REQUIRED:
4.3.1 To which GAAP principle was the internal auditor referring to when he expressed his concern about this matter? (2)
4.3.2 Give TWO consequences for the company should the CEO ignore the internal auditors’ advice. (4)
4.3.3 At the annual general meeting (AGM), the directors suggested that the company should sponsor a childcare facility in the local community, by donating goods and cash to this facility. Give TWO reasons why companies would get involved in these kinds of activities. (4)
[18]
TOTAL: 150
Accounting Paper 1 Memorandum - Grade 12 June 2021 Exemplars
MARKING PRINCIPLES:
- Unless otherwise stated in the marking guideline, penalties for foreign items are applied only if the candidate is not losing marks elsewhere in the question for that item (no penalty for misplaced item). No double penalty applied.
- Penalties for placement or poor presentation (e.g. details) are applied only if the candidate is earning marks on the figures for that item.
- Full marks for correct answer. If the answer is incorrect, mark the workings provided.
- If a pre-adjustment figure is shown as a final figure, allocate the part-mark for the working for that figure (not the method mark for the answer). Note: If figures are stipulated in memo for components of workings, these do not carry the method mark for final answer as well.
- Unless otherwise indicated, the positive or negative effect of any figure must be considered to award the mark. If no + or – sign or bracket is provided, assume that the figure is positive.
- Where indicated, part-marks may be awarded to differentiate between differing qualities of answers from candidates.
- Where penalties are applied, the marks for that section of the question cannot be a final negative.
- Where method marks are awarded for operation, the marker must inspect the reasonableness of th answer and at least one part must be correct before awarding the mark.
- 'Operation' means 'Check operation'. 'One part correct' means 'Operation and one part correct'. Note: check operation must be +, -, x, ÷, or as per memo.
- In calculations, do not award marks for workings if numerator & denominator are swapped – this also applies to ratios.
- In awarding method marks, ensure that candidates do not get full marks for any item that is incorrect at least in part. In such cases, do not award the method mark. Indicate by way of x
- Be aware of candidates who provide valid alternatives beyond the marking guideline.
- Codes: f = foreign item; p = placement/presentation.
QUESTIONS
QUESTION 1: CONCEPTS, ANALYSIS OF TRANSACTIONS AND AUDIT REPORT
1.1 CONCEPTS 1.1
1.1.1 | Directors √ |
1.1.2 | Internal √ |
1.1.3 | Inside trading √ |
1.2 ANALYSIS OF TRANSACTIONS
ACCOUNT TO BE DEBITED | ACCOUNT TO BE CREDITED | AMOUNT | A | O | L | |
1.2.1 |
Income tax √ |
SARS (Income tax) √ |
330 000 |
0 |
-√ |
+√ |
1.2.2 |
Ordinary share capital √ |
Bank |
√ 105 000 |
-√ |
-√ |
0 |
Retained income √ |
Bank |
15 000 |
-√ |
-√ |
0 |
Effect on accounting equation: If blank, assume 0; -1 per line for foreign entry; Mark sign + or – independent from the details
1.3 AUDIT REPORT
| 1.3.1 | Explain why the auditors found it necessary to stipulate the page numbers in the report. | |
Any ONE valid explanation ?? Part-mark for unclear / incomplete answer
| 2 |
1.3.2
| What type of report did Zenko Ltd receive from the independent auditors? Explain your answer. | |
| Type of report: Qualified ?
| 3 |
1.3.3 State TWO possible consequences for the independent auditor if he had NOT mentioned the donation in his report.
Any TWEE valid points ? ?
- He could face a disciplinary hearing by the professional body.
- He may be charged/fined/lose his license to practise.
- He may not be reappointed as an external auditor. 2
1.3.4 Explain why the company would make contributions towards outreach programmes in the local community. Mention TWO points.
One valid point ?? Part-marks for unclear / incomplete answer
- Companies are expected to contribute to the communities that support them (corporate social responsibilities) / They are expected to put back into the community as well as the environment.
- The King code prescribes that companies concentrate on the triple- bottom line and not just profits.
- Positive publicity will improve their image and their support. 4
TOTAL MARKS: 25
QUESTION 2: BALANCE SHEET (STATEMENT OF FINANCIAL POSITION) AND NOTES
MAKIZOLE LIMITED
2.1
(a)
Complete the following notes for the financial year ended 29 February 2020. | |||
ORDINARY SHARE CAPITAL | |||
AUTHORISED: 1 400 000 shares | |||
ISSUED | |||
650 000 | Shares in issue on 1 March 2019 | 3 200 000 | ?? |
250 000 | Shares issued during the year | 1 300 000 | |
(100 000)? | Shares repurchased at R5?? (ASP) | (500 000) | ☑* |
800 000☑ | Shares in issue at 29 February 2020 | 4 000 000 | ☑ |
(b)
RETAINED INCOME | ||
Balance at the beginning of the year | 745 000 | |
Net profit after tax (405 500?+ 35 500?) x 70/30 ? | 1 029 000 | ☑* |
Shares repurchased (100 000 x 30c) | (30 000) | ?? |
Dividends on ordinary shares operation | (710 000) | ☑ |
Interim dividends paid | 390 000 | ? |
see (a) bove | 320 000 | ☑* |
Balance at the end of the year operation | 1 034 000 | ☑ |
*one part correct
2.2
BALANCE SHEET ON 29 FEBRUARY 2020 | |||
ASSETS | |||
NON-CURRENT ASSETS TA - CA | 5 362 500 | ☑ | |
Fixed assets | Balancing figure (NCA-FA) | 5 183 750 | ☑ |
Financial assets: Fixed deposit | 178 750 | ☑* | |
CURRENT ASSETS | operation | 1 505 340 | ☑ |
Inventories (460 000??+ 35 000??+9 800?) | 504 800 | ☑* | |
Trade and other receivables (473 000?- 18 500? + 7 150?) | 461 650 | ☑* | |
see fixed dep. above | 538 890 | ☑? | |
TOTAL ASSETS | TE+L | 6 867 840 | ☑ |
EQUITY AND LIABILITIES | |||
ORDINARY SHAREHOLDERS’ EQUITY | operation | 5 034 000 | ☑ |
Ordinary share capital | see 2.1 (a) | 4 000 000 | ☑ |
Retained income | see 2.1 (b) | 1 034 000 | ☑ |
NON-CURRENT LIABILITIES | |||
Loan: Capital Bank | OSE x 0,1 | 503 400 | ☑☑ |
CURRENT LIABILITIES | operation | 1 330 440 | ☑ |
Trade and other payables (727 760?+ 46 000??) | 773 760 | ☑* | |
Current portion of loan | 100 680 | ||
Shareholders for dividends | See RI note | 320 000 | ☑ |
SARS (Income tax) | 35 500 | ? | |
see 2.1 (500 000+30 000) Bank overdraft (530 000☑ - 429 500?) | 100 500 | ☑* | |
TOTAL EQUITY AND LIABILITIES | operation | 6 867 840 | ☑ |
Note: Depending on calculation for re-purchase of shares, the bank overdraft figure can also appear under cash and cash equivalents
*one part correct
TOTAL MARKS: 55
QUESTION 3: CASH FLOW STATEMENT, FINANCIAL INDICATORS AND INTERPRETATION
3.1
3.1.1 | C (Depreciation) ? |
3.1.2 | B (Inflow of cash) ? |
3.1.3 | A (Working capital) ? |
3.2 CACADU LTD
3.2.1
Calculate the following amounts for the Cash Flow Statement: | |
Operating profit before changes in working capital | |
Workings | Answer |
1 650 000 ?+ 578 050?+ (231 670? + 670 890? - 789 140?) 113 420 3 marks | 2 341 470☑ |
Income tax paid | |
Workings | Answer |
-11 500? + (1 650 000 - 1 188 000)?? + 16 400? | 466 900 ☑ |
Dividends paid | |
Workings | Answer |
77 000? + 1 255 000? - 810 000? | 522 000 ☑ |
[4]
3.2.2
Complete the following sections of the Cash Flow Statement: | ||
CASH EFFECTS FROM INVESTING ACTIVITIES operation |
(2 890 250) |
☑ |
Purchase of fixed assets ( 4 895 000ü + 578 050ü + 900 250ü – 2 582 800ü) |
(3 790 500) |
☑* |
Proceeds from sale of fixed assets |
900 250 |
ü |
* one part correct | ||
Note: The figure and the brackets (or no brackets) must be correct to earn the mark in the money column.
CASH EFFECTS FROM FINANCING ACTIVITIES | 2 749 550 | ☑ |
Proceeds from the issue of shares | 2 984 800 | |
Repurchase of shares | (117 000) | ? |
Repayment of non-current liabilities | (118 250) | ☑√ |
Note: The figure and the brackets (or no brackets) must be correct to earn the mark in the money column. | ||
NET CHANGE IN CASH AND CASH EQUIVALENTS | (88 200) | |
Cash and cash equivalents (beginning of year) | 329 450 | ?? |
Cash and cash equivalents (end of year) | 241 250 | |
Note: The figure and the brackets (or no brackets) must be correct to earn the mark in the money column.
3.2.3
Calculate the following financial indicators on 30 June 2019: | |
% Operating expenses on sales | |
Workings | Answer |
1 316 800 2 marks | 40% ☑ |
% Return on average shareholders’ equity (ROSHE)
Workings | Answer |
1 188 000 ? 100 | 22,3% ☑ |
3.2.4 Quote TWO financial indicators with figures and trends which should be a concern to the company’s liquidity.
financial indicators √ √ figures and trend √ √
Only these TWO are acceptable:
- Stock turnover rate declined from 7 to 4 times (or by 3 times)
- Debtors’ collection period increased from 30 to 40 days (by 10 days)
3.2.5 Comment on the degree of financial risk and gearing of the company. Quote TWO financial indicators with figures and trends to support your answer.
financial indicators √√ figures and trend √? comment ??
- Debt/equity improved from 0,2:1 to 0,1:1, (by 0,1).
- Return on capital employed decrease from 29,4% to 29,1%, (by 0,3)
Comment:
The company is lowly geared/the risk has decreased.
Although the ROTCE decreased slightly, the company is positively geared as the return is still higher than the interest rate on loan of 13%.
TOTAL MARKS: 55
QUESTION 4: ANALYSIS AND INTERPRETATION OF TWO COMPANIES
4.1
Calculate the number of shares that Alton can buy in Lion Ltd. | |
Workings | Answer |
130 000 ÷ R6,50 | 20 000 ?? * |
4.2
Alton is more interested in purchasing the additional shares in Lion Ltd. Provide TWO reasons why he feels this way. Make reference to a comparison between both companies in your answer. | |
REASON ?? ?? | FIGURES (with comparison) ? ? |
Although the market price is higher, it is better than the NAV, indicating that shares in this company are in demand. It has a better image in the eye of the public. | Lion: MP 650 cents; NAV 622 cents Bull: MP 340 cents; NAV 412 cents |
He will become the majority shareholder in this company. He is already the majority shareholder in the other company. | Lion: 260 000/500 000 = 52% |
4.3
Alton is happy with the DPS at Lion Ltd. Provide ONE reason why. | |
REASON ?? | FIGURE ? |
Although the company paid only 45,3% of the EPS to shareholders, they have taken a decision to retain 54,7% of this to concentrate on the future growth of the company. | 45,3% |
Provide ONE reason for the dividend policy at Bull Ltd. | |
REASON ?? | FIGURE ? |
Bull is paying 80,7% of EPS as DPS | 80,7% or retained only 19,3% of the EPS. |
4.4
Comment on the return on investment of both companies. | 6 | |||
COMMENT ?? ?? for each company | FIGURES (with comparisons) √ ? | |||
Lion Ltd | Lion: 12,2% | |||
Bull Ltd | Bull: 6,7% | |||
TOTAL MARKS: 20
TOTAL: 150
Accounting Paper 1 Questions - Grade 12 June 2021 Exemplars
INSTRUCTIONS AND INFORMATION
Read the following instructions carefully and follow them precisely.
- Answer ALL the questions.
- A special ANSWER BOOK is provided in which to answer ALL the questions.
- Show ALL workings to earn part-marks.
- You may use a non-programmable calculator.
- You may use a dark pencil or blue/black ink to answer the questions.
- Where applicable, show ALL calculations to ONE decimal point.
- If you choose to do so, you may use the Financial Indicator Formula Sheet attached at the end of this question paper. The use of this formula sheet is NOT compulsory.
- Write neatly and legibly.
- Use the information in the table below as a guide when answering the question paper. Try NOT to deviate from it.
QUESTION | TOPIC | MARKS | TIME |
1 | Concepts, Analysis of transactions and Audit report | 25 | 20 |
2 | Balance sheet (Statement of Financial Position) and Notes | 55 | 45 |
3 | Cash flow statement, Financial indicators and Interpretation | 50 | 40 |
4 | Analysis and interpretation of two companies | 20 | 15 |
TOTAL | 150 | 120 | |
QUESTIONS
QUESTION 1: CONCEPTS, ANALYSIS OF TRANSACTIONS AND AUDIT REPORT
(25 marks; 20 minutes)
1.1 CONCEPTS
Choose the correct word(s) from those given in brackets. Write only the word(s) next to the question number (1.1.1–1.1.3) in the ANSWER BOOK.
1.1.1 The (shareholders / directors) are responsible for the management duties of the company.
1.1.2 The management of the company appoints the (external / internal) auditor.
1.1.3 (Inside trading / White-collar crime) is the use of confidential information by someone in the company in order to get advantage over others. (3 x 1) (3)
1.2 ANALYSIS OF TRANSACTIONS
REQUIRED:
Complete the table provided to indicate the account to be debited and credited as well as the effect on the accounting equation for each transaction:
Note:
Accept that the bank balance is favourable.
TRANSACTIONS:
1.2.1 The income tax for the year is calculated at R330 000.
1.2.2 Paid R120 000 for the repurchase of shares. This is R15 000 more than the value of the shares in the books of the company. (11)
1.3 AUDIT REPORT FOR YEAR ENDED 31 DECEMBER 2019
The financial statements of Zenko Ltd were audited. You are provided with extracts from the audit report.
EXTRACTS FROM THE AUDIT REPORT:
Independent Auditors' Responsibility Basis for … Opinion … Audit Opinion |
REQUIRED:
1.3.1 Explain why the auditors found it necessary to stipulate the page numbers in the report. (2)
1.3.2 What type of report did Zenko Ltd receive from the independent auditors? Explain your answer. (3)
1.3.3 State TWO possible consequences for the independent auditor if he had NOT mentioned the donation in his report. (2)
1.3.4 Explain why the company would make contributions towards outreach programmes in the local community. Mention TWO points. (4)
[25]
QUESTION 2: BALANCE SHEET (STATEMENT OF FINANCIAL POSITION) AND NOTES
(55 marks; 45 minutes)
MAKIZOLE LIMITED
You are provided with information for the financial year ended 29 February 2020.
REQUIRED:
2.1 Complete the following notes for the financial year ended 29 February 2020.
- Ordinary share capital (8)
- Retained income (12)
2.2 Complete the Balance Sheet (Statement of Financial Position) on 29 February 2020.
Where notes are not required, show ALL workings. (35)
INFORMATION:
A. Extract from the books on 29 February 2020:
Balance sheet accounts section | R |
Ordinary share capital | 4 500 000 |
Retained income | 745 000 |
Fixed assets at carrying value (balancing figure) | ? |
Trading stock ( see information D) | ? |
Debtors’ control | 473 000 |
Provision for bad debts | 18 500 |
Bank (favourable) | 429 500 |
Water and electricity deposit | 2 640 |
Fixed deposit: Shallow Bank (6% p.a.) | 715 000 |
Creditors’ control | 727 760 |
SARS (Income tax) | 405 500 |
Nominal accounts section | |
Consumable stores | 119 750 |
Interest on fixed deposit | 35 750 |
Directors’ fees | 552 000 |
Dividends on ordinary shares | 390 000 |
B. Share capital:
- The company is authorised to sell 1 400 000 ordinary shares.
- 650 000 shares were in issue on 1 March 2019.
- 250 000 new shares were issued on 1 September 2019. The amount of R1 300 000 was received and has been properly recorded.
- 100 000 shares were repurchased on 5 February 2020 from an unsatisfied shareholder for 30 cents above the average share price. This transaction was not recorded. This shareholder does not qualify for final dividends.
C. Dividends:
- An interim dividend was paid on 20 August 2019.
- The directors declared a final dividend of 40 cents per share on 29 February 2020.
D Stock records:
The first-in-first-out method of valuing stock is used.
Number of units | Price per unit | Total (R) | |
Stock balances: | |||
1 March 2019 | 1 000 | 250 | 250 000 |
29 February 2020 | 1 250 | ? | |
Purchases: | 10 500 | 3 380 000 | |
April 2019 | 5 000 | R300 | 1 500 000 |
July 2019 | 4 000 | R350 | 1 400 000 |
January 2020 | 1 200 | R400 | 480 000 |
Returns: 50 units from the order received in January 2020. | |||
E. The following adjustments have not been taken into account:
- Consumable stores used during the year amounts to R109 950.
- Interest on fixed deposit still outstanding, R7 150.
- The three directors earn the same monthly fees. The third director was appointed on 1 January 2020 and has not been paid yet.
F. 75% of the fixed deposit matures on 31 March 2020.
G. After the actual tax was calculated on the corrected net profit for the year, it was found that the provisional tax paid was R35 500 less than the actual tax.
H. Income tax is calculated at 30% of net profit.
I. After processing all adjustments the debt-equity ratio is 0,1 : 1.
[55]
QUESTION 3: CASH FLOW CALCULATIONS, FINANCIAL INDICATORS AND INTERPRETATION
(50 marks; 40 minutes)
3.1 Choose the correct term to complete each of the following statements. Write only the letter (A–D) next to the question numbers (3.1.1 to 3.1.3) in the ANSWER BOOK.
A | Working capital |
B | Inflow of cash |
C | Depreciation |
D | Outflow of cash |
3.1.1 … is regarded as a non-cash item.
3.1.2 A decrease in trading stock will indicate a/an …
3.1.3 Current assets minus current liabilities are referred to as … (3 x 1) (3)
3.2 CACADU LTD
The following information was taken from the accounting records of CACADU Ltd. The financial year ended on 30 June 2019.
REQUIRED:
3.2.1 Calculate the following amounts for the Cash Flow Statement:
- Operating profit before changes in working capital (6)
- Income tax paid (5)
- Dividends paid (4)
3.2.2 Complete the following sections of the Cash Flow Statement:
- Cash effects from investing activities (7)
- Cash effects from financing activities (4)
- Net change in cash and cash equivalents (2)
3.2.3 Calculate the following financial indicators on 30 June 2019:
- % Operating expenses on sales (4)
- % Return on average shareholders equity (ROSHE) (5)
3.2.4 Quote TWO financial indicators with figures and trends which should be a concern to the company’s liquidity.(4)
3.2.5 Comment on the degree of financial risk and gearing of the company. Quote TWO financial indicators with figures and trends to support your answer.(6)
INFORMATION:
A. Information taken from the Income Statement on 30 June 2019:
Sales | 7 920 000 |
Gross operating income | 3 070 220 |
Operating profit | 1 753 420 |
Depreciation | 578 050 |
Interest on loan | ? |
Net profit before tax | 1 650 000 |
Net profit after tax | 1 188 000 |
B. Information taken from the Balance sheet on 30 June:
2019 | 2018 | |||
Fixed Assets (at carrying value) | 4 895 000 | 2 582 800 | ||
Shareholders equity | 6 708 900 | 3 945 700 | ||
Ordinary share capital | 6 344 800 | 3 465 000 | ||
Retained income | 364 100 | 480 700 | ||
Fixed deposit: Bruce Bank | 100 000 | 100 000 | ||
Bank | 241 250 | Dr | ? | |
Loan: V&R Bank | ? | ? | ||
SARS: Income Tax | 16 400 | Dr | 11 500 | Dr |
Shareholders for dividends | 810 000 | 77 000 | ||
C. Ordinary shares:
- On 1 March 2019 shares were bought back from the insolvent estate of a shareholder. A cheque for R117 000 was issued which is R12 000 more than the average price.
- On 30 June 2019, R2 984 800 was received from new shareholders and their names were entered into the shareholders register.
D. Ordinary dividends:
The total dividend for the year amounted to R1 255 000.
E. Fixed assets were sold at carrying value, R900 250..
F. The loan statement received from V&R Bank on 30 June 2019 reflected the following:
R | |
Balance at the beginning of the financial year | 789 140 |
Repayments during the year (including interest) | 231 670 |
Interest capitalised | ? |
Balance at the end of the financial year | 670 890 |
G. Other financial information and indicators for the past two years:
2019 | 2018 | |
Current ratio | 2,1 : 1 | 1,8 : 1 |
Acid test ratio | 1,1 : 1 | 1,2 : 1 |
Stock turnover rate | 4 times | 7 times |
Debtors’ collection period | 40 days | 30 days |
Creditors’ payment period | 60 days | 60 days |
Debt/Equity ratio | 0,1 : 1 | 0,2 : 1 |
% return on shareholder’s equity | ? | 20,2% |
% return on capital employed | 29,1% | 29,4% |
Interest rate on loans | 13% | 12% |
[50]
QUESTION 4: ANALYSIS AND INTERPRETATION OF TWO COMPANIES
(20 marks; 15 minutes)
Alton Jantjes owns shares in Lion Ltd and in Bull Ltd.
He recently inherited R130 000 and wants to increase his investment in either of these companies.
NOTE: Both companies have no intention in issuing additional shares (to increase the share capital).
REQUIRED:
Where necessary, quote figures, percentages and financial indicators to motivate your answers.
4.1 Calculate the number of shares that Alton can buy in Lion Ltd. (2)
4.2 REFER TO THE SHARE CAPITAL AND THE SHARE PRICES:
Alton is more interested in purchasing the additional shares in Lion Ltd. Provide TWO reasons why he feels this way.
Make reference to a comparison between both companies in your answer. (6)
4.3 REFER TO THE DPS AND THE EPS:
- Alton is happy with the DPS at Lion Ltd. Provide ONE reason why. (3)
- Provide ONE reason for the dividend policy at Bull Ltd. (3)
4.4 Comment on the return on investment of both companies. Provide ONE separate point for each company. (6)
INFORMATION:
Information is for both companies for the year ended 29 February 2020.
LION LTD | BULL LTD | |
Ordinary share capital (number of shares in issue) | 500 000 | 900 000 |
Number of shares owned by Alton | 240 000 | 460 000 |
Price of shares on JSE (market price) | 650 cents | 340 cents |
Net asset value (NAV) per share | 622 cents | 412 cents |
Dividends per share (DPS) | 34 cents | 42 cents |
Earnings per share (EPS) | 75 cents | 52 cents |
Average return on shareholders’ equity (ROSHE) | 12,2% (13% in 2019) | 6,7% (9% in 2019) |
Interest rate on fixed deposit | 8% (in both years) | |
[20]
TOTAL:150
GRADE 12 ACCOUNTING FINANCIAL INDICATOR FORMULA SHEET | |
Gross profit x 100 | Gross profit x 100 |
Net profit before tax x 100 | Net profit after tax x 100 |
Operating expenses x 100 | Operating profit x 100 |
Total assets : Total liabilities | Current assets : Current liabilities |
(Current assets – Inventories) : Current liabilities | Non-current liabilities : Shareholders' equity |
(Trade & other receivables + Cash & cash equivalents) : Current liabilities | |
Average trading stock x 365 | Cost of sales . |
Average debtors x 365 | Average creditors x 365 |
Net income after tax x 100 | Net income after tax x 100 (*See note below) |
Net income before tax + Interest on loans x 100 | |
Shareholders' equity x 100 | Dividends for the year x 100 |
Interim dividends x 100 | Final dividends x 100 |
Dividends per share x 100 | Dividends for the year x 100 |
Total fixed costs . | |
Note: | |
Mathematical Literacy Paper 2 Memorandum - Grade 12 June 2021 Exemplars
Symbol | Explanation |
M | Method |
M/A | Method with accuracy |
MCA | Method with consistent accuracy |
CA | Consistent accuracy |
A | Accuracy |
C | Conversion |
S | Simplification |
RT/RG/RM | Reading from a table OR Reading from a graph OR Read from map |
F | Choosing the correct formula |
SF | Substitution in a formula |
J | Justification |
P | Penalty, e.g. for no units, incorrect rounding off etc. |
R | Rounding off OR Reason |
AO | Answer only |
NPR | No penalty for rounding |
MEMORANDUM
QUESTION 1 [20] | |||
Ques. | Solution | Explanation | Level |
1.1.1 | 547 x 1 000 √ | 1 MA correct values | L1 M&P |
1.1.2 | N7 √ | 1 A (2) | L1 M&P |
1.1.3 | 5 √√ | 2 A (2) | L1 M&P |
1.2.1 | Distance around a figure √√ OR Sum of the sides of a figure √ √ | 2 A correct definition (2) | L1 M |
1.2.2 | 9 + 13 +12 +14 √ | 1 MA adding correct values | LI M |
1.2.3 | 9 : 14 √√ | 1 A correct values | L1 |
1.2.4 | 13 – 9 √ | 1 A correct values | L1 M |
1.3.1 | 42,2 x 100 000 √ | 1 C | L1 |
1.3.2 | 4,7 x 60 √ | 1 M multiplying by 60 | L1 |
1.3.3 | 0,75 x 42,2 √ | 1 MA multiplying | L1 |
QUESTION 2 [30] | |||
Ques. | Solution | Explanation | Level |
2.1.1 | South West√√ | 2A First direction | L2 |
2.1.2 | Scale 15 cm√ = 200 km | 1A Distance on map | L3 |
2.1.3 | Scale 15 cm : 200 km | CA from 2.1.2 | L3 |
2.1.4 | Japan was the host country √√ OR The other countries were not the host countries √√A | 2A Reason (2) | L4 |
2.1.5 | Russia √√ | 2 A correct country (2) | L1 |
2.2.1 | Clanwilliam and Citrusdal | MA Subtracting correct values | L4 |
2.2.2 | From Vanrhynsdorp move south on the N7 √ | 3 A giving clear directions to Ceres (3) | L2 |
2.2.3 | 2/5 √√ | 1 A numerator | L2 |
2.2.4 | Distance = 495 km √ | 1 A correct distance | L4 |
QUESTION 3[26] | |||
Ques. | Solution | Explanation | Level |
3.1.1 | 30 000 litres = 30 000 | 1C Litres to m3 | L3 M |
3.1.2 | 10 000 litres = 40g | 1MA Calculating grams per day 1CA Grams | L4 |
3.1.3 | Diameter of fence = 4,8 m + 2 m + 2 m | 1A Diameter of fence | L3 M&F |
3.2.1 | 10,4 inches √√RT | 1RT value of length (2) | L1 M |
3.2.2 | Area of A = length × width | 1RT reading the correct values 1C conversion | L2 M |
3.2.3 | Perimeter = Length + width | 1 SF substitution | L2 M |
QUESTION 4 [24] | |||
Ques. | Solution | Explanation | Level |
4.1.1 | 24 √√RT | 2RT (2) | L1 M&P |
4.1.2 | P (No of 11B/Total =) ? √RT√ | 1RT numerator | L2 P |
4.1.3 | 2 √√RT | 2RT (2) | L1 M&P |
4.1.4 | 2/48 x 100 √ | 1 A Correct values | L2 M&P |
4.2.1 | Distance = Speed × Time | 1SF Substitution 1M Changing subject of formula | L3 |
4.2.2 | Litres used = 135 √MA | 1M Dividing by 12 | L4 M |
4.2.3 | Distance = 135 x 2 √ | 1 M multiplying by 2 | L2 |
TOTAL: | 100 | ||
Mathematical Literacy Paper 2 Addendum - Grade 12 June 2021 Exemplars
ANNEXURE A
QUESTION 2.1
ANNEXURE B
QUESTIONS 1.1 and 2.2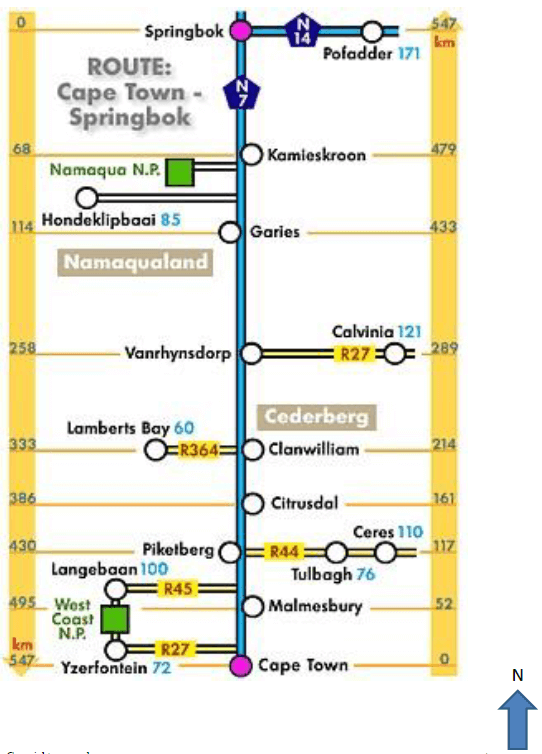
Mathematical Literacy Paper 2 Questions - Grade 12 June 2021 Exemplars
INSTRUCTIONS AND INFORMATION
Read the following instructions carefully before answering the questions.
- This question paper consists of FOUR questions. Answer ALL the questions.
- Use the ADDENDUM with ANNEXURES for the following questions: ANNEXURE A for QUESTION 2.1
ANNEXURE B for QUESTIONS 1.1 and 2.2 - Number the questions correctly according to the numbering system used in this question paper.
- An approved calculator (non-programmable and non-graphical) may be used, unless stated otherwise.
- Show ALL calculations clearly.
- Maps and diagrams are NOT drawn to scale, unless otherwise stated.
- Indicate units of measurement, where applicable.
- Round off ALL final answers appropriately according to the given context, unless stated otherwise.
- Start EACH question on a NEW page.
- Write neatly and legibly.
QUESTIONS
QUESTION 1
1.1 The strip chart in ANNEXURE B shows the distance between Cape Town and Springbok. Answer the questions below based on the map.
1.1.1 What is the distance between Cape Town and Springbok in metres? (2)
1.1.2 Which national roads are shown on this map? (2)
1.1.3 How many regional roads are on this map? (2)
1.2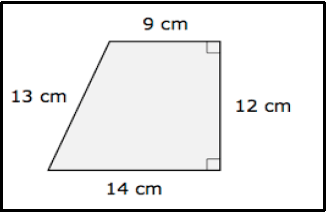
1.2.1 Define the term perimeter. (2)
1.2.2 Calculate the perimeter of the figure in QUESTION 1.2. (2)
1.2.3 Write the shortest side as a ratio of the longest side (2)
1.2.4 What is the difference between the two sides with odd number dimensions? (2)
1.3 Sipho is a regular marathon runner, and he has just finished 42,2 km in 4,7 hours.
1.3.1 What is the marathon distance in cm? (2)
1.3.2 How many minutes did it take him to finish the marathon? (2)
1.3.3 If Sipho’s friend is finished only 0,75 of the total marathon distance, what distance in km was he able to run? (2)
[20]
QUESTION 2
2.1 Mr and Mrs May attended the final match of the 2019 Rugby World Cup in Japan. They were provided with a map as shown in ANNEXURE A. Use the ADDENDUM with the map in ANNEXURE A to answer the questions below.
2.1.1 Give the TWO general directions that they will use if they first travel from Kamaishi Recovery Memorial Stadium to Umakana Yokana Stadium and thereafter to the International Stadium Yokahama. (4)
2.1.2 Calculate the actual distance in kilometres between Umakana Yokana Stadium and Kamaishi Recovery Memorial Stadium. (4)
2.1.3 Write the scale of the map as a unit ratio in the form 1 : … rounded to the nearest million. (3)
2.1.4 Give ONE possible reason why there is no indication of different stadiums in Russia, China, South Korea and North Korea (2)
2.1.5 Which country is north-east of South Korea? (2)
2.2 The map in ANNEXURE B shows the distance between Cape Town and Springbok. Answer the questions, based on the map, below.
2.2.1 On the map, the distance between Clanwilliam and Citrusdal, and that between Piketburg and Malmesbury, seem to be equal. With calculations prove if they are equal. If not, give a reason for this. (5)
2.2.2 Give directions from Vanrhynsdorp to Ceres by mentioning the national roads and regional roads (3)
2.2.3 What is the probability of choosing an even-numbered road from the regional roads? (2)
2.2.4 Sipho travelled from Malmesbury to Springbok. Prove if he was within the accepted speed limit if it took him 4 hours and 30 minutes to reach his destination.
You may use the following formula: Speed = Distance
Time
NOTE: Accepted speed limit is 120 km/hr. (5)
[30]
QUESTION 3
3.1
A family, living in a suburb, has a circular swimming pool with dimensions as shown below. The pool is situated in the middle of the yard and it also has a circular fence around it. The fence is 2 metres from the pool.
Dimensions: Volume of circular pool = π × radius × radius × depth, where π = 3,142 |
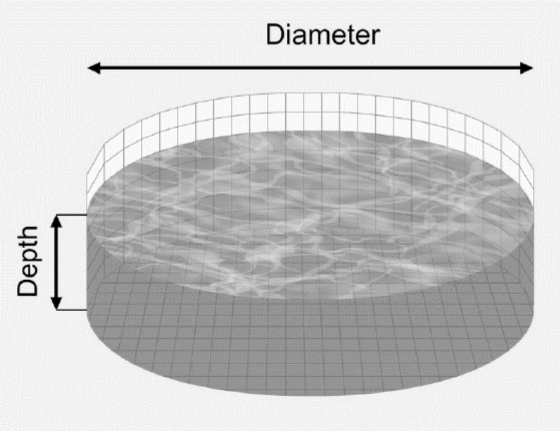
3.1.1 The capacity of the pool is 30 000 litres. Calculate to the nearest metre the depth of the pool. (7)
3.1.2 To clean the pool, they use HTH (a chemical). The chemical is sold in 10 kg bags. They use 40 g of chemical per 10 000 litres water per day. Verify, with the necessary calculations, whether the 10 kg bag will be enough for March. (5)
3.1.3 The labour cost for the fencing, including the gate, is R125 per metre. Calculate the cost for fencing the pool. (4)
3.2 Lwando bought an American flag mounted on a rectangular wooden frame shown in diagrams below.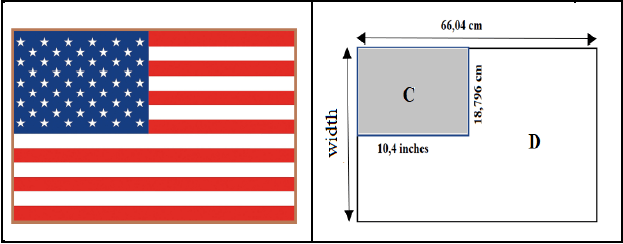
[hertoolbelt.com]
Study the diagrams above and answer the questions below.
3.2.1 Write down the length of section C of the flag. (2)
3.2.2 Calculate the area (in cm2) of section C of the flag. Give your answer to one decimal place.
You may use 1 inch = 2,54 cm (5)
3.2.3 Calculate the width of the front view of the wooden frame if the perimeter of the frame is 201,93 cm.
You may use the following formula:
Perimeter = length + width (3)
2
[26]
QUESTION 4
4.1 Study the seating plan below that will be used for examination purposes at Nhuzayo High School for Grade 9 and 11 learners. Answer the questions that follow.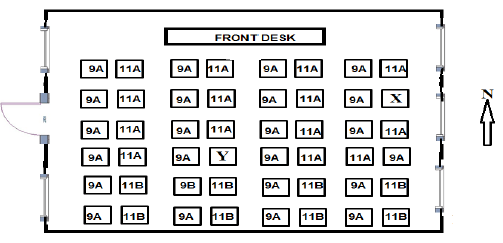
(Desks labelled X and Y were not used.)
4.1.1 Determine the number of Grade 9 learners that will be seated for the examination. (2)
4.1.2 What is the probability of choosing a Grade 11B learner from the total number of learners seated in the examination room? Give your final answer as a simplified fraction. (3)
4.1.3 Determine the number of windows on the west side of the building. (2)
4.1.4 Write the number of the empty desks as a percentage of the total number of desks in the examination room. Give your answer rounded to two decimals. (3)
4.2 A family travelled 135 km from East London to Centane. On their way, they stopped in Butterworth for 25 minutes.
4.2.1 If they travelled at an average speed of 98 km per hour, determine how long in hours and minutes it took them to arrive in Centane. You may use the formula: Distance = Speed × Time (5)
4.2.2 The family travelled in a car with a petrol capacity of 50 litres. The car’s petrol consumption is usually 12 kilometres per litre. The family has claimed that when leaving East London with a full tank of petrol, they would be left with less than 30 litres of petrol in the tank on reaching their destination. Verify, with the necessary calculations, whether their claim is valid or not. (5)
4.2.3 Calculate their petrol cost for a return trip if petrol is 1 650 cents per litre. (4)
[24]
TOTAL: 100
Mathematical Literacy Paper 1 Memorandum - Grade 12 June 2021 Exemplars
Symbol | Explanation |
M | Method |
MA | Method with accuracy |
CA | Consistent accuracy |
A | Accuracy |
C | Conversion |
S | Simplification |
RT/RG/RM | Reading from a table/Reading from a graph/Reading from a map |
F | Choosing the correct formula |
SF | Substitution in a formula |
J | Justification |
P | Penalty, e.g. for no units, incorrect rounding off etc. |
R | Rounding Off/Reason |
AO | Answer only |
NPR | No penalty for rounding |
MARKING GUIDELINE |
NOTE: |
|
MEMORANDUM
QUESTION 1 [20 MARKS] INTEGRATED QUESTION | ||||
Question | Solution | Explanation/Marks AO: FULL MARKS | Topic/L | |
1.1 | 1.1.1 | VAT inclusive price means the price that has added VAT value J | 2A justification (2) | F |
1.1.2 | M M | 1M subtraction for profit | F | |
1.1.3 | Joy’s profit= 2 × 50 × 0,30 RT =R 30,00 üCA | 1 RT correct values | F | |
1.2 | 1.2.1 | Rate = R96,61 C | 1C Conversion | F |
1.2.2 | Total amount = 96,61 × 50 OR Total amount = R 0,9661 × 50 M | 1M multiply by 50 | F | |
1.2.3 | Maximum kWh = 400 - 50 M | 1M subtracting 50 | F | |
1.3 | 1.3.1 | % of energy produced by Others = 100% ─ (85,7+5,2+3,2+1,7+0,9+0,9) üM = 2,4% üCA | 1M subtracting from 100% all values 1CA simplifying. (2) | D |
1.3.2 | M | 1M dividing correct values | D | |
| 1.3 | 1.3.3 | Nuclear: Diesel | 1RT correct values | D |
1.3.4 | Production from coal | 1 RT production | D | |
[21] |
QUESTION 2 [27 MARKS] FINANCE | ||||||
Question | Solution | Explanation/Marks | T/L | |||
2.1 | 2.1.1 | Number of copies 2A | 2A number of copies (2) | F L1 | ||
2.1.2 | ANNEXURE C: GRAPH | |||||
| F L2 | |||||
1 mark for starting point (0;500) | ||||||
2.1.3 | 400 copies RT | 2RT (2) | F | |||
2.1.4 | From graph for 600 copies: OR For S= 600 × 2 = R1 200 M | 1RT for value of S
1M for R1200 | F | |||
2.2 | 2.2.1 | 7 512 788 + 368 182 = 7 880 970 | 1M adding 368182 | F L3 | ||
2.2.2 | Increase= 0,185 × 8 382 673 M =1 550 794,505 S OR Projected income =1,185 × 8 382 673 M | 1M multiplication by 0,185 | F | |||
2.2.3 | A | 1A numerator | F L2 | |||
2.3 | Deposit at ATM = R4,80 + 1,2 × 5000 SF | 1SF substitution | F |
[27] |
QUESTION 3 [15 marks] | |||
Question | Solution | Explanation/Marks AO: FULL MARKS | Topic/L |
3.1 | 43+21+149+72+34+20+32+11+83M | 1M addition | D L1 |
3.2 | 149; 83; 72; 43; 34; 32; 21; 20; 11RT A | 1RT reading all the values | D L1 |
3.3 | 20:40 RT RT | 1RT for 20 | D L2 |
3.4 | 675 - (30 + 175 +19+17+140+182+12+40)M | 1M addition | D L1 |
3.5 | Total schools in NW = 32+182 | 1M addition and total schools in NW | D L3 |
3.6 | Median = 34 RT | 1RT median value | D L2 |
[15] | |||
QUESTION 4 [23 marks] | |||
Ques. | Solution | Explanation | Lev el |
4.1 | Value of A = 222 – 121 MA OR Value of B = 406 – 121 – 103 – 76 – 42 OR Value of C | 1MA Subtract correct values
1M Adding ALL values
1MCA Adding ALL values CA from A and B | D L2 |
4.2 | Trend – From Grade 8 to Grade 12 the number of male learners decreases A OR Male learners fail the grades A | CA from 4.1.1 | L4 D |
4.3 | No of teachers = 772 A | CA from 4.1 | L4 D |
4.4 | Probability (Grade 8 or Grade 9 female) | CA from 4.1 | L2 P |
| 4.5 | No of learners in 2019 = 772 × 1,03 Term 1 = 796 × 3,18 × 51MCA Term 2 = 796 × 3,18 × 46 Total Amount = R129 095,28 + R116 438,88 CA | CA from 4.1.1 1MCA Increasing value from 2.1.1 by 3% 1CA No of learners 1MCA Multiply by 3,18 and 51 1CA Amount for Term 1 1MA Amount by using 46 days 1CA Total amount 1O Statement is valid (7) | F L4 |
| [23] | |||
QUESTION 5 [15 marks] | |||
5.1 | R43 500 ×12 M | 1M multiply by 12 | F L2 |
5.2 | Pension Fund = R43 500 × 7,5% | 1CA pension value | F L3 |
5.3 | A | 1A arrangement | D L2 |
5.4 | Q1= 100 CA | 1CA Q1 | D L2 |
[15] | |||
TOTAL: | 100 | ||