
Adele
COMPUTER APPLICATION TECHNOLOGY PAPER 1 GRADE 12 QUESTIONS - NSC PAST PAPERS AND MEMOS FEBRUARY/MARCH 2017
COMPUTER APPLICATION TECHNOLOGY
PAPER 1
GRADE 12
NSC PAST PAPERS AND MEMOS
FEBRUARY/MARCH 2017
INSTRUCTIONS AND INFORMATION
- Owing to the nature of this practical examination, it is important to note that, even if you complete the examination early, you will NOT be permitted to leave the examination room until all the administrative functions associated with the examination have been finalised. During the examination normal rules regarding leaving the examination room apply.
- Enter your examination number in the header or footer of EVERY document that you create or save, where applicable.
- The invigilator will give you a CD/DVD/flash disk containing all the files needed for the examination OR you will be told where the files can be found on the network or computer. If a CD/DVD has been issued to you, you must write your examination number and centre number on the CD/DVD. If you are working on the network, you must follow the instructions provided by the invigilator/educator.
- A copy of the master files will be available from the invigilator. Should there be any problems with a file, you may request another copy from the invigilator.
- This question paper consists of SEVEN questions.
- Answer ALL the questions.
- Ensure that you save each document using the file name given in the question paper. Save your work at regular intervals as a precaution against possible power failures.
- Read through each question before answering or solving the problem. Do NOT do more than is required by the question.
- At the end of the examination, you must hand in the CD/DVD/flash disk given to you by the invigilator with ALL your answer files saved onto it, OR you should make sure that ALL the answer files are saved on the network/computer as explained to you by the invigilator/educator. Make absolutely sure that all the files can be read. Do NOT save unnecessary files/folders and do NOT hand in duplicate answer files/folders.
- The information sheet that has been provided with the question paper MUST BE COMPLETED AFTER THE THREE-HOUR EXAMINATION SESSION. Hand it to the invigilator at the end of the examination.
- During the examination, you may use the help functions of the programs which you are using. You may NOT use any other resource material.
- Unless instructed otherwise, use formulae and/or functions for ALL calculations in questions involving spreadsheets. Use absolute cell references only where necessary to ensure that formulae are correct when you copy them to other cells in a spreadsheet.
- NOTE: All formulae and/or functions should be inserted in such a manner that the correct results will still be obtained even if the data changes.
- If data is obtained from a previous question that you could not answer, you should still proceed with the questions that follow.
- In all questions involving word processing, you should set the language to English (South Africa). The paper size is assumed to be A4 Portrait, unless stated otherwise.
- Use centimetres as the unit of measurement when answering this question paper.
- Generally, one mark is allocated per action; therefore, a 2-mark question would usually require TWO actions, et cetera.
- The examination folder/CD/DVD/flash disk that you receive with this question paper contains the files listed below. Ensure that you have all the files before you begin with this examination.
|
QUESTIONS
SCENARIO Water is very important for life. We need water to drink, to wash our hands, to cook and to do many other things. |
QUESTION 1: WORD PROCESSING
A document about South Africa's water sources was created.
Open the 1Areas word processing document and insert your examination number in the header or footer.
1.1 Find the text ('The availability of … floods and droughts.') in the Abstract control on the first page and make the following changes:
1.1.1 Set the proofing language of all the text to English (South Africa). (1)
1.1.2 Justify the text. (1)
1.2 Find the image on the first page.
Crop the image to any shape of your choice AND sharpen the image to 50%. (2)
1.3 Find the 'Subtitle' text control on the first page and remove this control WITHOUT deleting the text contained in the control. (1)
1.4 Insert an automatically generated table of contents below the heading 'Contents' on the second page as follows:
- Apply the 'Classic' table of contents format.
- Use the 'Water' style for the first level and the 'Heading 1' style for the second level of headings.
- Set the tab leader for the page numbers to solid.
NOTE: Accept any warning messages that may appear. (4)
1.5 Insert automatic page numbers in the footer of the document as follows:
- Page numbering should start on the 'Contents' page as page 1.
- The page numbering should appear in the format 'Page 1'.
- The page numbers on odd-numbered pages should be left-aligned.
- The page numbers on even-numbered pages should be right-aligned. (5)
1.6 Find the word 'Our' on the 'INTRODUCTION' page.
- Apply a dropped cap effect on the whole word.
- Set the spacing to 0.5 cm from the text. (2)
1.7 Find the text 'table 1' in the fourth paragraph on the page after the map.
Add a cross reference on this text that links to the 'Water Source Area' table on the next page. (2)
1.8 Adjust the 'Water Source Area' table on the next page as follows:
1.8.1 Apply any predefined table style to this table. (1)
1.8.2 Use a table property to ensure that the headings are repeated if the table flows over to the next page. (1)
1.8.3 Find the text 'Grootwinterhoek' and add a footnote to this text as follows:
- The footnote text must contain 'Strategic water sources'.
- Use the '*' as the custom symbol for the footnote. (3)
1.9 Find the image below the heading 'WESTERN CAPE WATER SOURCE AREAS'.
Add 'Image 1' as an automatic caption to the image. (2)
1.10 Find the bulleted list below the 'BOLAND MOUNTAINS' heading.
Change the bullet characters to the '◎' symbol (Wingdings, code 165). (1)
1.11 Find the text 'Did you know?' below the heading 'TSITSIKAMMA'.
- Apply any WordArt of your choice to this text.
- Change the text wrapping to top and bottom. (2)
1.12 Find the chart/graph below the heading 'MPUMALANGA DRAKENSBERG'.
Change the data of the chart/graph as follows:
Cultivated – 2%
Natural – 48%
NOTE: Do not simply change the labels of the chart/graph. (2)
1.13 Find the text '… the journey it has taken to reach us.' below the heading 'PROTECTING SOUTH AFRICA'S WATER SOURCE AREAS'. Create a new source AND insert the citation for this source next to this text. The source must contain the following information:
Type of source: Report
Title: The effects of water
Year: 2015
NOTE: Ensure that the APA style has been selected. (3)
1.14 Find the table of figures on the second-last page. The table of figures only displays the tables. Add an additional automatic table of figures that will also display the images. (2)
1.15 Change the orientation of only the last page to portrait. The rest should remain in landscape. (2)
Save and close the 1Areas document.
[37]
QUESTION 2: WORD PROCESSING
A survey form has been created for distribution.
Open the 2Water word processing document and insert your examination number in the header or footer.
2.1 Add a date field next to the word 'DATE'.
Ensure that it will always display the current date. (2)
2.2 Fill the second text box with the 2Drops image found in the examination folder AND bold the text in the text box. (2)
2.3 Correct the spelling of 'Female' in the drop-down form field control next to the text 'Gender'. (1)
2.4 Add a check box form field control to the left of the text 'Older than 60'. (1)
2.5 Find the text form field control next to the text 'Number of adults in the household'.
Change the properties so that the user can only enter numerical values. (1)
2.6 Edit the format of the control next to 'How much do you pay a month?' so that it will always display an 'R' in front of the amount(s) displayed. (1)
2.7 Apply leader tabs at the bottom of the form so that it displays as below.
![]() (4)
(4)
2.8 You want to send the survey to some people for completion.
Prepare a mail merge as follows:
- Use the Details worksheet of the 2Det_Bes spreadsheet as the data source.
- Sort the surnames in ascending order.
- Add the merge fields, Name and Surname, in the spaces provided at the top of the document.
- Save the 2Water document before completing the merge.
- Complete the mail merge and save the new merged document as 2Done. (5)
Save and close the 2Water document.
[17]
QUESTION 3: SPREADSHEET
Rainfall was measured every month in four cities from 2005 to 2015. The data was captured in a spreadsheet.
NOTE:
- Use formulae and/or functions for ALL calculations in the spreadsheet.
- Use absolute cell references ONLY where it is required by the question to ensure that formulae are correct when you copy it to other cells in the spreadsheet.
- All formulae and/or functions should be inserted in such a manner that the correct results will still be obtained, even if the existing data changes.
Open the 3Rain_Reën spreadsheet. Work in the Rain_Reën worksheet.
3.1 Format the cells in row 1 as follows:
3.1.1 Change the merged cell to only include cells A1:O1. (1)
3.1.2 Apply a 'Thin Diagonal Stripe' pattern style fill effect to the merged cell. (2)
3.2 Freeze the panes so that all the headings in row 2 and the city and year columns display when you scroll down. (2)
3.3 Insert a function in cell D3 to convert the text that appears in cell C3 to a number. (1)
3.4 Insert a function in cell G48 to determine the most commonly occurring rainfall value in April. (2)
3.5 Insert a function in cell H49 to determine the average rainfall for May for all the cities throughout all the years. Display the average rounded to the next highest whole number.
EXAMPLE: If the average is 6.4, then 7 should be displayed. If the average is 6.6, then 7 should also be displayed. (3)
3.6 Insert a function in cell K50 to determine the third highest rainfall in August. (2)
3.7 Insert a function in cell M51 to determine the total rainfall that fell in the four cities during October 2015.
NOTE: Ensure that the correct results will be obtained even if the existing data changes. (4)
3.8 Apply conditional formatting to cells D3:O46 to automatically apply a 3-colour scale to the numbers in the three different categories shown below.
- The lowest point of 0
- A midpoint of 100
- The highest point of 630
Choose any colours of your choice. (5)
3.9 The rainfall in a city is categorised by comparing the total rainfall of the city for a specific year to an expected rainfall of 650.
It is categorised as follows:
- More than the expected rainfall of 650: High
- Less than or equal to the expected rainfall of 650: Low
Insert a function in cell R4 to determine the category for the rainfall in Cape Town in 2015. (6)
3.10 Sort the data in cells A3:O46 according to the year from 2005 to 2015 and then according to the city alphabetically. (2)
Work in the Durban worksheet.
3.11 The cell range used in the function in cell C6 is incorrect.
Correct the cell range of the function by including the data for January from the data table.
Ensure that the function in cell C6 will work correctly if it is copied to the other months in the summary table. (2)
3.12 Filter the data so that only the rainfall data for Durban is displayed. (1)
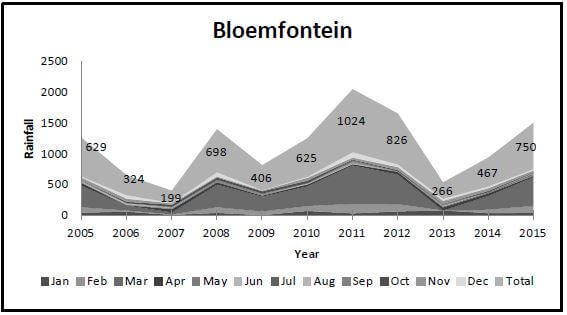
Work in the Bloemfontein worksheet.
3.13 A chart/graph displaying the total rainfall per year for Bloemfontein has been created.
Change the chart/graph in the worksheet to appear as shown below.
- Ensure that the chart/graph displays the rainfall per month and also the total for the year.
- Add a suitable title to the chart/graph.
- Insert a legend as shown in the example below.
- Display the horizontal axis labels.
- Display data labels only for the 'Total' series.

Save and close the 3Rain_Reën spreadsheet. (5)
[38]
QUESTION 4: SPREADSHEET
The school hosted a water games event to raise funds.
NOTE:
- Use formulae and/or functions for ALL calculations in the spreadsheet.
- Use absolute cell references ONLY where it is required by the question to ensure that formulae are correct when you copy it to other cells in the spreadsheet.
- All formulae and/or functions should be inserted in such a manner that the correct results will still be obtained, even if the existing data changes.
Open the 4Game_Speel spreadsheet and work in the Scores_Punte worksheet.
4.1 Remove the hyperlink set on the heading 'Water Games'. (1)
4.2 Insert a formula in cell E3 to determine the number of weeks that have passed between the date in column D and the current date. (3)
4.3 Data validation has been applied to column G.
Remove the value 'Black' as an option in the validation list for the whole column. (2)
4.4 A participant ID should be created for each participant. Create the participant ID in cell I3 as follows:
- The first two letters of the surname in column C
- Followed by a space
- Followed by a random number in the range 0 and 99
- Followed by the gender in column F in lower case
You may use any of the blank columns, such as column K and column L, to calculate any interim results.
EXAMPLE: Ga 23f or Ga 4f (7)
4.5 Use an appropriate LOOKUP function in cell J3 to display the award that Jemima Garrison will receive based on her score in cell H3.
Use the data in the Awards_Toekennings worksheet. (4)
Save and close the 4Game_Speel document.
[17]
QUESTION 5: DATABASE
A database that contains a list of dams and their locations was created. Open the 5Dam database.
5.1 Open the Dam table.
5.1.1 Insert a primary key on the most appropriate field. (1)
5.1.2 Ensure that any data currently stored in the Town field will appear in capital letters. (1)
5.1.3 Add a combo box to the Province field.
The values for the Province field are stored in the Province table.
Accept any warning or error messages that may appear. (2)
5.1.4 Create an input mask for the Completed field to accept dates in the format dd/MMM/yyyy.
EXAMPLE: 01/JAN/2001 or 31/DEC/2010 (5)
5.1.5 Change the field properties of the Capacity field so that no value smaller than zero will be accepted. (1)
5.1.6 Change the data type of the Illustration field so that you can add an image to the field.
Add the 5AlbertFalls image found in the examination folder in the
Illustration field to the Albert Falls Dam record. (2)
Save and close the Dam table.
5.2 Open the qry5_2 query.
- Insert the Town field.
- Add criteria to display the names, provinces and towns of all the dams in Limpopo.
Save and close the qry5_2 query. (2)
5.3 Create a query called qry5_3 based on the Dam table to appear as shown below.
NOTE:
- The Avg Of Capacity field uses the Capacity field.
- Only the data for the Free State and North West must appear.
Province | Avg Of Capacity |
Free State | 826914 |
North West | 109436 |
Save and close the qry5_3 query. (5)
5.4 Open the qry5_4 query.
Display only the names and towns of the dams that have data entered for the surface of the dam and that were completed from 1 January 1990 to 31 December 2000 (inclusive).
Save and close the qry5_4 query. (4)
5.5 Open the qry5_5 query.
- Create and display a calculated field called Volume to calculate the volume of water currently in each dam.
- The calculation for the volume of the dam is Surface*Height*0.3.
- Format this field to display ONE decimal place.
Save and close the qry5_5 query. (4)
5.6 Open the frm5_6 form.
- Add the 5AlbertFalls image found in the examination folder as a background image to the form.
- Insert a hyperlink as follows:
- Place the hyperlink next to the Province label on the form.
- The hyperlink links to the Province table in this database.
HINT: The hyperlink is one of the controls in the Design tab.
- Insert your examination number in the form footer.
Save and close the frm5_6 form. (5)
5.7 Open the rpt5_7 report based on the Dam table.
- Remove the Illustration label AND the field.
- Group the report by the Province field and sort it by the Town field.
- Use a function to determine the largest Capacity of all the dams in the report.
Save and close the rpt5_7 report. (5)
Save and close the 5Dam database.
[37]
QUESTION 6: WEB DESIGN (HTML)
A webpage has been created on how to be water wise.
Open the incomplete 6Wise_Wys web page in a web browser and also in a text/HTML editor (NOT a word processing program such as Word).
NOTE:
- Question numbers are inserted as comments in the coding to show approximately where the answer(s) should be inserted.
- An HTML tag sheet has been attached for reference.
Your final web page should look like the example below.

NOTE: Use the example on the previous page to guide you with this question.
6.1 Add your examination number to display in the browser tab. (1)
6.2 Add an additional cell to the first table and insert the 6Life image found in the examination folder inside this cell. (3)
6.3 Add a horizontal line below the first table with a size/thickness of 5. (2)
6.4 Centre the heading 'Are you water wise?' AND set the font to 'Arial'. (2)
6.5 Find the second table.
Set the border size to 1 and the cell padding to 12. (2)
6.6 Change the first row of the second table to appear as shown below. 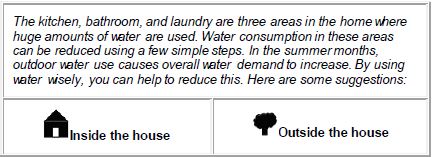 (3)
(3)
6.7 Find the HTML code that displays the image 6House. Change the code so that the word 'Inside' will display if the image cannot be displayed. (1)
6.8 Set the bullet style of the unordered list to a circle AND ensure that all the bullets appear correctly. (2)
6.9 Insert the text 'waterwize.co.za' AND create a link from the text to the e-mail address This email address is being protected from spambots. You need JavaScript enabled to view it.' that already appears in the web page. (3)
Save and close the 6Wise_Wys document.
[19]
QUESTION 7: GENERAL
A spreadsheet was created that contains data on the longest rivers in the world.
7.1 Open the 7Rivers_Riviere spreadsheet.
7.1.1 Add the worksheet name as a field in the left section of the header. (3)
7.1.2 The names of the rivers have been defined as a named range. Change the named range to 'Name_River'. (1)
7.1.3 Protect column A to column C so that users cannot enter text. Add 123 as the password. (2)
Do NOT close the 7Rivers_Riviere spreadsheet.
7.2 Open the 7River_Rivier database and import the data from the 7Rivers_Riviere spreadsheet into a new table into the database.
Use the worksheet name as the table name. (2)
Save and close the 7Rivers_Riviere spreadsheet and 7River_Rivier database.
Open the 7Antw_Answ word processing document and use the 7Water document to enter the answers for the following questions:
7.3
7.3.1 What is the gutter position setting of the document? (1)
7.3.2 How many paragraphs appear in the document? (1)
7.3.3 How many occurrences of the letter 'm' (upper case and lower case) appear in the document? (1)
7.3.4 What is the first word that appears on line 100 in the document? (1)
7.3.5 What is the line weight/width of the 'Intense Quote' style? (1)
7.3.6 Which word is marked as an item to appear in an index? (1)
7.3.7 What is the title of the single-source citation that appears in the document? (1)
Save and close the 7Antw_Answ document. [15] TOTAL: 180
HTML TAG SHEET
Basic Tags | |
Tag | Description |
<body></body> | Defines the body of the web page |
<body | Sets the background colour of the web page |
<body | Sets the colour of the body text |
<head></head> | Contains information about the web page |
<html></html> | Creates an HTML document – starts and ends a web page |
<title></title> | Defines a title for the web page |
<br/> | Inserts a line break |
<!-- --> | Comment |
Text Tags | |
Tag | Description |
<hl></hl> | Creates the largest heading |
<h6></h6> | Creates the smallest heading |
<b></b> | Creates bold text |
<i></i> | Creates italic text |
<font | Sets size of font, from "1" to "7" |
<font color= | Sets font colour |
<font face="Times New Roman"></font> | Sets font type |
Links Tags | |
Tag | Description |
<a href="/URL"></a> | Creates a hyperlink |
<a href="/URL"><img src="name"></a> | Creates an image link |
<a name="NAME"></a> | Creates a target location in the document |
<a href= "#NAME"></a> | Links to a target location created somewhere else in the document |
Formatting Tags | |
Tag | Description |
<p></p> | Creates a new paragraph |
<p align="left"> | Aligns a paragraph to the "left" (default), can also be "right" or "center" |
<br/> | Inserts a line break |
<ol></ol> | Creates a numbered list |
<ol type="A","a", "I","i","1"></ol> | Defines the type of numbering used |
<ul></ul> | Creates a bulleted list |
<ul type="disc", "square","circle"> </ul> | Defines the type of bullets used |
Formatting Tags continued | |
Tag | Description |
<li></li> | Inserted before each list item, and adds a number or symbol depending on the type of list selected |
<img src="/name"> | Adds an image |
<img src="/name" align="left"> | Aligns an image: can be "left", "right", "bottom", "top" |
<p align="center"> <img src="/name"> </p> | Aligns an image in the "center", can also be "middle" |
<img src="/name" border="1"> | Sets the size of the border around an image |
<img src="/name" width="200" height ="200"> | Sets the height and width of an image |
<img src="/name" alt="alternative text"> | Displays alternative text when the mouse hovers over the image or when the image is not found |
<hr/> | Inserts a horizontal line |
<hr size="3"/> | Sets size (height) of a line |
<hr width="80%"/> | Sets the width of a line, in percentage or absolute value |
<hr color= "ff0000"/> | Sets the colour of the line |
Table Tags | |
Tag | Description |
<table></table> | Creates a table |
<tr></tr> | Creates a row in a table |
<td></td> | Creates a cell in a table |
<th></th> | Creates a table header (a cell with bold, centred text) |
<table width="50"> | Sets the width of the table |
<table border="1"> | Sets the width of the border around the table cells |
<table cellspacing="1"> | Sets the space between the table cells |
<table cellpadding="1"> | Sets the space between a cell border and its contents |
<tr align="left"> | Sets the alignment for cell(s) ("left", can also be "center" or "right") |
<tr valign="top"> | Sets the vertical alignment for cell(s) ("top", can also be "middle" or "bottom") |
<td colspan="2"> | Sets the number of columns a cell should span |
<td rowspan="4"> | Sets the number of rows a cell should span |
INPUT MASK CHARACTER SHEET
CHARACTER | DESCRIPTION |
0 | Digit (0 to 9, entry required, plus [+] and minus [–] signs not allowed) |
9 | Digit or space (entry not required, plus [+] and minus [–] signs not allowed) |
# | Digit or space (entry not required; spaces are displayed as blanks while in Edit mode, but blanks are removed when data is saved; plus [+] and minus [–] signs allowed) |
L | Letter (A to Z, entry required) |
? | Letter (A to Z, entry optional) |
A | Letter or digit (entry required) |
a | Letter or digit (entry optional) |
& | Any character or a space (entry required) |
C | Any character or a space (entry optional) |
. , : ; - / | Decimal placeholder and thousand, date and time separators (The actual character used depends on the settings in the Regional Settings Properties dialog box in the Windows Control Panel.) |
< | Causes all characters to be converted to lower case |
> | Causes all characters to be converted to upper case |
! | Causes the input mask to display from right to left, rather than from left to right. Characters typed into the mask always fill it from left to right. You can include the exclamation point anywhere in the input mask. |
\ | Causes the character that follows to be displayed as the literal character (for example, \A is displayed as just A) |
| Examination sticker | 180 MARKS |
COMPUTER APPLICATIONS TECHNOLOGY P1 – FEB.–MAR. 2017
INFORMATION SHEET (to be completed by the candidate AFTER the 3-hour session)
CENTRE NUMBER __________________________________________________________
EXAMINATION NUMBER _____________________________________________________
WORK STATION NUMBER____________________________________________________
SUITE USED | Microsoft Office 2010 | Microsoft Office 2013 | Microsoft Office 2016 | Office 365 |
WEB BROWSER USED | Mozilla Firefox | Google Chrome | Internet Explorer | Other (Specify) |
FOLDER NAME _______________________________________________________________
Candidate to tick if saved and/or attempted.
Question number | File name | Saved (✔) | Attempted (✔) | Maximum Mark | Marker | SM | CM | IM/EM |
1 | 1Areas | 37 | ||||||
2 | 2Water | 17 | ||||||
2Done | ||||||||
3 | 3Rain_Reën | 38 | ||||||
4 | 4Game_Speel | 17 | ||||||
5 | 5Dam | 37 | ||||||
6 | 6Wise_Wys | 19 | ||||||
7 | 7Rivers_Riviere | 15 | ||||||
7River_Rivier | ||||||||
7Answ_Antw | ||||||||
TOTAL | 180 | |||||||
Comment (for office/marker use only)
___________________________________________________________________________________________________________________
___________________________________________________________________________________________________________________
GRADE 12 MATHEMATICS LITERACY PAPER 1 ADDENDUM - NSC PAST PAPERS AND MEMOS FEBRUARY/MARCH 2017
GRADE 12 MATHEMATICS LITERACY
PAPER 1
NSC PAST PAPERS AND MEMOS
FEBRUARY/MARCH 2017
ADDENDUM
ANNEXURE A
QUESTION 1.1
Mr RS Simons 144
Marikana
Bloemhof
BBC Bank
PO Box 62325
Marshall
26 February 2016
BANK STATEMENT for the period 11 February 2016 to 26 February 2016
Current Account, Number 0405209
| Transaction | Service fees | Debits | Credits | Date | Balance |
| Balance brought forward | 4 050,83 - | ||||
| Salary 9123 | 1 285,17 | 11 Feb. | 2 765,66 | ||
| Salary 9038 | 8 906,94 | 11 Feb. | A | ||
| Debit card purchase and cash R1 000,00 at POS | 1 097,96 - | 11 Feb. | 5043,32 | ||
| Debit card purchase and cash fee | 5,00 - | 11 Feb. | 5038,32 | ||
| Credit transfer by ABC Salary 9772 | 23 004,57 | 15 Feb. | 28 042,89 | ||
| Debit card purchase and cash: R3 000,00 at POS | 3982,44 - | 15 Feb. | 24 060,45 | ||
| Debit card purchase Restaurant X | 379,50 - | 15 Feb. | 23 680,95 | ||
| Debit card purchase and cash fee | 5 ,00 - | 15 Feb. | 23 675,95 | ||
| Debit transfer | 13,10 | 479,00 - | 15 Feb. | 23 196,95 | |
| Account payment | 13,10 | 3 188,00 - | 15 Feb. | 20 008,95 | |
| Bank ATM payment to Madika | 5,20 | 1 500,00 - | 16 Feb. | 18 508,95 | |
| ATM transfer to other account at BBC Bank | 3,90 | 5 000,00 - | 16 Feb. | 13 508,95 | |
| Payment from Morwesi | 300,00 | 26 Feb. | 13 808,95 |
NOTE: Service fees are deducted at the end of the month.
TABLE 1: 2016 pricing guide for BBC Bank
| CASH WITHDRAWALS | |
| Fee applicable | |
| At bank ATM | R4,00 + 1,20% of value |
| At POS | R5,00 |
| At another bank's ATM | R6,70 + R4,00 + 1,20% of the withdrawal amount |
| PAYMENTS/DEPOSITS/TRANSFERS | |
| Fee applicable | |
| At bank ATM | R1,10 |
| At other bank's ATM | R6,70 + R1,10 |
| Electronic inter-account transfers | R3,90 |
| Electronic account payments | R5,20 |
| Debit card purchase and cash fee | R5,00 |
Debit order
|
R4,20 |
POS = Point of sale
ATM = Automated teller machine or a cash machine
ANNEXURE B
QUESTION 2.1
ATHLETICS FIELD EVENTS PROGRAMME
| Starting Time | EVENT | MASS OF THE SPORTS EQUIPMENT | |
| 1 | 14:00 | G15 High jump | |
| 2 | 14:00 | G19 Long jump | |
| 3 | 14:00 | B15 Pole vault | |
| 4 | 14:00 | G17 Pole vault | |
| 5 | 14:00 | G19 Pole vault | |
| 6 | 14:00 | G17 Javelin | 500 g |
| 7 | 14:00 | B19 Discus throw | 1,75 kg |
| 8 | 14:00 | G19 Shot put | 4 kg |
| 9 | 14:00 | B17 Long jump | |
| 10 | 14:50 | G19 High jump | |
| 11 | 14:50 | B17 Javelin | 700 g |
| 12 | 14:50 | G17 Discus throw | 1 kg |
| 13 | 14:50 | B15 Shot put 14 | 4 kg |
| 14 | 14:50 | G17 Triple jump | |
| 15 | 14:50 | G19 Triple jump | |
| 16 | 15:05 | B15 Long jump | |
| 17 | 16:05 | G17 High jump | |
| 18 | 16:05 | G15 Long jump | |
| 19 | 16:05 | B15 Javelin | 600 g |
| 20 | 16:05 | G19 Discus throw | 1 kg |
| 21 | 16:05 | B19 Shot put | 6 kg |
| 22 | 16:05 | B19 Pole vault | |
| 23 | 17:00 | B17 High jump | |
| 24 | 17:00 | B19 Long jump | |
| 25 | 17:00 | B19 Javelin | 800 g |
| 26 | 17:05 | B17 Shot put | 5 kg |
| 27 | 17:05 | G17 Long jump | |
| 28 | 17:05 | G15 Discus throw | 1 kg |
| 29 | 18:15 | B17 Triple jump | |
| 30 | 18:15 | B19 Triple jump | |
| 31 | 18:15 | B17 Pole vault | |
| 32 | 18:15 | B15 Discus throw | 1 kg |
| 33 | 18:15 | G19 Javelin | 600 g |
| 34 | 18:15 | G15 Shot put | 3 kg |
| 35 | 18:15 | B19 High jump |
NOTE:
G15 represents girls who are 14 or 15 years old.
G17 represents girls who are 16 or 17 years old.
G19 represents girls who are 18 or 19 years old.
B15 represents boys who are 14 or 15 years old.
B17 represents boys who are 16 or 17 years old.
B19 represents boys who are 18 or 19 years old.
ANNEXURE C
QUESTION 3.1 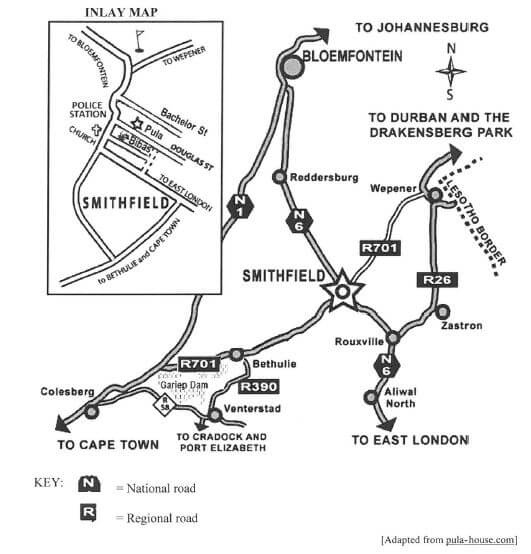
ANNEXURED
QUESTION 3.2
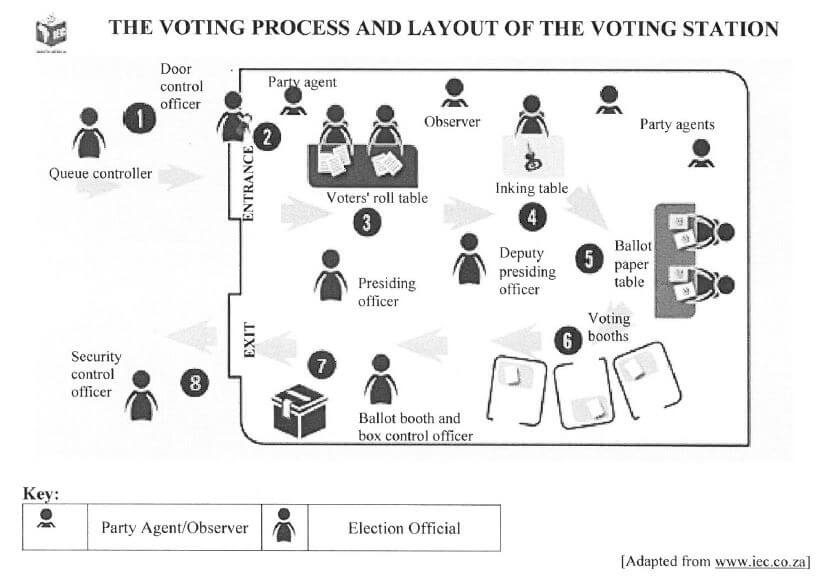
KEY TO THE PROCESS
- In the queue:
An election official will check ID to verify registration. - At the door:
An election officer will scan ID using a zip-zip machine (eZiskan) and will issue a machine slip. - At the voters' roll table:
Machine slip to be given to the voters' roll officer. - At the inking table:
An election officer will make a small ink mark on your left thumb nail. - At the ballot paper table:
Ballot papers will be issued. - At the voting booth:
Actual voting takes place secretly. - At the ballot box:
Place ballot paper into the box. - Exit voting station
ANNEXURE E
QUESTION 5.1
| TABLE 7: COMPARISON OF PRICES OF 15 SELECTED PRODUCTS BOUGHT AT FOUR SUPERMARKETS PRODUCT | ||||
| PRODUCT | NAME OF THE SUPERMARKETS | |||
| Woolworths | Pick n Pay | Spar | Checkers | |
| Apples 1,5 kg, bag | R14,99 | R16,50 | R19,99 | R16,99 |
| Bread, brown loaf | R11,95 | R6,50 | R7,99 | R8,99 |
| Cabbage, one head | R12,99 | R10,99 | R14,99 | R10.99 |
| Cheese per kg | R97,95 | R123,33 | R89,99 | R94,90 |
| Chicken per kg | R49,99 | R36,00 | R46,99 | R39,99 |
| Coca Cola per 2 L | R15,95 | R13,50 | R15,99 | R12,99 |
| Eggs, 6 extra large | R20,99 | R12,95 | R9,99 | R16,99 |
| Flour 2,5 kg, self-raising | R34,90 | R32,99 | R31,99 | R29,99 |
| Maize 2,5 kg, bag | R18,95 | R17,49 | X | R15,99 |
| Margarine 500 g | R23,99 | R17,95 | R19,99 | R15,49 |
| Milk per 2 l, full cream | R27,95 | R22,79 | R25,99 | R22,79 |
| Mince per kg | R79,99 | R84,99 | R76,99 | R62,99 |
| Rice 2 kg | R22,95 | R18,29 | R19,99 | R19,99 |
| Sugar 2,5 kg, white | R29,95 | R23,90 | R23,99 | R27,99 |
| Tea, 100 teabags | R15,95 | R14,89 | R17,99 | R18,99 |
| TOTAL | R479,44 | R453,06 | R440,85 | R416,06 |
[Source: www.businesstech.co.za]
QUESTION 5.2 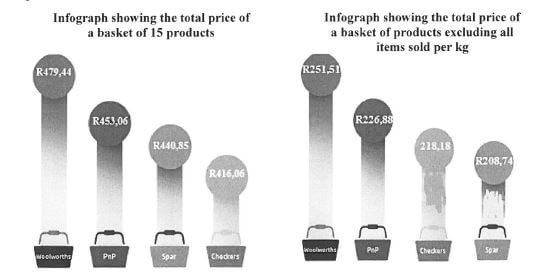
GRADE 12 MATHEMATICS LITERACY PAPER 2 MEMORANDUM - NSC PAST PAPERS AND MEMOS FEBRUARY/MARCH 2017
GRADE 12 MATHEMATICS LITERACY
PAPER 2
NSC PAST PAPERS AND MEMOS
FEBRUARY/MARCH 2017
Symbol | Explanation |
M | Method |
M/A | Method with accuracy |
CA | Consistent accuracy |
A | Accuracy |
C | Conversion |
S | Simplification |
RT/RG/RD | Reading from table/graph/diagram |
SF | Correct substitution in formula |
O | Opinion/Example |
P | Penalty, e.g. for no units, incorrect rounding off, etc. |
R | Rounding off |
AO | Answer only full marks |
NPR | No penalty for rounding |
J | Justification |
MEMORANDUM
QUESTION 1 [31 marks] | |||
Ques | Solution | Explanation | Level |
1.1.1 | World population = 65,3 million × 113 ✔M | 1M multiplying | L2 D |
1.1.2 | ✔M = 5,796 million OR 5 796 000 ✔CA OR Total displaced people = (65,3 + 21,3 + 10) million | 1M adding to get 94% OR 1A total | L3 D |
1.1.3 | Number of persons from the three countries given OR Number of refugees from the three countries | 1A total persons OR 1RT total refugees | L4 D |
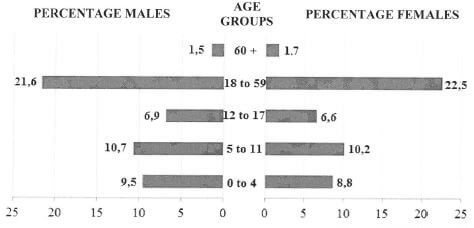
| 1.2.1 | ✔RT ✔M % females below 18 yrs = 8,8% + 10,2% + 6,6% = 25,6% ✔CA | 1RT correct three values 1M adding 1CA simplification AO (3) | L2 P |
| 1.2.2 | This age group covers the largest range of ages. ✔✔O OR This age group is a workforce. They might not have work in their own country. ✔✔O OR They are physically fit and able to migrate. ✔✔O OR Adults fleeing to protect their children/ poltical climate of country. ✔✔O OR Any other valid reason | 2O explanation (2) | L4 D |
| 1.3.1 | May ✔✔O | 2A correct month (2) | L2 D |
| 1.3.2 | Mean = 5580 + 7373 +10 280 + 29810 + 40340 + 43460 ✔M 6 = 136 843 ✔A 6 = 22 807,16667 ✔CA ≈ 22 807 | 1M calculating mean (3) | L2 D |
| 1.3.3 | ✔O ✔O OR ✔O ✔O OR ✔O ✔O OR ✔O ✔O ✔O OR ✔O ✔O OR ✔O ✔O | 1O both years OR 1O for year OR 1O both years OR 1O both years OR 1O both years OR 1O both years | L4 D |
| 1.4 | Budget amount for 2016 OR Increase from 2015 | 1M increase % OR 1M calculating % | L3 F |
| [31] | |||
QUESTION 2 [40 marks] | |||
Ques | Solution | Explanation | Level |
2.1.1 | Density = 39 000 ✔SF | 1SF substitution of correct values | L2 M&P |
2.1.2 | P = 11393 ✔RT | 1RT reading values | L2 P |
2.1.3 (a) | ✔RT ✔M | 1RT values | |
2.1.3 (b) | There are provisions made for disabled spectators who don't require seats. ✔✔O OR Some people can be standing . ✔✔O OR Staff , line judges, officials, coaches, media personnel. ✔✔O | 2O reason (2) | L4 M&P |
2.1.4 (a) | ✔RT | 1RT value | |
2.1.4 (b) | Measured width of screen 6 mm | 1A scale | L3 M&P |
2.2.1 | 12 ✔✔A | 2A correct number (2) | L2 M&P |
2.2.2 | F ✔✔A | 2A correct number (2) | L2 M&P |
Ques | Solution | Explanation | Level |
2.2.3 | Area of the court = 41 m × 22 m Fescue seed = 3/10 × 220,99 kg ✔M OR Area of the court = 41 m × 22 m Fescue seed = 270,6 m2 × 245 g/m2 ✔M OR Area =902 m2 ✔A | 1A area 1A area OR 1A area | L4 M |
Ques | Solution | Explanation | Level |
2.3.1 | ✔RT | 1RT reading values from graph | L3 F |
2.3.2 | ✔M | 1M multiplying | L2 F |
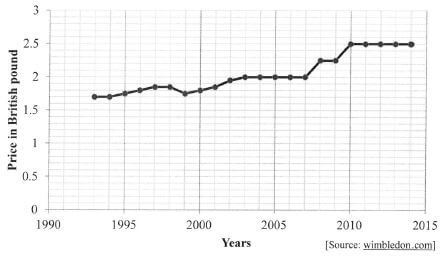
2.3.3 | The average inflation rate remained unchanged / constant ✔✔A OR The annual inflation rate change for the UK would have been 0% ✔✔A | 2A comment | L4 F |
[40] |
QUESTION 3 [36 marks] | ||||
Ques | Solution | Explanation | Level | |
3.1.1 | ✔RT | 1RT reading values from table | M L2 | |
3.1.2 | ✔M | 1M concept of range | D L2 | |
3.1.3 |
| D L2 | ||
3.1.4 | Inner band ✔✔A OR ✔A ✔A OR ✔A ✔A | 2A band OR 1A interpreting the starting point of the percentile band 1A end point of percentile band | D L4 | |
Ques | Solution | Explanation | |
3.1.5 | ºF = (ºC × 9/5) + 32 | 1SF substituting values | M L3 |
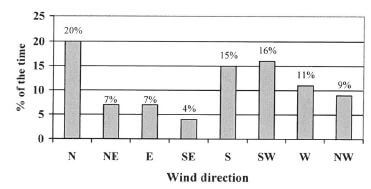
3.2.1 | North ✔✔RT | 2RT modal wind direction. (2) | D L3 |
3.2.2 | P(westerly) = 16% + 11% + 9% ✔RT | 1RT reading all W values | P L2 |
3.2.3 | ✔✔O OR Too many sectors needed ✔✔O | 2O explanation (2) | D L4 |
Ques | Solution | Explanation | T&L |
3.3.1 | Accommodation per person = R850 ✔A OR R9 173,05 = Kz 100 000 Cost per person = 9 266,27 ✔A | 1A divide by 3 OR 1M divide by 9 173,05 (5) | F L3 |
3.3.2 | $1 = Kz 169,27344 | 1M multiplying | F L4 |
[36] |
QUESTION 4 [43 marks] | |||
Ques | Solution | Explanation | Levels |
4.1.1 | ✔SF OR Volume (in mm3) = 430 × 305 × 145 ✔SF | 1SF substitution mm/cm OR 1SF substitution in volume formula | L2 M |
4.1.2 | Volumetric mass = volume of the parcel in cm3 OR Volumetric mass (using 5000) = 20 cm × 25 cm ×15 cm ✔SF Volumetric mass (using 4000) = 20 cm × 25 cm ×15 cm ✔SF | 1SF substitution OR 1SF substitution | L3 M |
Ques | Solution | Explanation | Level |
4.1.3 | Surface area of a rectangular-based box OR Surface area of a square based box | 1SF substitute into formula | L4 M |
4.2.1 | These places are far from Mbombela. ✔✔O OR There might not be many parcels to deliver to those places. ✔✔O OR From Mbombela parcels might go to a central depot to be delivered from there. ✔✔O | 2O reason (2) | L4 M&P |
Ques | Solution | Explanation | Level |
4.2.2 (a) | Package to Graskop: Less than 30 kg @ R70,00 ✔A OR Prices with VAT To Graskop cost = R79,80 ✔A | 1A Graskop R70 OR 1M adding VAT to costs | L3 F |
Ques | Solution | Explanation | Level |
4.2.2 (b) | 30 April from 14:50 to 24:00 is 9 hours 10 min ✔A OR 30 April from 14:50 | 1A time 30 April OR 1A 1st day | L4 M |
4.2.3 (a) | Box size A: | 1M dividing | L3 F |
Ques | Solution | Explanation | Level |
4.2.3 (b) | Box size B: Number of boxes needed = 1300 = 43,33 | 1MA dividing | L4 F |
[43] | |||
TOTAL | 150 |
GRADE 12 MATHEMATICS LITERACY PAPER 1 MEMORANDUM - NSC PAST PAPERS AND MEMOS FEBRUARY/MARCH 2017
GRADE 12 MATHEMATICS LITERACY
PAPER 1
NSC PAST PAPERS AND MEMOS
FEBRUARY/MARCH 2017
Symbol | Explanation |
M | Method |
M/A | Method with accuracy |
CA | Consistent accuracy |
A | Accuracy |
C | Conversion |
S | Simplification |
RT/RG/RD | Reading from table/graph/diagram |
SF | Correct substitution in formula |
O | Opinion/Example |
P | Penalty, e.g. for no units, incorrect rounding off, etc. |
R | Rounding off |
AO | Answer only full marks |
NPR | No penalty for rounding |
MEMORANDUM
QUESTION 1 [35 marks] | |||
Ques | Solution | Explanation | Topic/L |
1.1.1 | ✔✔A | 2A Definition (2) | F |
1.1.2 | ✔✔O | 2O Interpretation (2) | F L1 |
1.1.3 | ✔A ✔M | 1M adding | F L2 |
1.1.4 | Total salary deposits | 1MA adding all the amounts (1 value omitted/added max 1) (2) | F L1 |
1.1.5 | 11 February was a Thursday ✔M | 1M identifying day of week | M L1 |
| 1.1.6 | Cash withdrawal fee ✔MA = R6,70 + R4,00 + 1,20% × R5 490,00 = R6,70 + R4,00 + R65,88 ✔S = R76, 58 ✔CA | 1MA adding/multiplication 1S simplification 1CA amount AO (Max 2 marks if R6,70 is omitted) (Max 1 mark if both R6,70 and R4,00 omitted) (3) | F L2 |
| 1.1.7 | External ✔✔A | 2A correct statement (2) | F L1 |
| 1.2.1 | Final amount of money in the account after a year OR Amount of interest earned after a year | 1RT reading from table OR 1RT reading from table | F L2 |
| 1.2.2 | Interest for six months OR Interest for six months | 1RT reading correct value (7,4%)from table OR 1RT reading correct value(7,4%) from table | F L2 |
| 1.3.1 | ✔O ✔O OR ✔O ✔O | 1O increase 1O price of goods or services (2) | F L1 |
| 1.3.2 | ✔ A ✔ A OR ✔ A ✔ A | 1A numerator 1A denominator 1A hours 1A rate (2) | F L1 |
| 1.3.3 | Minimum monthly rate (B) = r × w OR ✔MA ✔MA | 1SF substitution correct value OR 1MA divide by 10,59 | F L2 |
1.3.4 (a) | ✔ MA Total minimum wage = 40 hours × R11,44 per hour = R457,60 ✔ CA | 1MA multiplying 1CA simplification AO (2) | F L1 |
1.3.4 (b) | Actual hourly rate for one domestic worker = R550,90 ✔ M 40 hour = R13,7725 per hour ✔ CA = R13,77 per hour ✔ CA | 1M dividing by weekly hours 1CA hourly rate AO NPR (2) | F L2 |
| [35] | |||
| QUESTION 2 [28 marks] | |||
| 2.1.1 | End time = 18:15 + 25 min OR Time set aside for start of last items | 1MA calculating end time 1A using time on table 1M subtracting 1CA total time 1A using time on table 1MA calculating time 1M adding 1CA total time AO (4) [omitting time (25 min) max 3 marks] | M L2 |
| 2.1.2 | ✔ MA Difference in mass = 800 g – 600 g = 200 g✔ CA | 1MA subtracting correct mass (reversing values-no penalty) 1CA mass (Identifying correct weights only max 1 mark) AO (2) | M L1 |
| 2.1.3 | 17 years ✔A 17:05✔✔RT/CA | 1A correct age 2RT /CA reading from table (3) 18 years 16:05 (Max 2 marks for 16:05) | M L2 |
| 2.2.1 | Obese ✔✔RT | 2RT weight status (2) | M L1 |
| 2.2.2 | Height in inches = 6 × 12 + 3 = 75 ✔ M BMI = 200 ✔ SF × 703 ✔ C 75 × 75 = 24,99556 ✔ CA = 25✔ R | 1M multiplying/adding 1C conversion 1SF substitution 1CA simplification 1R rounding AO (5) | M L2 |
| 2.3.1 | Total length of podium = 50 cm + 50 cm + 50 cm ✔M = 150 cm ÷ 100 = 1,5 m✔C | 1M adding 1C converting to m AO (2) | M L2 |
| 2.3.2 | ✔A OR ✔A OR Number of parts = 5 + 4 + 3 = 12 | 1A correct values OR 1A correct values | M L2 |
| 2.3.3 | Volume = length × breadth × height = 50 cm × 50 cm × 37,5 cm ✔ SF ✔ CA = 93 750 cm3 ✔ A | 1SF substitution 1CA volume 1A unit AO (3) | M L2 |
| 2.3.4 | 500 ml = 500 cm3 ✔C Height = 500cm3 3,142 × (3,77)2cm2 ✔SF = 11,196… cm ✔CA ≈ 11 cm ✔R | 1C conversion 1SF substitution (accept 500 ml) 1CA simplification 1R rounding (Incorrect conversion max 3 marks) AO (4) | M L2 |
| [28] | |||
| QUESTION 3 [ 23 marks] | |||
| 3.1.1 | Bethulie ✔✔A | 2A correct town (2) | MP L1 |
| 3.1.2 | (a) left/east ✔ A (b) Douglas ✔ A (c) right hand side ✔ A | 1A correct direction 1A correct street 1A correct side (3) | MP L1 |
| 3.1.3 | N1 ✔✔A | 2A National road (2) | MP L1 |
| 3.1.4 | ✔ A ✔ A ✔ A OR only R58 ✔✔ ✔A | 3A provincial roads (3) | MP L1 |
| 3.1.5 | ✔ A ✔ A and ✔ A for Smithfield, Bethulie and Venterstad | 1A first town 1A second town 1A last three towns (3) | MP L2 |
| 3.1.6 | Map : Actual ✔ A ✔M 42 mm : 72,9 km 42 mm : 72 900 000 ✔C 10 : 17 357 142,86 ✔C A | 1A measurement [accept 40 to 43 mm] 1M scale concept 1C conversion 1CA simplified scale [Accept 18 225 000 to 16 953 488,37] NPR (Ratio reversed max 3 marks) (4) | MP L3 |
| 3.2.1 | 11 ✔✔RT | 2RT reading from diagram (15 one mark) (2) | MP L1 |
| 3.2.2 | Clockwise ✔✔A | 2A direction (2) | MP L1 |
| 3.2.3 | Voting booths ✔✔A | 2A correct point (2) | M L1 |
| [23] | |||
| QUESTION 4 [39 marks] | |||
| 4.1.1 | E ✔✔A | 2A correct description (2) | D L1 |
| 4.1.2 | B ✔✔A | 2A correct description (2) | D L1 |
| 4.2.1 | ✔A 3 × 100% 10 ✔A = 30% ✔CA | 1A numerator 1A denominator 1CA percentage AO (3) | P L2 |
| 4.2.2 | ✔MA 72; 109; 118; 137; 137; 144; 144; 146;162; 168 Median = 137 +144 ✔M 2 = 140,5✔CA | 1MA arranging (ascending or descending) 1M median concept 1CA median AO (Wrong column used Max 2 marks) (3) | L2 D |
| 4.2.3 | ✔A 39 % and 41%✔A | 1A mode 1 1A mode 2 (Wrong column used Max 1 mark for both modes) (2) | L1 D |
| 4.2.4 | G ✔✔RT | 2RT correct learner (Accept 7th learner) (2) | D L1 |
| 4.2.5 | ✔MA OR ✔MA | 1M mean concept OR 1M mean concept | D L2 |
| 4.2.6 | ✔A OR 137 = 23 = 23 × 100 | 1A numerator OR 1A numerator | D L2 |
| 4.3.1 | B ✔✔A | 2A correct statement (2) | D L1 |
| 4.3.2 | ✔RT Indian/Asian 15 – 19 ✔RT | 1RT race group 1RT age group (2) | D L1 |
| 4.3.3 | ✔MA OR Y = 426 156 + 430 667 + 431 779 + 437 412 + 1 558 886 + 1 150 775 + 365 544 + 31 698 ✔MA | 1MA adding OR 1MA adding | P L1 |
| 4.3.4 | ✔RT = 4,25% ✔CA | 1RT correct values 1M Probability as a % 1CA percentage AO NPR (3) | D L2 |
| 4.3.5 | ✔RT 674 730 : 688 118 ✔A = 337 365 : 344 059✔CA | 1RT correct values 1A ratio concept 1CA simplified ratio in correct order (Correct unit ratio max 2) (3) | D L1 |
| 4.3.6 | ✔RT = 4,545486967..% ✔CA | 1RT correct values 1M multiply by 100% 1CA Percentage AO NPR (3) | D L2 |
| 4.3.7 | 20–39 ✔✔RT | 2RT correct age group (2) | D L1 |
| 4.3.8 | Bar graph OR B ✔✔RT | 2RT correct graph type (2) | D L1 |
| [39] | |||
| QUESTION 5 [25 marks] | |||
| 5.1.1 | Checkers ✔✔A | 2A correct supermarket (2) | F L1 |
| 5.1.2 | ✔MA X = R440,85 – R(19,99 + 7,99 + 14,99 + 89,99 + 46,99 + 15,99 + 9,99 + 31,99 + 19,99 + 25,99 + 76,99 + 19,99 + 23,99 + 17,99) X = R440,85 – R422,86 = R17,99 ✔CA | 1MA adding/subtracting 1CA simplification AO (2) | F L1 |
| 5.1.3 | Difference = R15,99 – R13,50 ✔MA = R2,49 ✔CA | 1MA subtracting correct values 1CA simplification (accept –R2,49) AO (2) | F L1 |
| 5.1.4 | 9✔✔A | [CA from Q 5.1.2] 2A correct number (2) | F L1 |
| 5.1.5 | Cabbage ✔✔A Milk ✔A | 2A first product 1A second product (3) | F L1 |
| 5.1.6 | Eggs ✔✔A | 2A product (2) | F L1 |
| 5.1.7 | Difference in cost OR Woolworths = R49,99 × 2,5 ✔M | 2A correct prices OR 1M multiplying with correct price | F L2 |
| 5.2.1 | Checkers ✔✔A | 2A correct supermarket (2) | F L1 |
| 5.2.2 | Woolworths OR PnP ✔✔A✔✔A | 2A correct supermarket (2) | F |
| 5.2.3 | ✔A OR ✔A | 1A correct values 1M subtraction 1CA simplification 1A correct values 1M subtraction 1CA simplification AO (3) | F |
| [25] | |||
| TOTAL | 150 | ||
GRADE 12 MATHEMATICS LITERACY PAPER 2 QUESTIONS - NSC PAST PAPERS AND MEMOS FEBRUARY/MARCH 2017
GRADE 12 MATHEMATICS LITERACY
PAPER 2
NSC PAST PAPERS AND MEMOS
FEBRUARY/MARCH 2017
INSTRUCTIONS AND INFORMATION
- This question paper consists of FOUR questions. Answer ALL the questions.
-
2.1 Answer QUESTIONS 3.1.3 and 3.1.4 on the attached ANSWER SHEET.
2.2 Write your centre number and examination number in the spaces on the ANSWER SHEET. Hand in the ANSWER SHEET with your ANSWER BOOK.
2.3 Use the ANNEXURES in the ADDENDUM to answer the following questions:
ANNEXURE A for QUESTION 2.1
ANNEXURE B for QUESTION 2.2
ANNEXURE C for QUESTION 4.1
ANNEXURE D for QUESTION 4.2 - Number the answers correctly according to the numbering system used in this question paper.
- Start EACH question on a NEW page.
- You may use an approved calculator (non-programmable and non-graphical), unless stated otherwise.
- Show ALL calculations clearly.
- Round off ALL final answers appropriately according to the given context, unless stated otherwise.
- Indicate units of measurement, where applicable.
- Maps and diagrams are NOT necessarily drawn to scale, unless stated otherwise.
- Write neatly and legibly.
QUESTIONS
QUESTION 1
1.1
The recent worldwide displacement of people hit an all-time high because of increases in wars and persecutions.
The data below, released by the United Nations' refugee agency (UNHCR), shows the numbers and percentages of the three categories of displaced people for 2016. |
Some of the forcibly displaced people and refugees are given temporary residence in various world regions, as shown in the pie chart and maps below. 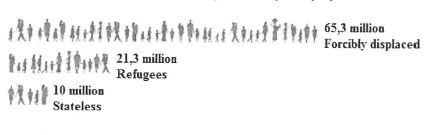 |
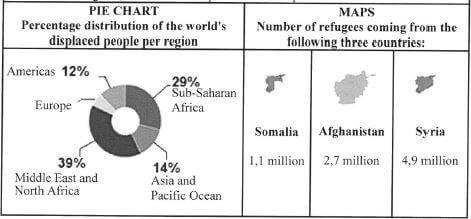 |
[Adapted from UNHCR, 20 June 2016]
Use the information above to answer the questions that follow.
1.1.1 Estimate (to the nearest hundred million) the world population in 2016, given that one in every 113 people is forcibly displaced. (3)
1.1.2 Determine the total number of displaced people that are distributed in Europe.
1.1.3 A spokesperson of the UNHCR stated that 54% of all refugees worldwide come from Somalia, Afghanistan and Syria.
Verify (showing ALL calculations) whether this statement is valid. (5)
1.2
The bar graphs below show the percentages of refugees according to age and gender, entering Europe.
[Source: UNHCR, 20 June 2016] |
Use the bar graphs above to answer the questions that follow.
1.2.1 Determine the probability (as a percentage) of randomly selecting a female refugee younger than 18 years from the refugees who entered Europe. (3)
1.2.2 Give a possible reason why the percentage of refugees in the age group 18 to 59 will always be the largest. (2)
1.3
TABLE 1 below shows the number of refugees entering Europe by sea during the first six months of 2014 and 2015.
Source: UNHCR, 20 June 2016] | ||||||||||||||||||||||||||||
Use the data above to answer the questions that follow.
1.3.1 State which month showed the greatest increase in the number of refugees from 2014 to 2015. (2)
1.3.2 Determine the average monthly number of refugees entering Europe during the first six months of 2015. (3)
1.3.3 Describe a possible trend based on the data in TABLE 1.
1.4 The UNHCR was launched on an annual budget of US$300 000 in 1950. The annual budget reached a new high of US$ 5 300 million in 2013. The budgeted amount for 2016 is expected to be 18,7% higher than the budget for 2013.
Determine the factor value by which the annual budget increased from 1950 to 2016. (5)
[31]
QUESTION 2
2.1
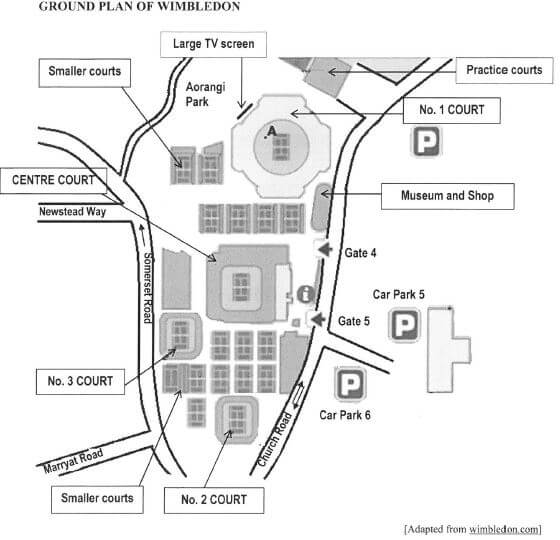
| The Wimbledon tennis championships are held in London annually. Wimbledon has a total of 41 grass courts consisting of 19 match courts and 22 practice courts. TABLE 2 below shows some interesting facts about Wimbledon.
[Source: www.wimbledon.com/en GB/atoz/faq_and facts and figures] A ground plan of Wimbledon is shown in ANNEXURE A. | ||||||||||||||||
Use the information above and the ground plan in ANNEXURE A to answer the questions that follow.
2.1.1 Calculate the maximum density (to the nearest unit) of the spectators at the Wimbledon grounds. (3)
You may use the following formula:
Density of spectators = Number of spectators
Ground size (in acres)
2.1.2 If all the grounds are filled to capacity, determine the probability (rounded off to TWO decimal places) of randomly selecting a spectator from No. 1 Court. (3)
2.1.3 Give a possible reason why the number of seats and the maximum number of spectators at Centre Court are different. (2)
2.1.4 Explain which numbered match court has the highest probability of being affected by traffic noise. (3)
2.1.5 The general direction from the centre of No. 3 Court to a player at position A on No. 1 Court is directly north.
In which general direction is the position of the large TV screen in relation to the player at A? (2)
2.1.6 The height of the large, rectangular TV screen is 5 m.
Determine, showing ALL calculations, the scale of the map in the form 1 : ... (5)
2.2
| The seating plan of No. 3 Court at Wimbledon is shown in ANNEXURE B. The rows are labelled using the letters of the alphabet. |
Use the seating plan to answer the questions that follow.
2.2.1 Determine with which letter the front row on the north side of No. 3 Court should be labelled. (2)
2.2.2 Name the aisles that would be closest to a person seated in the south-westerly corner of the court. (2)
2.2.3 Give ONE valid reason why aisle 10 should have the least spectators using the aisle. (2)
2.2.4 An area of 41 m x 22 m of No. 3 Court is covered with grass. The two types of grass used are in the ratio rye : fescue = 7:3
The groundsman stated that he requires 65 kg fescue seed for No. 3 Court if 245 g of grass seed are sown per square metre.
Verify whether his statement is valid.
You may use the following formula:
Area of a rectangle = length x width
2.3
One of the most popular foodstuffs sold at Wimbledon is strawberries and cream. Selling price of a portion of strawberries and cream from 1993 to 2014 |
Use the graph and information above to answer the questions that follow.
2.3.1 Calculate the average ANNUAL percentage increase of the selling price of strawberries and cream from 1993 to 2014. (5)
You may use the following formula
Percentage increase = Difference in selling price x 100 %
Initial selling price
2.3.2 Determine the total income from the sale of 142 000 portions of strawberries and cream in 2012. (3)
2.3.3 The selling price of strawberries and cream is determined by the annual inflation rate. Comment on the annual inflation rates from 2010 to 2014. (2)
[40]
QUESTION 3
3.1
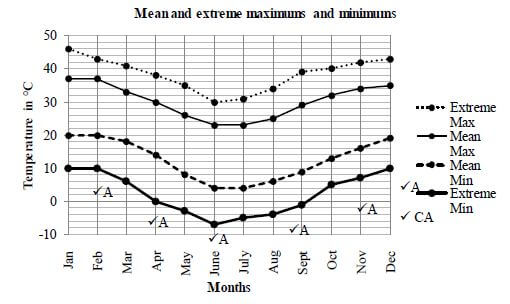
Jumanda decided to investigate the temperature changes in Upington by using the historical data of the recorded temperatures. The historical records of extreme maximum and minimum temperatures as well as mean maximum and minimum temperatures (in degrees Celsius) of Upington are given in TABLE 3 below.
[Source: myweather2.com » Local Weather Forecast > South Africa > Upington] | ||||||||||||||||||||||||||||||||||||||||||||||||||||||||||||||||||||||||||
Use TABLE 3 and the ANSWER SHEET to answer the questions that follow.
3.1.1 Determine the difference between the extreme maximum and extreme minimum temperatures for May. (2)
3.1.2 Determine, showing ALL calculations, in which month the range of the mean temperatures in Upington was the greatest. (3)
3.1.3 The graphs showing the extreme maximum temperatures and mean maximum and minimum temperatures are drawn on the ANSWER SHEET.
Draw another line graph representing the extreme minimum temperatures of Upington on the grid on the ANSWER SHEET.
3.1.4 The line graph showing the average daily maximum temperature with percentile bands is also drawn on the ANSWER SHEET. The inner band is from the 25th to the 75 percentile and the two outer bands are from the 10th to the 25th and the 75th to the 90th percentile.
In which percentile band will the temperature of 36 ºC recorded on 18 February 2016 be classified? (2)
3.1.5 According to Eco Watch the highest temperature for October was recorded on Tuesday 27 October 2015 in Vredendal, when the temperature reached 119,1ºF.
Convert this temperature to ºC (rounded off to ONE decimal place), using the following formula: (4)
ºF = ºC × 9 + 32
5
3.2
Jumanda also studied the wind directions in Upington. The bar graph below shows the annual percentage wind direction occurrences. Annual percentage wind direction occurrences in Upington [Source: weatherspark.com/averages) NOTE: The wind direction is undefined when there is no wind. |
Use the bar graph above to answer the questions that follow.
3.2.1 Determine the modal wind direction. (2)
3.2.2 Determine the probability that on any given day the wind direction will be from any westerly direction. (2)
3.2.3 Explain why a pie chart cannot easily be used to represent this data. (2)
3.3
Jumanda's three friends from Angola will visit him in Upington. They plan to stay at a resort that charges R850 per unit per day for accommodation.
[Source: Coinmill.com, 2 June 2016] |
Use the information above to answer the questions that follow.
3.3.1 Determine (in Kz) the equal amount that EACH of the friends must contribute towards the accommodation per day. (5)
3.3.2 The average monthly disposable salary (AMDS) in Angola is $1 760,41 and in South Africa it is R16 500.
The average monthly rental cost for an apartment in Angola is Kz145 990, whereas a similar apartment in South Africa costs R4 430 per month.
One of the friends stated, 'The average rental cost of an apartment in Angola, expressed as a percentage of the AMDS, is double the percentage of a similar apartment in South Africa.'
Verify, showing ALL calculations, whether this statement is valid. (7)
[36]
QUESTION 4
4.1
Packages are usually delivered by courier services. The courier cost is dependent on the space that a package occupies rather than the mass of the package. This measure is called the volumetric mass and is calculated by using the following formula and TABLE 5 below:
[Source: www.globeflight.co.za/index.php/couriergadgets/ ] You may use the following formulae:
Boxes with the given dimensions are shown in ANNEXURE C. | ||||||||
Use the information above and ANNEXURE C to answer the questions that follow.
4.1.1 Calculate the volumetric mass of a box of size Y if it has to be delivered the next day.
4.1.2 Determine, showing ALL calculations, which mass factor the company used for the box of size X if the volumetric mass of the box is approximately 2 kg. (5)
4.1.3 The company uses boxes of size Z to transport substances with a volumetric mass of 25 kg. These boxes are wrapped using special wrapping paper.
A client commented that the total surface area of the square-based box is less than the total surface area of a rectangular-based box.
Verify whether this comment is valid. (7)
4.2
| A courier company that operates from Mbombela uses maps and pricing schedules, as indicated in ANNEXURE D, to show the cost of their services. |
Use the information in ANNEXURE D to answer the questions that follow.
4.2.1 Give a possible reason why certain places on the map are marked for a 48-hour delivery service. (2)
4.2.2 A shop in Mbombela sends three identical 18 kg parcels to be delivered in Graskop, Klerksdorp and Port Alfred.
NOTE: Port Alfred is in the shaded (grey) area.
- Determine the total delivery cost, including 14% VAT, for the three packages. (10)
- The courier picked up the parcels at 14:50 on 30 April and delivered one parcel in Port Alfred at 08:15 on 2 May.
Verify whether this delivery was done within the specified service delivery time.
4.2.3 A factory in Mbombela needs to send 650 parts with mass of 2 kg each to George.
They can pack the parts in the following two box sizes:
- Box size A (to pack 7 parts)
- Box size B (to pack 15 parts)
- Determine the total delivery cost, excluding VAT, for using only box size A to send all the parts. (4)
- Hence, showing further calculations, advise the management on which ONE of the two options is more economical for the factory. (7)
[43]
TOTAL: 150
ANSWER SHEET
CENTRE NUMBER:
EXAMINATION NUMBER:
QUESTION 3.1.3 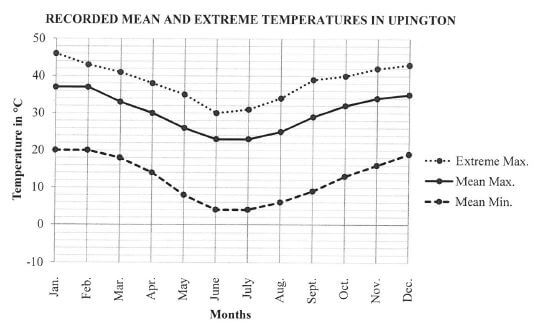
QUESTION 3.1.4 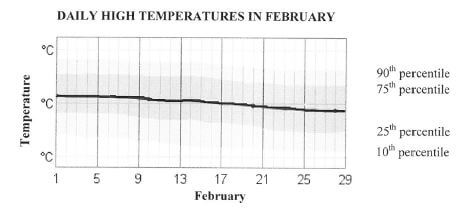
GRADE 12 MATHEMATICS LITERACY PAPER2 ADDENDUM - NSC PAST PAPERS AND MEMOS FEBRUARY/MARCH 2017
GRADE 12 MATHEMATICS LITERACY
PAPER 2
NSC PAST PAPERS AND MEMOS
FEBRUARY/MARCH 2017
ADDENDUM
ANNEXURE A
QUESTION 2.1
ANNEXURE B
QUESTION 2.2
SEATING PLAN OF No. 3 COURT AT WIMBLEDON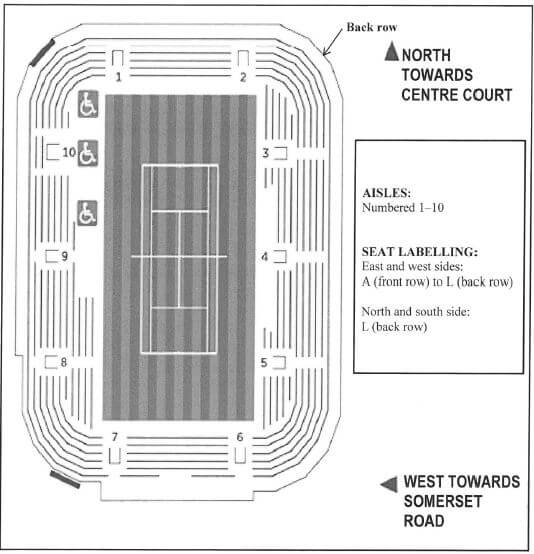
ANNEXURE C
QUESTION 4.1
DIFFERENT BOX SIZES SHOWING SOME DIMENSIONS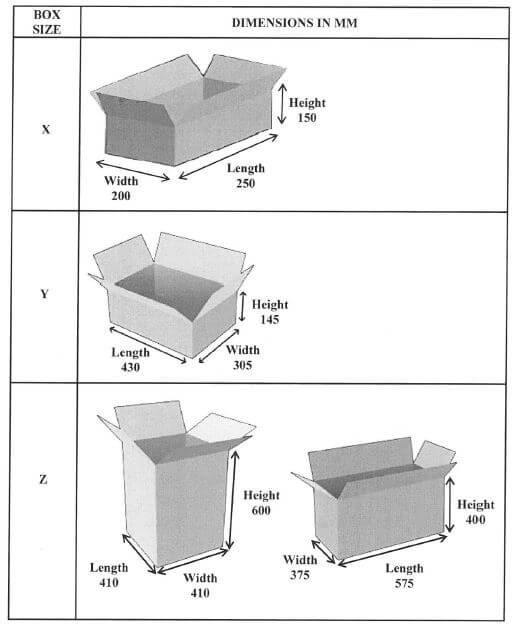
ANNEXURE D
QUESTION 4.2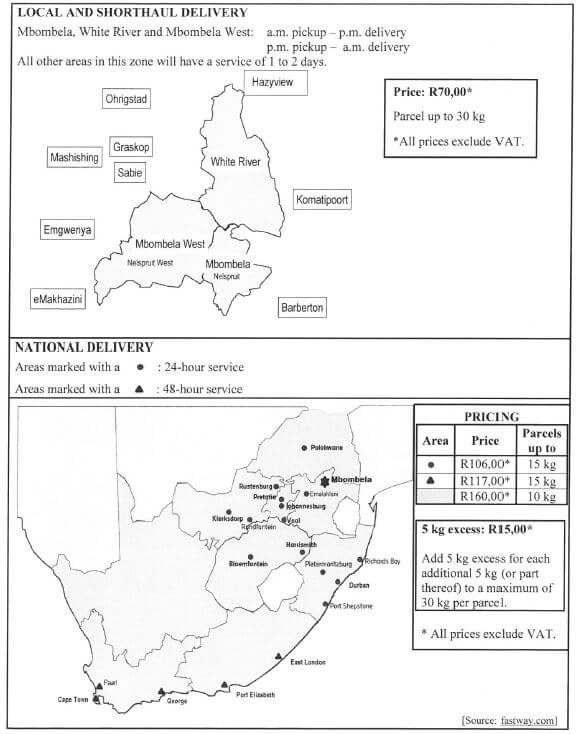
HISTORY PAPER 2 GRADE 12 ADDENDUM - NSC PAST PAPERS AND MEMOS FEBRUARY/MARCH 2017
HISTORY
PAPER 2
GRADE 12
NSC PAST PAPERS AND MEMOS
FEBRUARY/MARCH 2017
ADDENDUM
QUESTION 1: HOW DID THE STUDENTS FROM SOWETO CHALLENGE THE APARTHEID REGIME IN THE 1970s?
SOURCE 1A
The article below was written by Desmond Tutu on 12 June 2016. It focuses on the reasons for the Soweto Uprising that occurred on 16 June 1976.
WE OWE A GREAT DEBT TO THE GENERATION In the 1970s the South African government was busily engaged in its programme to implement grand apartheid. Among its key activities was making life in the cities as nasty and unpleasant as possible for black people, to discourage urbanisation. [From The Sunday Times, 12 June 2016] |
SOURCE 1B
This article focuses on Tsietsi Mashinini's role in mobilising students to march against Afrikaans as a medium of instruction on 16 June 1976.
Tsietsi Mashinini can be described as a master architect; a designer of the cause he believed in and a direct executer of the final outcome, which was ultimately to see the oppressed being freed. [From The Sunday Independent, 12 June 2016] |
SOURCE 1C
This article is an eyewitness account by student leader, Seth Mazibuko. It outlines how the events of 16 June 1976 unfolded.
I turned sixteen on 15 June 1976. The marches were planned at the community centre right across the road from a police station in Orlando East. The next day, 16 June, the first group of marchers, led by Tsietsi Mashinini from Morris Isaacson High, arrived on Vilakazi Street. As they were coming, the police were behind them. The police started throwing teargas canisters. The gods of Africa were with us. You know what happened? The fumes of the teargas were blowing back to them. They were so affected that they then decided to release the dog. [From The Sunday Times, 12 June 2016] |
SOURCE 1D
This photograph was taken by photojournalist Jan Hamman. It is entitled 'UP IN ARMS 1976'. 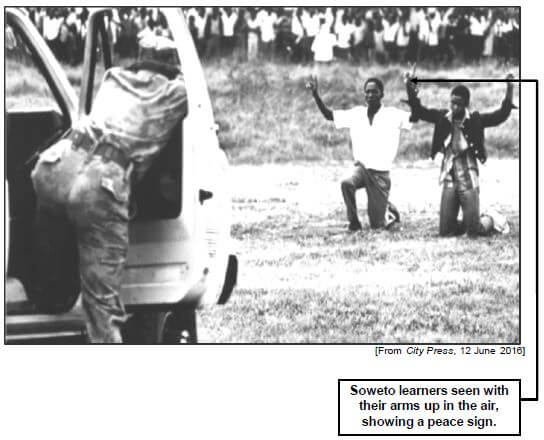
[From City Press, 12 June 2016]
QUESTION 2: WAS THE TRUTH AND RECONCILIATION COMMISSION (TRC) SUCCESSFUL IN RECONCILING SOUTH AFRICA WITH ITS DIVIDED PAST?
SOURCE 2A
The extract below focuses on the reasons for the establishment of the Truth and Reconciliation Commission.
The Truth and Reconciliation Commission (TRC) was established in 1995 to investigate human rights violations since 1960. It was authorised to grant amnesty to those perpetrators who made full disclosure. The commission also had to foster reconciliation and unity among South Africans. The TRC's mandate charged it with the responsibility to be even-handed, but its composition was hardly balanced. The chairman of the TRC was Archbishop Desmond Tutu, who was a patron of the United Democratic Front. [From The South African Truth Commission by K Christie] |
SOURCE 2B
This source outlines how various political parties responded to the TRC hearings.
Despite acknowledging (admitting) the hurt caused by discriminatory (unfair) apartheid policies, the National Party systematically denied or avoided engagement regarding its culpability (blame) for widespread violations, but instead presented itself as the custodian (defender) of law and order, and blamed the liberation movements for embracing violent ideologies. It pointed to the ANC's intolerance of other parties such as the Inkatha Freedom Party (IFP) who chose a different path, and claimed its association (link) to revolutionary (radical) Marxist methodologies and objectives led it to a path of violence. [From http://truth.wwl.wits.ac.za/cat_descr.php?cat=2. |
SOURCE 2C
This cartoon by Zapiro depicts how the National Party (NP) denied knowledge about its involvement in the 'Dirty Tricks' campaign against ANC activists. 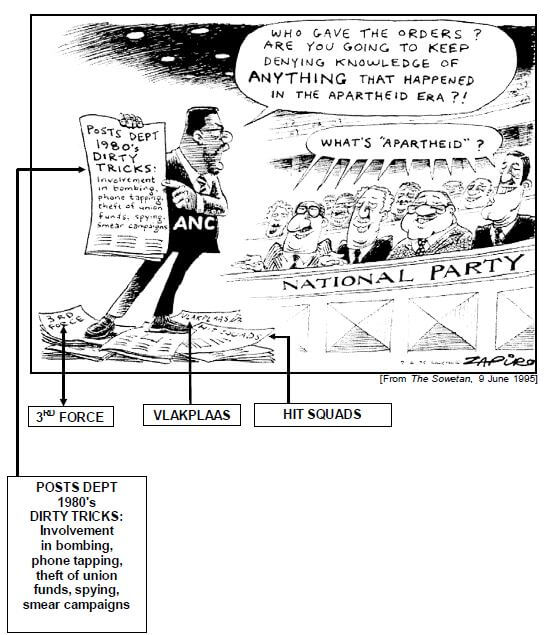
[From The Sowetan, 9 June 1995]
SOURCE 2D
This extract focuses on the findings of the Truth and Reconciliation Commission (TRC).
The TRC held the ANC accountable for various human rights abuses, both before and after 1990, and blamed it for contributing to the spiral of the violence by arming and training self-defence units in a volatile (unstable) situation. It also found that the success of the so-called 'third force' activities was 'at least in part a consequence of the extremely high levels of political intolerance, for which all parties to the conflict are held to be morally and politically accountable'. [From The Rise and Fall of Apartheid by D Welsh] |
QUESTION 3: HOW DID THE IMPLEMENTATION OF STRUCTURAL ADJUSTMENT POLICIES (SAPs) AFFECT THE ECONOMIES OF DEVELOPING COUNTRIES?
SOURCE 3A
This extract by the historian G Arnold explains the reasons African countries accepted structural adjustment policies (SAPs) from the international financial institutions after the 1980s.
… the Group of Seven (the seven most developed countries in the world: the USA, Britain, France, Japan, Italy, Canada and Germany) uses the International Monetary Fund as its instrument to instruct and control the poor countries so that the IMF, which ought to have acted as a guardian of the poor, has instead become a policeman for the interests of the rich. As a result of IMF pressures through the 1980s a number of African countries felt obliged (forced) to put in place IMF-inspired Structural Adjustment Policies (SAPs), whether or not these really suited their circumstances. SAPs were the price to be paid for debt rescheduling and further aid. The lesson was obvious: as long as they remained indebted, small African economies would be subjected to IMF-dictated economic regimes (rules). [From Africa: A Modern History by G Arnold] |
SOURCE 3B
The source below by A Ismi highlights the financial impact that structural adjustment policies had on countries in Africa.
From 1980 to 1993, 70 developing countries subjected to 566 stabilisation and structural adjustment policies with disastrous consequences; the 1980s became known as the 'lost decade'. Between 1984 and 1990 Third World countries under SAPs transferred $178 billion to Western commercial banks. So enormous was the capital drain from the South that Morris Miller, a Canadian former World Bank director remarked: 'Not since the conquistadors (Spanish explorers who conquered parts of America during the 16th century) plundered Latin America has the world experienced such a flow in the direction we see today.' By severely restricting government spending in favour of debt repayment, the loan terms of the Bank and the IMF eviscerated (devastated) the Third World state in its wake spiralling (increasing) poverty and hunger fuelled by slashed food subsidies and decimated (destroyed) health and education sectors. [From http://www.halifaxinitiative.org/updir/ImpoverishingAContinent.pdf. |
SOURCE 3C
This cartoon by Polyp below depicts the impact that structural adjustment policies had on developing countries. (Date unknown) 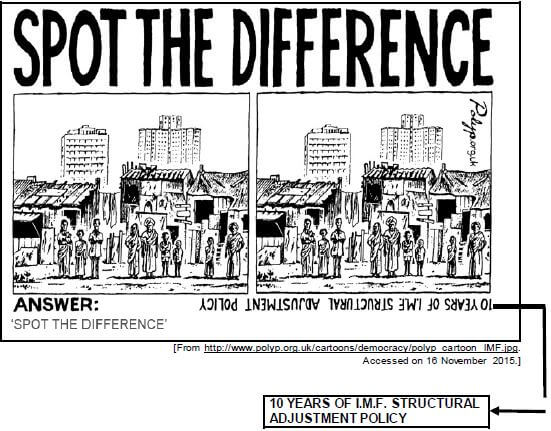
[From http://www.polyp.org.uk/cartoons/democracy/polyp_cartoon_IMF.jpg.
Accessed on 16 November 2015.]
SOURCE 3D
This extract by C Welch focuses on the successes and failures of the structural adjustment policies in developing countries.
Structural adjustment policies often succeed in achieving specific objectives, such as privatising state enterprises, reducing inflation and decreasing budget deficits. However, the gross domestic product (GDP) growth of developing countries undergoing structural adjustment is routinely limited to a few sectors, mostly raw materials extraction or goods produced with cheap labour. Thus, even when an economy driven by structural adjustment policies grows, such growth is generally environmentally unsustainable and fails to generate significant employment or increased incomes, particularly at a rate sufficient to keep up with population growth and compensate for structural adjustment policies induced (caused) layoffs. [From http://fpif.org/structural_adjustment_programs_poverty_reduction_strategy/. |
ACKNOWLEDGEMENTS
Arnold G, 2005. Africa: A Modern History (Atlantic Books, London)
Christie, K. 2000. The South African Truth Commission (Palgrave Publishers, Cape Town)
http://fpif.org/structural_adjustment_programs_poverty_reduction_strategy/.
http://truth.wwl.wits.ac.za/cat_descr.php?cat=2.
http://www.halifaxinitiative.org/updir/ImpoverishingAContinent.pdf.
http://www.polyp.org.uk/cartoons/democracy/polyp_cartoon_IMF.jpg.
Welsh, D. 2009. The Rise and Fall of Apartheid (Jonathan Ball Publishers, Cape Town)
City Press, 12 June 2016
The Sowetan, 9 June 1995
The Sunday Independent, 12 June 2016
The Sunday Times, 12 June 2016
HISTORY PAPER 1 GRADE 12 ADDENDUM - NSC PAST PAPERS AND MEMOS FEBRUARY/MARCH 2017
HISTORY
PAPER 1
GRADE 12
NSC PAST PAPERS AND MEMOS
FEBRUARY/MARCH 2017
ADDENDUM
QUESTION 1: HOW DID THE UNITED STATES OF AMERICA AND THE SOVIET UNION RESPOND TO THE ECONOMIC CRISIS IN EUROPE AFTER 1945?
SOURCE 1A
The extract below focuses on the reasons for the Marshall Plan (USA) and the COMECON (USSR).
The Marshall Plan (or the European Recovery Programme) was a direct consequence of the Containment Policy. It was an economic and social reconstruction (rebuilding) plan for Europe designed to speed up recovery in the countries still suffering the effects of World War II. The plan was named after Secretary of State George Marshall, who presented the theory behind the plan in a commencement address at Harvard in 1947. He (Secretary of State George Marshall) believed that economic stability was key to political stability, and crushing Soviet influence in Europe. [From http://europe.unc.edu/teaching/ces-produced/cold-war-2/. |
SOURCE 1B
This extract focuses on Everett Bellows' view of the Marshall Plan. He was the Assistant Executive Officer who was responsible for the implementation of the Marshall Plan.
It was, of course, the great and original initiative. It was unheard of – as far as I know, and I do read some history – for any victorious nation to go in and rebuild the battlefields, to reconstitute (modify) the economy; it was done with a dual purpose. The immediate beneficiaries (receivers), the Europeans, needed the help. Secondly, from the United States' point of view, it was important that they not collapse and fall within the Soviet Union's sphere of influence. So there was a great deal of political purpose behind it. [From http://adst.org/2015/05/the-marshall-plan-the-europeans-did-the-job-themselves/. |
*Counterpart fund: Refers to the currency that some of the European countries used. It was of lower value to the US dollar, but was used as if it was equal to the US dollar rate.
SOURCE 1C
The source below is an extract from the Soviet Foreign Minister, Andrei Vyshinsky's speech that he presented at the United Nations Assembly on 18 September 1947.
The so-called Marshall Plan is a particularly glaring (obvious) example of the way in which the principles of the United Nations are violated, of the way in which the organisation is ignored. [From http.//www.slantchev.ucsd.edu/courses/nss/documents/vyshinsky-criticism-of-truman doctrine.html. |
SOURCE 1D
This cartoon by Herb Block (an American cartoonist), entitled 'IT'S THE SAME THING WITHOUT MECHANICAL PROBLEMS', was published in the Washington Post on 26 January 1949. It depicts his perspective of the 'Marshal Stalin Plan'. 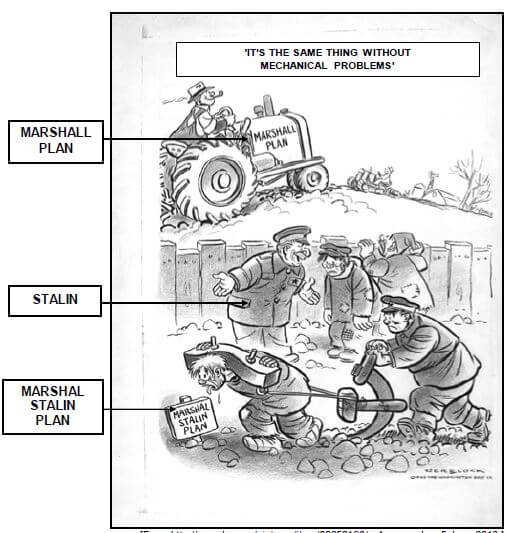
[From http://www.loc.gov/pictures/item/00652193/. Accessed on 5 June 2016.]
QUESTION 2: WHAT WERE THE CAUSES AND CONSEQUENCES OF CUBA'S INVOLVEMENT IN THE BATTLE OF CUITO CUANAVALE BETWEEN 1987 AND 1988?
SOURCE 2A
This extract by historian Edgar Dosmann, focuses on why the Angolan government requested help from Cuba.
South Africa's Operation Modular was unleashed two days later on 14 September (1987); instead of victory, the Angolan army suffered a humiliating (embarrassing) defeat at the Lomba River at the hands of the SADF and its ally UNITA … [From Countdown To Cuito Cuanavale: Cuba's Angolan Campaign by EJ Dosmann] |
SOURCE 2B
This is an extract from a speech by Raúl Castro, Commander in Chief of the Cuban army. It focuses on Cuba's involvement in Operation Carlotta during the Battle of Cuito Cuanavale.
Towards the end of 1987 thousands of South African soldiers were deployed against FAPLA (Angolan army) that was carrying out an important operation in south-eastern Angola. As the unequal battles developed, part of the Angola unit came close to being surrounded and annihilated (destroyed) at Cuito Cuanavale … [From Operation Carlotta is Over! A Victory for Cuban Internationalism by R Castro] |
SOURCE 2C
This photograph shows the statue that was erected to commemorate the fallen heroes at the Battle of Cuito Cuanavale. It shows two soldiers, one Angolan and one Cuban, holding up a map of Angola with a star marking the village of Cuito Cuanavale where the battle was fought between 1987 and 1988. 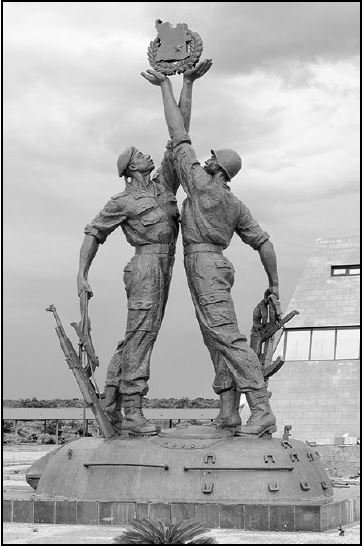
SOURCE 2D [From http://www.bradtguides.com/media/wysiwyg/destinations/africa/angola/cuito_cuanvale_ angola.jpg.
Accessed on 10 June 2016.]
The extract below is part of a speech that was delivered by former South African President, Nelson Mandela, in Cuba on 26 July 1991.
We in Africa are used to being victims of countries wanting to carve up (divide) our territory or subvert (overthrow) our sovereignty. It is unparalleled in African history to have another people rise up in our defence … [From How Far We Slaves Have Come! South Africa and Cuba in Today's World by N Mandela and F Castro] |
QUESTION 3: WHAT IMPACT DID THE CLOSURE OF HIGH SCHOOLS HAVE ON THE COMMUNITY OF LITTLE ROCK, ARKANSAS, IN 1958?
SOURCE 3A
This is an extract from a speech that Governor Orval Faubus delivered in Arkansas on 18 September 1958. It focuses on his decision to close high schools in Little Rock.
I am fully aware of the deep concern of the parents for the continued proper education of their children, and I am fully aware of the inconvenience to the learners in the interruption of the proper educational processes … [From http://www.blackpast.org/1958-governor-orval-e-faubus-speech-school-integration. |
SOURCE 3B
The source below explains how both black (African American) and white American learners were affected by Governor Faubus' decision to close high schools in Little Rock, Arkansas, in 1958.
Perhaps the greatest consequences (results) were the effects on displaced learners and their families … The number of displaced white learners was 2 915. Of those, thirty-five per cent found public schools to attend in the state. Private schools in Little Rock took forty-four per cent of the displaced white learners. A total of ninety-three per cent of white learners found some form of alternative schooling. This was not the case for displaced black learners. Among the 750 black learners who were displaced, thirty-seven per cent found public schools in Arkansas to attend. However, fifty per cent of displaced black learners found no schooling at all. The NAACP (National Association for Advancement of the Coloured People), through Roy Wilkins, stated that opening private high schools for displaced black learners would defeat their intent to gain equal access for all learners to public education. Interviews with many former learners indicate lifelong consequences because of this denial of a free public education. [From http://www.encyclopediaofarkansas.net/encyclopedia/entry -detail.aspx?entryID=737. |
SOURCE 3C
The photograph below shows learners from Little Rock watching a televised lesson. This was after Governor Faubus decided to close schools in 1958. 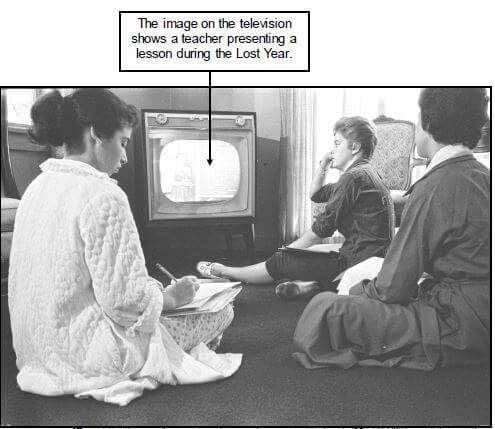
[From http://www.arkansawtraveler.com/wp-content/uploads/2011/11/little-rock-integration.
Accessed on 8 May 2016.]
SOURCE 3D
The source below outlines the role that concerned citizens of Little Rock played in opposing Governor Faubus' decision to close high schools in 1958.
In September 1958 a group of women met to form the Women's Emergency Committee to Open Our Schools (WEC) … they formed the first organisation to publicly condemn the school-closing action and to support reopening the schools under the Little Rock School District's desegregation plan. [From https://www.nps.gov/chsc/planyourvisit/upload/SitebulletinWEC.pdf/. |
ACKNOWLEDGEMENTS
Visual sources and other historical evidence were taken from the following:
Castro, R. 1991. Operation Carlotta is Over! A Victory for Cuban Internationalism (Editora Politica, Havana)
Dosmann, EJ. Countdown to Cuito Cuanavale – Cuba's Angolan Campaign (Oxford, London)
http.//www.slantchev.ucsd.edu/courses/nss/documents/vyshinsky-criticism-of-truman doctrine.html
http://adst.org/2015/05/the-marshall-plan-the-europeans-did-the-job-themselves/
http://europe.unc.edu/teaching/ces-produced/cold-war-2/
http://www.arkansawtraveler.com/wp-content/uploads/2011/11/little-rock-integration
http://www.blackpast.org/1958-governor-orval-e-faubus-speech-school-integration
http://www.bradtguides.com/media/wysiwyg/destinations/africa/angola/cuito_cuanvalea ngola.jpg
http://www.encyclopediaofarkansas.net/encyclopedia/entry-detail.aspx?entryID=737
http://www.loc.gov/pictures/item/00652193/
https://www.nps.gov/chsc/planyourvisit/upload/SitebulletinWEC.pdf/
Mandela, N and Castro, F. 1991. How Far We Slaves Have Come! South Africa and Cuba in Today's World (Pathfinder, Montreal)
HISTORY PAPER 2 GRADE 12 MEMORANDUM - NSC PAST PAPERS AND MEMOS FEBRUARY/MARCH 2017
HISTORY
PAPER 2
GRADE 12
NSC PAST PAPERS AND MEMOS
FEBRUARY/MARCH 2017
1. SOURCE-BASED QUESTIONS
1.1 The following cognitive levels were used to develop source-based questions:
Cognitive Levels | Historical skills | Weighting of questions |
LEVEL 1 |
| 30% (15) |
LEVEL 2 |
| 40% (20) |
LEVEL 3 |
| 30% (15) |
1.2 The information below indicates how source-based questions are assessed:
- In the marking of source-based questions, credit needs to be given to any other valid and relevant viewpoints, arguments, evidence or examples.
- In the allocation of marks, emphasis should be placed on how the requirements of the question have been addressed.
- In the marking guideline, the requirements of the question (skills that need to be addressed) as well as the level of the question are indicated in italics.
1.3 Assessment procedures for source-based questions
- Use a tick (✔) for each correct answer.
- Pay attention to the mark scheme e.g. (2 x 2) which translates to two reasons and is given two marks each (✔✔✔✔); (1 x 2) which translates to one reason and is given two marks (✔✔).
- If a question carries 4 marks then indicate by placing 4 ticks (✔✔✔✔).
Paragraph question
Paragraphs are to be assessed globally (holistically). Both the content and structure of the paragraph must be taken into account when awarding a mark. The following steps must be used when assessing a response to a paragraph question: • Read the paragraph and place a bullet (.) at each point within the text where the candidate has used relevant evidence to address the question.
- Re-read the paragraph to evaluate the extent to which the candidate has been able to use relevant evidence to write a paragraph.
- At the end of the paragraph indicate the ticks (√) that the candidate has been awarded for the paragraph; as well as the level (1,2, or 3) as indicated in the holistic rubric and a brief comment e.g.

Used mostly relevant evidence to write a basic paragraph - Count all the ticks for the source-based question and then write the mark on the bottom margin to the right, e.g. 32/50
- Ensure that the total mark is transferred accurately to the front/back cover of the answer script.

2. ESSAY QUESTIONS
2.1 The essay questions require candidates to:
- Be able to structure their argument in a logical and coherent manner. They need to select, organise and connect the relevant information so that they are able to present a reasonable sequence of facts or an effective argument to answer the question posed. It is essential that an essay has an introduction, a coherent and balanced body of evidence and a conclusion.
2.2 Marking of essay questions
- Markers must be aware that the content of the answer will be guided by the textbooks in use at the particular centre.
- Candidates may have any other relevant introduction and/or conclusion than those included in a specific essay marking guideline for a specific essay. • When assessing open-ended source-based questions, learners should be credited for any other relevant answers.
2.3 Global assessment of the essay
The essay will be assessed holistically (globally). This approach requires the teacher to score the overall product as a whole, without scoring the component parts separately. This approach encourages the learner to offer an individual opinion by using selected factual evidence to support an argument. The learner will not be required to simply regurgitate ' facts' in order to achieve a high mark. This approach discourages learners from preparing ' model' answers and reproducing them without taking into account the specific requirements of the question. Holistic marking of the essay credits learners' opinions supported by evidence. Holistic assessment, unlike content-based marking, does not penalise language inadequacies as the emphasis is on the following:
- The construction of argument
- The appropriate selection of factual evidence to support such argument
- The learner's interpretation of the question.
2.4 Assessment procedures of the essay
2.4.1 Keep the synopsis in mind when assessing the essay.
2.4.2 During the reading of the essay ticks need to be awarded for a relevant introduction (indicated by a bullet in the marking guideline/memorandum), each of the main points/aspects that is properly contextualized (also indicated by bullets in the marking guideline/memorandum) and a relevant conclusion (indicated by a bullet in the marking guideline/memorandum) e.g. in an answer where there are 5 main points there will be 7 ticks.
2.4.3 The following additional symbols can also be used:
- Introduction, main aspects and conclusion not properly contextualised ^
- Wrong statement _________________
- Irrelevant statement |
|
| - Repetition R
- Analysis A√
- Interpretation I√
2.5 The matrix
2.5.1 Use of the matrix in the marking of essays
In the marking of essays, the criteria as provided in the matrix should be used. When assessing the essay note both the content and presentation. At the point of intersection of the content and presentation based on the seven competency levels, a mark should be awarded.
(a) The first reading of the essay will be to determine to what extent the main aspects have been covered and to allocate the content level (on the matrix).
C | LEVEL 4 | |
(b) The second reading of the essay will relate to the level (on the matrix) of presentation.
C | LEVEL 4 | |
P | LEVEL 3 |
(c) Allocate an overall mark with the use of the matrix.
C | LEVEL 4 |
|
P | LEVEL 3 |
GLOBAL ASSESSMENT OF ESSAYS: TOTAL MARKS: 50
PRESENTATION
CONTENT | LEVEL 7
| LEVEL 6
| LEVEL 5
| LEVEL 4
| LEVEL 3
| LEVEL 2
| LEVEL 1*
|
LEVEL 7
| 47–50 | 43–46 | |||||
LEVEL 6
| 43–46 | 40–42 | 38–39 | ||||
LEVEL 5
| 38–39 | 36–37 | 34–35 | 30–33 | 28–29 | ||
LEVEL 4
| 30–33 | 28–29 | 26–27 | ||||
LEVEL 3
| 26–27 | 24–25 | 20–23 | ||||
LEVEL 2
| 20–23 | 18–19 | 14–17 | ||||
LEVEL 1*
| 14–17 | 0–13 |
* Guidelines for allocating a mark for Level 1:
- Question not addressed at all/totally irrelevant content; no attempt to structure the essay = 0
- Question includes basic and generally irrelevant information; no attempt to structure the essay = 1–6
- Question inadequately addressed and vague; little attempt to structure the essay = 7–13
MEMORANDUM
SECTION A: SOURCE-BASED QUESTIONS
QUESTION 1: HOW DID THE STUDENTS FROM SOWETO CHALLENGE THE APARTHEID REGIME IN THE 1970s?
1.1
1.1.1 [Extraction of evidence from Source 1A – L1]
- To make life in the cities as nasty and unpleasant as possible for black people
- To discourage urbanisation (2 x 1) (2)
1.1.2 [Interpretation of evidence from Source 1A – L2]
- They challenged the government's policies
- They opposed the government's policies
- They fought for liberation of all South Africans from apartheid
- Any other relevant response (Any 1 x 2) (2)
1.1.3 [Extraction of evidence from Source 1A – L1]
- Insufficient housing
- Poor sanitation
- Overcrowded schools
- Rigid enforcement of pass laws
- Consequent destruction of family lives
- Constant police harassment at home and on the streets (Any 4 x 1) (4)
1.2
1.2.1 [Extraction of evidence from Source 1B – L1]
- Mashinini wanted to see the oppressed South Africans being freed (1 x 1) (1)
1.2.2 [Extraction of evidence from Source 1B – L1]
- A student of note
- A student who had a passion for reading (2 x 1) (2)
1.2.3 [Explanation of a historical concept from Source 1B – L1]
- A philosophy that was propagated by Steve Biko which advocated self-confidence, assertiveness and pride among black South Africans
- A philosophy propagated by Steve Biko and other activists for black South Africans to be independent/self-reliant of other races regarding the struggle for equality and justice
- Any other relevant response (Any 1 x 2) (2)
1.2.4 [Interpretation of evidence from Source 1B – L2]
- Mashinini became an activist to fight against the injustices of apartheid
- Mashinini at a young age became leader of the Soweto Student Representative Council
- Mashinini was at the forefront of the march on June 16, 1976
- Mashinini as leader propagated peaceful protest
- Mashinini was able to attract 20 000 students to the march
- Any other relevant response (Any 2 x 2) (4)
1.3
1.3.1 [Extraction of evidence from Source 1C – L1]
- Morris Isaacson High School (1 x 1) (1)
1.3.2 [Extraction of evidence from Source 1C – L1]
- The police started throwing teargas canisters
- They released the dog
- The police used life bullets (Any 2 x 1) (2)
1.3.3 [Interpretation of evidence from Source 1C – L2]
- The police were caught in the middle of protesting students and were scared
- The police tried to force their way out and escape from protesting students
- Their dog was beaten to death
- Any other relevant response (Any 1 x 2) (2)
1.3.4 [Interpretation of evidence from Source 1C – L2]
Seth Mazibuko saluted the role of women because:
- They helped disguise student leaders
- They clothed them with their dresses
- Women gave them water after they were teargassed by the police
- Any other relevant response (Any 2 x 2) (4)
1.3.5 [Ascertaining the reliability of Source 1C – L3]
To a great extent
- It is an eye witness account by Mazibuko on how the 16 June 1976 events unfolded
- It appeared in the Sunday Times, 12 June 2016
- It can be collaborated with other sources
- Seth was one of the leaders of the march
- Any other relevant response (Any 2 x 2) (4)
To a lesser extent
- It is an eyewitness-account – is one-sided
- It could be biased
- The incident occurred in 1976 and is being reported in 2016 – there could be a lapse in recollection
- Any other relevant response (Any 2 x 2) (4)
1.4 [Comparison of evidence to determine similarities in Sources 1B and 1C – L3]
- Sources 1B and 1C refer to the youth as leaders who organised the 16 June 1976 march
- Sources 1B and 1C refer to the youth as being at the forefront of the 16 June 1976 march
- Sources 1B and 1C refer to the youth as being responsible because they planned a peaceful march
- Any other relevant response (Any 2 x 2) (4)
1.5
1.5.1 [Interpretation of evidence from Source 1D – L2]
- The photograph conveys the police's action against unarmed children
- The photograph shows unarmed children showing a 'peace sign' and giving up to the police
- It shows the peaceful/non-violent nature of the protestors
- Any other relevant response (Any 2 x 2) (4)
1.5.2 [Interpretation of evidence from Source 1D – L2]
The words are effective because:
- It reflects the initial peaceful intention of the Soweto Uprising
- It shows the students as fearless in their challenge against the apartheid regime
- Any other relevant response (2 x 2) (4)
1.6 [Interpretation, evaluation and synthesis of evidence from relevant sources – L3]
Candidates could include the following aspects in their responses:
- The youth of Soweto resisted the government's plan of grand apartheid (Source 1A)
- The youth of Soweto protested at being taught in Afrikaans (Source 1A)
- On 16 June 1976 the youth confronted apartheid and this was the start of the liberation struggle (Source 1A)
- Appalling conditions in the townships (Source 1A)
- The overall goal of the youth with the Soweto Uprising was to free the oppressed (Source 1B)
- The Soweto Uprising of 16 June 1976, drew more than 20 000 students to protest against apartheid education (Source 1B)
- Constant police harassment (Source 1B)
- The students planned a peaceful protest but the police used violence to suppress them (Source 1C)
- The first casualties of the protest were Hector Peterson and Hasting Ndlovo (Source 1C)
- The Soweto Uprising was a watershed moment in the history of South Africa (own knowledge)
- The Soweto Uprising soon spread to the rest of South Africa (own knowledge)
- Any other relevant response
Use the following rubric to allocate marks:
LEVEL 1 |
| MARKS 0–2 |
LEVEL 2 |
| MARKS 3–5 |
LEVEL 3 |
| MARKS 6–8 |
(8)
[50]
QUESTION 2: WAS THE TRUTH AND RECONCILIATION COMMISSION (TRC) SUCCESSFUL IN RECONCILING SOUTH AFRICA WITH ITS DIVIDED PAST?
2.1
2.1.1 [Extraction of evidence from Source 2A – L1]
- To investigate human rights violations (1 x 1) (1)
2.1.2 [Explanation of a historical concepts from Source 2A – L1]
-
- If perpetrators of gross human rights violation spoke the truth about their involvement in politically motivated killings then a pardon would be granted
- Any other relevant response (1 x 2) (2)
-
- To bring together victims and perpetrators for the political crimes that were committed during the apartheid era
- For the victims and perpetrators to come face to face, apologise and seek forgiveness
- Any other relevant response (Any 1 x 2) (2)
2.1.3 [Interpretation of evidence from Source 2A – L2]
- There was no cross examination of victims
- They did not probe the reasons as to why the perpetrators committed gross human rights violations against political activists
- They did not concentrate on the details as to why these political crimes were committed
- They relied on hearsay
- Any other relevant response (Any 2 x 2) (4)
2.1.4 [Interpretation of evidence from Source 2A – L2]
- Vlakplaas operatives
- They were involved in the murders of the PEBCO Three; the Gugulethu Seven and other killings and atrocities
- They wanted to avoid prosecution and imprisonment
- They asked for amnesty for the murders of Mathew Goniwe and three friends outside Port Elizabeth
- Vlakplaas operatives were defending the apartheid regime
- They were afraid that they might be prosecuted
Any other relevant response (Any 1 x 2) (2)
- ANC operatives
- Were responsible for the Church Street bombings in which 18 people were killed
- Any other relevant response (Any 1 x 2) (2)
2.2
2.2.1 [Extraction of evidence from Source 2B – L1]
- The liberation movements (ANC and PAC) (1 x 1) (1)
2.2.2 [Interpretation of evidence from Source 2B – L2]
- The PAC justified its attacks on white South Africans because they were also targets
- The PAC acknowledged that its members were engaged in criminal activities
- Any other relevant response (2 x 2) (4)
2.2.3 [Extraction of evidence from Source 2B – L1]
- The IFP refused to co-operate (1 x 2) (2)
2.2.4 [Evaluation of usefulness from Source 2B – L3]
The source is USEFUL because:
- It gives insight as to why political parties got involved in political motivated crimes
- It highlights how the NP did not accept blame for the atrocities that they committed
- It shows how the NP blamed the liberation movements for the political violence that was committed and were not prepared to accept any blame
- It reveals how the IFP refused to co-operate with the TRC
- It indicates how the PAC justified their attacks on white South Africans
- The IFP blamed the state and the ANC for the violence that was committed
- Any other relevant response (Any 2 x 2) (4)
2.3
2.3.1 Interpretation of evidence from Sources 2C – L2]
- The NP refused to take responsibility for the crimes listed (speech bubble – WHAT’S “APARTHEID”?).
- The NP viewed the ANC indifferently (smiles on their faces)
- The NP could not recall the crimes that were committed during the apartheid era (speech bubble – WHAT’S “APARTHEID”?)
- The NP was not prepared to reveal those who gave the orders (speech bubble – Who Gave The Orders?)
- The NP denied that apartheid existed which they were responsible for (speech bubble – WHAT’S “APARTHEID”?)
- Any other relevant response (Any 2 x 2) (4)
2.3.2 [Extraction of evidence from Source 2C – L1]
- Bombings
- Phone tapping
- Theft of union funds
- Spying
- Smear campaigns
- Vlakplaas
- Third Force
- Hit squad (Any 4 x 1) (4)
2.4 [Comparison of evidence in Sources 2B and 2C – L3]
- In Source 2B the NP admitted the hurt that it had caused by the policies of apartheid whereas in Source 2C the NP indicated it has no knowledge about apartheid
- In Source 2B the NP was not prepared to take blame for any crimes that were committed during its rule whereas in Source 2C the NP was presented with a list of the crimes they committed
- In Source 2B the NP blamed the ANC for violent ideologies whereas in Source 2C the NP denied responsibility for third force activities, Vlakplaas and hit squads
- Any other relevant response (Any 2 x 2) (4)
2.5
2.5.1 [Extraction of evidence from Source 2D – L1]
- Blamed the ANC for contributing to the spiral of violence (violation to right of life)
- Training self-defence units in a volatile situation (violation of safety, security and life) (2 x 1) (2)
2.5.2 [Interpretation of evidence from Source 2D – L2]
The response must include BOTH the ANC and the IFP:
- The ANC did not want to be blamed for human rights violations/The ANC felt they were not responsible for the conflict but rather blamed the National Party
- The IFP did not want to be blamed for political violence
- Both wanted the final draft to be amended in their favour
- Any other relevant response (2 x 2) (4)
2.6 [Interpretation, evaluation and synthesis of evidence from relevant sources – L3]
Candidates could include the following aspects in their response.
Candidates could take a stand and explain whether the Truth and Reconciliation Commission was successful in reconciling South Africa from its divided past OR candidates could present a mixed response that is SUCCESSFUL and NOT SUCCESSFUL
SUCCESSFUL
- TRC was established to investigate human rights violations and authorised to grant amnesty (Source 2A)
- More than 1000 perpetrators received amnesty (Source 2A)
- The TRC performed a therapeutic role by allowing the perpetrators to tell their stories (Source 2A)
- The TRC was able to reveal the truth by allowing perpetrators to tell their stories (Source 2A)
- Political parties acknowledged the violent crimes that were committed (Source 2B)
- A list of violent crimes that were committed were presented to the NP (Source 2C)
- The ANC was regarded as hypocrites since they too committed similar crimes (own knowledge)
- The TRC held the ANC accountable for human rights abuses before and after 1990 (Source 2D)
- The TRC highlighted third force activities (Source 2D)
- The credibility of the TRC was challenged when the final report was amended to include the IFPs the findings (Source 2D)
- The TRC was therefore viewed as successful as it contributed to nation building and reconciliation (own knowledge)
- Any other relevant response
OR
NOT SUCCESSFUL
- Cross examination of victims was not allowed (Source 2A)
- The political parties were not prepared to take any blame for the violent crimes that were committed (Source 2B)
- The persons who gave the order for the crimes that were committed were still not revealed (Source 2C)
- The TRC was regarded as a 'witch hunt' that opened old wounds (own knowledge)
- Many families were still looking for answers (own knowledge)
- Perpetrators were not held accountable for the crimes that were committed (own knowledge)
- The TRC did not achieve its aims since it was unable to bring about reconciliation (own knowledge)
- Twenty years later the TRC is therefore viewed as unsuccessful in addressing the injustices of the past (own knowledge)
- Any other relevant response
Use the following rubric to allocate marks:
LEVEL 1 |
| MARKS 0–2 |
LEVEL 2 |
| MARKS 3–5 |
LEVEL 3 |
| MARKS 6–8 |
(8)
[50]
QUESTION 3: HOW DID THE IMPLEMENTATION OF STRUCTURAL ADJUSTMENT PROGRAMMES (SAPs) AFFECT THE ECONOMIES OF DEVELOPING COUNTRIES?
3.1
3.1.1 [Extraction of evidence from Source 3A – L1]
- USA
- Britain
- France
- Japan
- Italy
- Canada
- Germany (Any 3 x 1) (3)
3.1.2 [Extraction of evidence from Source 3A – L1]
- Structural adjustment policies consist of loans provided by the International Monetary Fund and World Bank to countries that experience economic crises
- To subject the countries to IMF-dictated economic regimes (Any 1 x 2) (2)
3.1.3 [Extraction of evidence from Source 3A – L1]
- The IMF wanted to keep African countries in debt
- They were now able to reschedule their debt repayments
- To obtain further aid (Any 1 x 2) (2)
3.1.4 [Interpretation of evidence from Source 3A – L2]
- It interfered politically in the internal affairs of African countries
- African governments had no say in the conditions that were laid down by the IMF
- It did not take the political and economic realities of African countries into consideration
- It resulted in economic hardship for ordinary Africans
- They would not get further loans if they are non-compliant
- African countries could only afford to pay the loan and not the interest
- Any other relevant response (Any 2 x 2) (4)
3.2
3.2.1 [Extraction of evidence from Source 3B – L1]
- Between 1980 and 1990 Third World countries transferred $178 billion to Western commercial banks as part of debt repayment
- There was an enormous capital drain from countries situated in the south
- It restricted government spending in favour of debt repayment (Any 1 x 2) (2)
3.2.2 [Interpretation of evidence from Source 3B – L2]
- It destroyed the economies of African countries
- It contributed to hunger in Africa countries
- It led to poverty/poor standard of living in Africa countries
- It led to the destruction of health and education services in many Africa countries
- Any other relevant response (Any 2 x 2) (4)
3.2.3 [Extraction of evidence from Source 3B – L1]
- Debt among African countries doubled to over $1.5 trillion by the end of the 1980s, doubling again to $3 trillion by the end of the 1990s (1 x 2) (2)
3.2.4 [Evaluation of usefulness from Source 3B – L3]
Candidates can choose either USEFUL or NOT USEFUL and substantiate their response with relevant evidence.
USEFUL
- It highlights the financial impact that structural adjustment polices had African countries
- It highlights the capital drain that African countries experienced
- It explains the effects that Structural Adjustment Polices had on the young people
- It explain the views of internationally acclaimed economists such as A Ismi; Morris Miller (Canadian former World Bank director); Perez de Cuellar (UN Secretary General) on Structural Adjustment Policies
- Any other relevant response
NOT USEFUL
- The source is the view of two authors on SAPs and might be biased
- The source does not give enough information on the effects of Structural Adjustment Policies on African countries
- Any other relevant response (Any 2 x 2) (4)
3.3
3.3.1 [Interpretation of information from Source 3C – L2]
The cartoonist portrays the International Monetary Fund's Structural Adjustment Policies in a negative way because:
- There was no improvement in the past 10 years
- There was stagnation in the economies of African countries
- Any other relevant response (Any 2 x 2) (4)
3.3.2 [Interpretation and evaluation of information from Source 1C – L2]
- The caption shows the impact that the Structural Adjustment Polices have had on developing countries/no difference
- The caption shows that after 10 years of implementing Structural Adjustment Policies developing countries are still impoverished
- The caption shows that Structural Adjustment Policies have benefitted only a few
- The caption shows the Structural Adjustment Policies are a failure
- Any other relevant response (Any 2 x 2) (4)
3.4 [Comparing of evidence in Sources 3B and 3C – L3]
- Source 3B refers to the restrictions that were imposed on government spending due to debt repayment while Source 3C shows Africans not having proper housing
- Source 3B indicates that debt repayment resulted in poverty among Africans while Source 3C shows evidence of poverty
- Any other relevant response (2 x 2) (4)
3.5
3.5.1 [Interpretation of evidence from Source 3D – L2]
To a large extent
- Privatising state enterprises, reducing inflation, and decreasing budget deficits
- The extraction of raw materials or goods
- Any other relevant response
To a lesser extent
- Economic growth is environmentally unsustainable
- Economic growth fails to generate employment or increased income
- Any other relevant response (2 x 2) (4)
3.5.2 [Extraction evidence from Source 3D – L1]
- Layoffs of government workers
- Wage constraints
- Higher interest rates
- Reduced government spending
- The shutdown of domestic industries (Any 3 x 1) (3)
3.6 [Interpretation, evaluation and synthesis of evidence from relevant sources - L3]
Candidates could include the following aspects in their response.
- Developing countries that implemented Structural Adjustment Policies were subjected to IMF dictated economic rules (Source 3A)
- The implementation of Structural Adjustment Policies were under obligation to privatise state assets, lower tariffs and cut subsidies on consumer goods (Source 3A)
- Developing countries suffered interference from the IMF and the World Bank in their internal affairs (Source 3A)
- Almost $178 billion was transferred to Western commercial banks which restricted government spending (Source 3B)
- The loan terms of the IMF and the World Bank contributed to poverty and hunger in developing countries (Source 3B)
- The loan terms of the IMF and the World Bank destroyed the health and education sectors in many developing countries (Source 3B)
- The implementation of Structural Adjustment Policies contributed to the increase in poverty among Africans (no proper housing, lack of electricity, running water) (Source 3C)
- Structural Adjustment Policies resulted in a decrease in the local buying power as imports were too expensive (Source 3D)
- The implementation of Structural Adjustment Policies resulted in government layoffs, restrictions on wages, reduced government spending and redundancy in local markets (Source 3D)
- Structural Adjustment Policies resulted in socio-economic insecurity, political instability, anti-government protest and riots over increased food prices (own knowledge)
- Any other relevant response
Use the following rubric to allocate marks:
LEVEL 1 |
| MARKS 0–2 |
LEVEL 2 |
| MARKS 3–5 |
LEVEL 3 |
| MARKS 6–8 |
(8)
[50]
SECTION B: ESSAY QUESTIONS
QUESTION 4: CIVIL RESISTANCE, 1970s TO 1980s: SOUTH AFRICA: THE CRISIS OF APARTHEID IN THE 1980s
[Plan and construct an original argument based on relevant evidence using analytical and interpretative skills]
SYNOPSIS
Candidates need to indicate if they agree or disagree with the statement. They need to use relevant examples to indicate whether internal resistance organisations were successful in challenging PW Botha's apartheid regime in the 1980s.
MAIN ASPECTS
Candidates could include the following aspects in their response:
- Introduction: Candidates need to explain how the various internal resistance organisations were successful in challenging the apartheid government.
ELABORATION
- Botha's attempted to reform apartheid through the Tri-Cameral parliament
- The formation and response of the UDF to the Tri-Cameral parliamentary system
- The UDF embarked on campaigns such as the 'Don't Vote Campaign' and 'Million Signature' Campaigns (To persuade Coloureds and Indian South Africans from voting in the Tri-Cameral parliamentary elections)
- The intensification of the internal resistance e.g. violent protests in the Vaal Triangle and elsewhere in South Africa
- The role of Vaal Civic Association in organising rent boycotts (The Vaal Townships embarked on rolling mass action; councillors were killed; schools went on boycotts)
- PW Botha declared successive States of Emergencies in 1985 and 1986 to stem the opposition to apartheid but was unsuccessful
- The role of trade unions (The formation of COSATU in 1985 was a turning point in the struggle for freedom and democracy; the African Food Canning Workers Union called for the first national strike)
- These strikes were aimed at improving the working conditions of workers
- Consumer boycotts played a vital role in the fight against Apartheid (the economy was affected which impacted negatively on white South Africans)
- Education struggles – Education Crisis Committee, COSAS and NUSAS launched the 'Education Charter Campaign', etc. against Botha's regime
- The role of the 'End Conscription Campaign' (White South African men resisted conscription into the army; Many white South African soldiers felt it was wrong to suppress township revolts)
- The role of faith organisations
- The role of the Black Sash (They opposed Apartheid, gave humanitarian aid to victims of Apartheid)
- The role and impact of the Mass Democratic Movement (MDM) in resisting PW Botha's regime
- By the end of 1989 the country became ungovernable and the apartheid regime was forced to begin negotiations with anti-apartheid organisations
- Any other relevant response
Conclusion: Candidates should sum up their argument with a relevant conclusion.
[50]
QUESTION 5: THE COMING OF DEMOCRACY TO SOUTH AFRICA AND COMING TO TERMS WITH THE PAST
[Plan and construct an original argument based on relevant evidence using analytical and interpretative skills]
SYNOPSIS
Candidates need to critically discuss how the violence that engulfed South Africa in the early 1990s nearly derailed the process of negotiations among various political organisations. They must be able to show how the process of negotiations was able to overcome the various challenges that confronted them on the path to democracy.
MAIN ASPECTS
Candidates could include the following aspects in their essays:
- Introduction: Candidates need to critically discuss the statement and indicate how they intend supporting their line of argument.
ELABORATION
NEGOTIATIONS
- De Klerk's decision to release Mandela from prison on 11 February 1990 which paved the way for negotiations.
- Groote Schuur Minute – 2 May 1990 (Talks between ANC and NP)
- Obstacles to negotiations were discussed (security legislation, troops in the townships, armed struggle and the return of exiles including Tambo)
- The ANC and NP still disagreed on the definition of political prisoners
- The Pretoria Minute – 6 August 1990 (ANC agreed to suspend the armed struggle, while the government lifted the State of Emergency)
- The 'ceasefire' between the ANC and the government did not stop the violence between the ANC and Inkatha
- The role of the 'Third Force' in perpetuating violence in South Africa
- CODESA 1 (20 December 1991, 19 political parties excluding AZAPO; PAC and CP attended, 300 delegates)
- All parties signed the Declaration of Intent (committing themselves to a multi party democracy)
- 'White's only' referendum in1992 (to ascertain if white South Africans supported the process of negotiations)
VIOLENCE
- While negotiations occurred there was on-going violence in the country
- Violence threatened to derail the process of negotiation
- Boipatong Massacre in the Vaal Triangle 17 June 1992 (ANC broke off negotiations with the government, CODESA 2 talks collapsed)
- Bhisho Massacre 7 September 1992 and its effects on the process of negotiations
- Attacks by the AWB on the World Trade Centre – an attempt to stop the process of negotiations,
- Assassination of Chris Hani on 10 April 1993 spurred on the process of negotiations for a democratic South Africa
RESULTS OF NEGOTIATIONS
- Record of Understanding - both the ANC and the NP government realised that the Process of negotiations should continue (Role of Meyer and Ramaphosa)
- Multi-party Negotiating Forum which included the PAC and the Conservative Party
- Sunset Clause introduced by Slovo broke the negotiations deadlock and paved the way for democratic elections in South Africa
- Date for the first democratic election was set (South Africans to vote on 27 April 1994)
- Any other relevant response
Conclusion: Candidates should tie up their argument with a relevant conclusion
[50]
QUESTION 6: THE END OF THE COLD WAR AND A NEW WORLD ORDER: THE EVENTS OF 1989
[Plan and construct an original argument based on relevant evidence using analytical and interpretive skill
SYNOPSIS
Candidates need to explain to what extent the disintegration of the Soviet Union contributed to political changes that occurred in South Africa after 1989. They need to take a line of argument and support their response with relevant historical evidence.
MAIN ASPECTS
Candidates could include the following aspects in their response:
ELABORATION
Candidates could include the following aspects in their answer.
- Introduction: Candidates should explain to what extent the disintegration of the Soviet Union contributed to political changes in South Africa from 1989.
- Gorbachev's policies of Glasnost and Perestroika and its impact on South Africa
- By the end of 1989 the Soviet Union disintegrated
- The disintegration of the USSR affected the ANC negatively because the main source of support was curtailed
- The National Party was also affected by the disintegration of the Soviet Union – it could not continue to use communism as an excuse to invade southern Africa countries and not to talk to the ANC
- The National Party's claim that it was protecting South Africa from a communist onslaught became unrealistic
- South Africa was no longer key to the Cold War tensions in Southern Africa
- Influential National Party members started to realise that apartheid was not going to answer the needs of the white capitalist economy
- The ANC and the NP had no choice but start the process of negotiations
- Western countries were in favour of the negotiations in South Africa
- By the late 1980s the South African economy was in a state of depression
- PW Botha suffered a stroke and was succeeded by FW de Klerk
- FW de Klerk started to accept that the black South Africans struggle against apartheid was not a conspiracy directed from Moscow
- De Klerk laid the foundation for the talks
- Political prisoners were released in October 1989
- Meeting of Mandela and De Klerk in December 1989
- On 2 February 1990 De Klerk made a ground breaking speech in parliament
- This signalled the end of apartheid
- Any other relevant response
Conclusion: Candidates should tie up their argument with a relevant conclusion
[50]
TOTAL: 150
HISTORY PAPER 1 GRADE 12 MEMORANDUM - NSC PAST PAPERS AND MEMOS FEBRUARY/MARCH 2017
HISTORY
PAPER 1
GRADE 12
NSC PAST PAPERS AND MEMOS
FEBRUARY/MARCH 2017
1. SOURCE-BASED QUESTIONS
1.1 The following cognitive levels were used to develop source-based questions:
Cognitive | Historical skills | Weighting of questions |
LEVEL 1 |
| 30% |
LEVEL 2 |
| 40% |
LEVEL 3 |
| 30% |
1.2 The information below indicates how source-based questions are assessed:
- In the marking of source-based questions, credit needs to be given to any other valid and relevant viewpoints, arguments, evidence or examples.
- In the allocation of marks, emphasis should be placed on how the requirements of the question have been addressed.
- In the marking guideline, the requirements of the question (skills that need to be addressed) as well as the level of the question are indicated in italics.
1.3 Assessment procedures for source-based questions
- Use a tick (✔) for each correct answer
- Pay attention to the mark scheme e.g. (2 x 2) which translates to two reasons and is given two marks each (✔✔✔✔); (1 x 2) which translates to one reason and is given two marks (✔✔)
- If a question carries 4 marks then indicate by placing 4 ticks (✔✔✔✔)
Paragraph question
Paragraphs are to be assessed globally (holistically). Both the content and structure of the paragraph must be taken into account when awarding a mark. The following steps must be used when assessing a response to a paragraph question: • Read the paragraph and place a bullet (⚫) at each point within the text where the candidate has used relevant evidence to address the question.
- Re-read the paragraph to evaluate the extent to which the candidate has been able to use relevant evidence to write a paragraph.
- At the end of the paragraph indicate the ticks (✔) that the candidate were awarded for the paragraph as well as the level (1, 2 or 3), as indicated in the holistic rubric and a brief comment, e.g.
- Used mostly relevant evidence to write a basic paragraph.
Count all the ticks for the source-based question and then write the mark in the bottom right-hand margin, e.g. 32/50 - Ensure that the total mark is transferred accurately to the front/back cover of the answer script.
2. ESSAY QUESTIONS
2.1 The essay questions require candidates to:
- Be able to structure their argument in a logical and coherent manner. They need to select, organise and connect the relevant information so that they are able to present a reasonable sequence of facts or an effective argument to answer the question posed. It is essential that an essay has an introduction, a coherent and balanced body of evidence and a conclusion.
2.2 Marking of essay questions
- Markers must be aware that the content of the answer will be guided by the textbooks in use at the particular centre.
- Candidates may have any other relevant introduction and/or conclusion than those included in a specific essay marking guideline for a specific essay.
- When assessing open-ended source-based questions, learners should be credited for any other relevant answers.
2.3 Global assessment of the essay
The essay will be assessed holistically (globally). This approach requires the teacher to score the overall product as a whole, without scoring the component parts separately. This approach encourages the learner to offer an individual opinion by using selected factual evidence to support an argument. The learner will not be required to simply regurgitate 'facts' in order to achieve a high mark. This approach discourages learners from preparing 'model' answers and reproducing them without taking into account the specific requirements of the question. Holistic marking of the essay credits learners' opinions supported by evidence. Holistic assessment, unlike content-based marking, does not penalise language inadequacies as the emphasis is on the following:
- The construction of argument
- The appropriate selection of factual evidence to support such argument
- The learner's interpretation of the question.
2.4 Assessment procedures of the essay
2.4.1 Keep the synopsis in mind when assessing the essay.
2.4.2 During the first reading of the essay ticks need to be awarded for a relevant introduction (indicated by a bullet in the marking guideline/memorandum), each of the main points/aspects that is properly contextualized (also indicated by bullets in the marking guideline/memorandum) and a relevant conclusion (indicated by a bullet in the marking guideline/memorandum) e.g. in an answer where there are 5 main points there will be 7 ticks.
2.4.3 The following additional symbols can also be used:
- Introduction, main aspects and conclusion not properly contextualised ^
- Wrong statement _________________
- Irrelevant statement |
|
| - Repetition R
- Analysis A√
- Interpretation 1√
2.5. The matrix
2.5.1 Use of the matrix in the marking of essays
In the marking of essays, the criteria as provided in the matrix should be used. When assessing the essay note both the content and presentation. At the point of intersection of the content and presentation based on the seven competency levels, a mark should be awarded.
(a) The first reading of the essay will be to determine to what extent the main aspects have been covered and to allocate the content level (on the matrix).
C | LEVEL 4 | |
(b) The second reading of the essay will relate to the level (on the matrix) of presentation.
C | LEVEL 4 | |
P | LEVEL 3 |
(c) Allocate an overall mark with the use of the matrix.
C | LEVEL 4 |
}26–27 |
P | LEVEL 3 |
MARKING MATRIX FOR ESSAY: TOTAL MARKS: 50
PRESENTATION
CONTENT | LEVEL 7
| LEVEL 6
| LEVEL 5
| LEVEL 4
| LEVEL 3
| LEVEL 2
| LEVEL 1*
|
LEVEL 7
| 47–50 | 43–46 | |||||
LEVEL 6
| 43–46 | 40–42 | 38–39 | ||||
LEVEL 5
| 38–39 | 36–37 | 34–35 | 30–33 | 28–29 | ||
LEVEL 4
| 30–33 | 28–29 | 26–27 | ||||
LEVEL 3
| 26–27 | 24–25 | 20–23 | ||||
LEVEL 2
| 20–23 | 18–19 | 14–17 | ||||
LEVEL 1*
| 14–17 | 0–13 |
* Guidelines for allocating a mark for Level 1:
- Question not addressed at all/totally irrelevant content; no attempt to structure the essay = 0
- Question includes basic and generally irrelevant information; no attempt to structure the essay = 1–6
- Question inadequately addressed and vague; little attempt to structure the essay = 7–13
MEMORANDUM
SECTION A: SOURCE-BASED QUESTIONS
QUESTION 1: HOW DID THE UNITED STATES OF AMERICA AND THE SOVIET UNION RESPOND TO THE ECONOMIC CRISIS IN EUROPE AFTER 1945?
1.1
1.1.1 [Explanation of a historical concept in Source 1A – L1]
- A US policy that attempted to curb/stop communist expansion in European countries after 1945
- Any other relevant explanation (any 1 x 2) (2)
1.1.2 [Extraction of evidence from Source 1A – L1]
- It was an economic and social reconstruction plan for Europe
- To speed up recovery in the countries still suffering the effects of the Second World War
- It was the key to political stability in Europe
- To crush the Soviet influence in Europe (any 2 x 1) (2)
1.1.3 [Extraction of evidence from Source 1A – L1]
- Stalin was extremely sceptical of the plan
- Stalin ordered those under his Eastern Bloc to reject American aid
- Created a Soviet plan (COMECON) as a response to the Marshall Plan. (2 x 1) (2)
1.1.4 [Interpretation of evidence from Source 1A – L2]
- The Marshall Plan was offered as financial aid to European countries
- Truman asked the Congress to facilitate the implementation of the Marshall Plan in 16 Western European countries
- Financial aid was given to Greece and Turkey with the purpose to stop the spread of communism there
- Aid was given to the 16 Western European countries in the form of money to be used to buy American imports/goods
Any other relevant response (any 2 x 2) (4)
1.1.5 [Extraction of evidence from Source 1A – L1]
- As a response/reaction to the Marshall Plan (1 x 2) (2)
1.2
1.2.1 [Extraction of evidence from Source 1B – L1]
- It was the first time/ unheard of that a victorious nation went to rebuild the battlefields
- Bellows claimed it was the first time that a victorious nation went to reconstitute the economy (2 x 1) (2)
1.2.2 [Interpretation of evidence from Source 1B – L2]
The USA wanted to:
- Protect and sustain the system of capitalism
- Prevent the spread of communism
- Maintain their independence and preserve democracy
- Any other relevant response (2 x 2) (4)
1.2.3 [Extraction of evidence from Source 1B – L1]
- Bridges
- Highways
- Hospitals
- Airports
- Schools (any 2 x 1) (2)
1.3
1.3.1 [Extraction of evidence in Source 1C – L1]
- United States moved towards the renunciation of the principles of collaboration
- Economic resources used as an instrument of political pressure
- The USA tried to impose its will on other independent states (1 x 2) (2)
1.3.2 [Interpretation of evidence in Source 1C – L2]
- The USA made countries dependent on it by using its monopolies
- The USA could control other countries economy and politics
- The USA could interfere in these countries international affairs/internal affairs
- Any other relevant response (any 2 x 2) (4)
1.3.3 [Evaluate the usefulness of Source 1C – L3]
Candidates should indicate to what extent the source is USEFUL and support their answer with relevant evidence.
USEFUL TO A LARGE EXTENT
- The source is a speech by the Soviet Foreign Minister during the implementation of the Marshall Plan
- The source indicates how a high ranking Soviet interpreted the purpose of the Marshall Plan
- The information does reflect the official stance taken by the Soviet Union on the Marshall Plan
- Any other relevant response
OR
USEFUL TO A LESSER EXTENT
- The source could be seen as being biased against the USA because it was an opinion of the Soviet Foreign Minister
- The source had a negative opinion of the Marshall Plan
- The source also makes some assumptions of the USA's purpose for the future which was not substantiated
- Any other relevant response (any 2 x 2) (4)
1.4 [Comparison of information in Sources 1B and 1C – L3]
- Source 1B is a response from an American government official giving a positive feedback on the purpose of the Marshall Plan while Source 1C is the response from a Soviet government official which gives a negative summary of the Marshall Plan
- Source 1B indicates that European countries could decide for themselves how they were going to use the Marshall Plan while Source 1C states that the USA will impose its will on the participating European countries
- Source 1B does not make any mention of how the Marshall Plan will be used to split Europe into two camps and that it showed hostility towards the Soviet Union but Source 1C mentions that the Marshall Plan was an attempt to split Europe into two camps one of which would be hostile towards the interests of the Soviet Union
- Any other relevant comparison (any 2 x 2) (4)
1.5
1.5.1 [Interpretation of information in Source 1D – L2]
- The Marshall Plan was economically successful/well resourced (tractors being used/smiling driver on the tractor) and the Marshal Stalin plan was poorly resourced
- Eastern European countries (satellite states) doubted the COMECON (Marshal Stalin plan) (Stalin trying to convince countries/person to use his economic plan – people seem unwilling)
- Eastern European countries could notice how the Western Countries benefitted from the Marshall Plan as only a border separated these countries (a person can be seen looking over a small fence)
- The COMECON's (Marshal Stalin plan) assistance was seen as far less than that of the Marshall Plan (tractor against an old plough)
- The COMECON (Marshal Stalin plan) would fall directly under Soviet control (plough signifies communism)
- The Marshal Stalin plan placed a burden on satellite states as depicted by a heavy yoke (pulling while sweating)
- Any other relevant response (any 2 x 2) (4)
1.5.2 [Interpretation of evidence in Source 1D – L2]
- The Marshall Plan and COMECON (Marshal Stalin plan) were both economic plans to assist European countries after the Second World War
- The Marshall Plan is a more modern and efficient system with enough finance and machinery to sustain itself while the COMECON (Marshal Stalin plan) lacked the finances and efficient machinery
- Both the USA and the Soviet Union attempted to assist European countries, however the Soviet Union's help is portrayed as backward and financially unsustainable
- Any other relevant response (any 2 x 2) (4)
1.6 [Interpretation, evaluation and synthesis of evidence from relevant sources – L3]
In responding to this question, the candidate is required to refer to both perspectives. Candidates could include the following aspects in their responses:
USA
- Introduced the Marshall Plan which was part of the policy of containment to prevent European countries from falling in the Soviet sphere of influence(Sources 1A and 1B)
- Designed an economic policy to help countries in Europe to rebuild their infrastructure and their own economies (Sources 1A and 1B)
- Increased exports to Europe and benefited from the counterpart fund (Source 1B)
- Made the Marshall Plan available to all countries that needed help (Source 1A)
- Ensured that the Marshall Plan remained financially stronger than the COMECON (Marshal Stalin plan) (Source 1D)
- Any other relevant response
SOVIET UNION
- Stalin became sceptical and negative towards the Marshall Plan (Sources 1A en 1C)
- Eastern Bloc countries were ordered to reject the Marshall Plan (Source 1A)
- The Marshall Plan was rejected because it violated the principles of the United Nations (Source 1C)
- Regarded the Marshall Plan as a tool of the USA to impose its will onto countries leading to economic and political control (Source 1C)
- Interpreted the Marshall Plan as means to form an anti-Soviet bloc (Sources 1A en 1C)
- Countered the Marshall plan by creating the COMECON for Eastern Bloc countries (Source 1A)
- Any other relevant response
Use the following rubric to allocate a mark:
LEVEL 1 |
| MARKS 0–2 |
LEVEL 2 |
| MARKS 3–5 |
LEVEL 3 |
| MARKS 6–8 |
(8)
[50]
QUESTION 2: WHAT WERE THE CAUSES AND CONSEQUENCES OF CUBA'S INVOLVEMENT IN THE BATTLE OF CUITO CUANAVALE BETWEEN 1987 AND 1988?
2.1
2.1.1 [Extraction of evidence from Source 2A – L1]
The Angolan army suffered a humiliating defeat at the Lomba river a at the hands of the SADF (any 1 x 2) (2)
2.1.2 [Extraction of evidence from Source 2A – L1]
- SADF units were stationed deep inside Angola
- General Malan visited troops inside Angola
- SADF drew up military plans for two new operations, Hooper and Parker (any 2 x 1) (2)
2.1.3 [Interpretation of evidence from Source 2A – L2]
- South Africa was no longer just offering assistance to the UNITA forces
- South Africa had admitted publically that SADF troops were fighting in Angola (and not only in Namibia)
- South Africa took a leading role in attempting to defeat FAPLA in the Angolan civil war
- Any other relevant answer (any 1 x 2) (2)
2.1.4 [Interpretation of evidence from Source 2A – L2]
- Angolan troops were under attack from UNITA and SADF forces
- The 'fight and talk' strategy suggested by Soviet military advisors had failed
- Cuba had assisted the MPLA government of Angola in the past
- Castro had often expressed his commitment to internationalism
- Any other relevant answer (any 2 x 2) (4)
2.2
2.2.1 [Extraction of evidence from Source 2B – L1]
- Thousands of SADF troops have been deployed to fight FAPLA troops in Angola
- SADF carried out an important operation in south-eastern Angola
- It was an unequal battle (any 2 x 1) (2)
2.2.2 [Extraction of evidence from Source 2B – L1]
- Meticulous planning
- A total of 50 000 Cuban troops had been committed to Angola
- Cuban troops gained control of the skies there for the first time in twelve years
- 998 tanks were sent by the Cubans
- More than 600 armoured vehicles
- 1 600 artillery, mortars and anti-aircraft defence weapons
- Determination to achieve victory
- Combining boldness and heroism (any 3 x 1) (3)
2.2.3 [Interpretation of evidence from Source 2B – L2]
- Fidel Castro was responsible for directing, although not physically with them, the Cuban army at Cuito Cuanavale; their victory showed that Fidel Castro was a great military strategist
- Fidel Castro was the leader of Cuba and responsible for the decision to send in troops to Angola and the victory at Cuito Cuanavale reflected well upon his leadership decisions
- Raul Castro wanted to show that the positive consequences of Cuban internationalism (involvement in Angola) proved that Fidel Castro was a great statesman
- Any other relevant answer (any 1 x 2) (2)
2.2.4 [Interpretation of evidence from Source 2B – L2]
- Despite heavy bombardment by the SADF, South Africans failed to capture Cuito Cuanavale (were defeated)
- Cuba's involvement at Cuito Cuanavale secured victory for the Angolans (FAPLA/ MPLA)
- The failure of the SADF to take Cuito Cuanavale had long-term consequences, for example, the SADF military was humiliated, and there was greater will to negotiate a settlement which led to the withdrawal of the SADF and Cuban troops from Angola.
- Cuito Cuanavale was a strategically important victory for the Cubans/Angolans against the SADF/UNITA forces (successfully defended)
- Any other relevant response (any 2 x 2) (4)
2.3 [Comparison of information in Sources 2A and 2B – L3]
- In Source 2A the SADF is shown as having regained a superior position in the Battle of Cuito Cuanavale before the Cubans arrived and in Source 2B Castro supported this view and shows how much military assistance was needed from Cuba to defeat the SADF
- In Source 2A, Dos Santos called upon Cuba for help knowing that they would provide support and Source 2B shows the willingness and degree of Cuban support for the Angolan government as part of Cuba's commitment to internationalism
- Any other relevant answer (2 x 2) (4)
2.4
2.4.1 [Interpretation of evidence from Source 2C – L2]
- Cuban and Angolan soldiers worked together to secure a victory at Cuito Cuanavale (shown holding up Angola together)
- Cuba's and Angola's military victory upheld the sovereignty, independence of the MPLA government (soldiers holding up a map of Angola)
- It implies that Cubans fought as equals alongside the Angolan troops (brothers in arms). They are the same size, wore the same uniforms and carried the same guns
- Any other relevant answer (2 x 2) (4)
2.4.2 [Interpretation of evidence from Source 2C – L2]
- The memorial celebrates male, military power and strength. It suggests that it is these men who were responsible for the survival of Angola (strong men in uniforms and with guns, holding up the map of Angola)
- The Battle of Cuito Cuanavale was remembered as an important battle in the history of Angola
- It shows that the Angolan and Cuban soldiers worked together for a common purpose
- There is no recognition of the women and children who fought alongside the men in the Battle of Cuito Cuanavale, nor of the women who played a supporting role in the Cuban and Angolan military
- There is no acknowledgement of the Angolan civilians who lost their lives in the Battle of Cuito Cuanavale
- Any other relevant response (any 2 x 2) (4)
2.5 2.5.1 [Explanation of a historical concept from Source 2D – L1]
- To gain independence from colonial rule
- To follow your rules and laws as enshrined in your respective country's constitution
- Any other relevant response (1 x 2) (2)
2.5.2 [Extraction of evidence from Source 2D – L1]
- It was victory for the whole of Africa
- It enabled Namibia to win independence
- Broke the myth of invincibility of the apartheid army
- Inspired the dispossessed and marginalised South Africans
- Resulted in the unbanning of South African liberation movements
- A milestone in the history of liberation
- A turning point in the struggle to free Africa (any 3 x 1) (3)
2.5.3 [Evaluating the usefulness of evidence in Source 2D – L3]
- The source is taken from a speech delivered by former president Nelson Mandela
- The results which Mandela refers to can be supported/ corroborated from other evidence
- The source confirms that Cuban troops played a significant role in the Battle of Cuito Cuanavale
- Evidence in the source suggests that there were far-reaching consequences of Cuba's involvement in the Battle of Cuito Cuanavale
- Any other relevant answer (any 2 x 2) (4)
2.6 [Interpretation, evaluation and synthesis of evidence from relevant sources – L3]
Candidates could include some of the following aspects in their response:
Causes
- The SADF won a decisive victory at the Lomba River and Angolan sovereignty was threatened (Source 2A)
- The SADF had established a strong foothold and positioned its troops deep inside Angola
- Dos Santos asked Cuba for assistance when Russian plans failed (Source 2A)
- Cuba was committed to internationalism (Source 2B)
- Cuba had supported the MPLA government in the Angolan civil war since the mid-1970s (own knowledge)
Consequences
- The SADF was defeated due to the military presence and strength of Cuba
- It enabled Namibia to win independence (Source 2D)
- The SADF defeat broke the myth of invincibility of the apartheid army (Source 2D)
- The liberation movements within South Africa were inspired by Cuban strength and commitment to internationalism (Source 2D)
- Cuban soldiers fought and died alongside their Angolan comrades (Source 2C)
- The Cubans sent a large number of military personnel and equipment to fight in Angola (Source 2B)
- Any other relevant answer
Use the following rubric to allocate a mark:
LEVEL 1 |
| MARKS: 0–2 |
LEVEL 2 |
| MARKS: 3–5 |
LEVEL 3 |
| MARKS: 6–8 |
(8)
[50]
QUESTION 3: WHAT IMPACT DID THE CLOSURE OF HIGH SCHOOLS HAVE ON THE COMMUNITY OF LITTLE ROCK, ARKANSAS, IN 1958?
3.1
3.1.1 [Extraction of evidence from Source 3A – L1]
- Deep concern for proper education of their children (1 x 1) (1)
- Interruption of proper educational processes (1 x 1) (1)
3.1.2 [Extraction of evidence from Source 3A – L1]
- It was because the last hope of the relief from an intolerable situation has been exhausted
- To prevent the integration of schools (2 x 1) (2)
3.1.3 [Explanation of a historical concept from Source 3A – L1]
- A process that allowed African American learners to attend the same schools with white American learners e.g. Central High School in Little Rock
- Process where learners of different races would attend the same school together
- Racial mixing of learners (African Americans and White Americans) at schools
- Any other relevant response (any 1 x 2) (2)
3.1.4 [Interpretation of evidence in Source 3A – L2]
Integration of schools would:
- Lead to violence/bloodshed in schools in Little Rock
- Lead to destruction of the schooling system
- Any other relevant response (any 2 x 2) (4)
3.1.5 [Extraction of evidence from Source 3A – L1]
- The federal government had no authority to require any state to operate public schools
- The federal government had no authority to tell the state government for what purposes it levied taxes and how taxes were used
- The federal courts said only that an agency of the state cannot maintain segregated school (any 2 x 1) (2)
3.1.6 [Evaluating the usefulness of Source 3A – L3]
- This source contains the official speech made by Governor Faubus
- It was the action taken after Governor Faubus signed the Bills of Extraordinary Session of the General Assembly
- High Schools in Little Rock were closed during the 1958-1959 academic year; that information can be corroborated with information from other sources
- Information about the closure of high schools in Little Rock can be found in the Little Rock historical archives
- Any other relevant response (any 2 x 2) (4)
3.2
3.2.1 [Extraction of evidence from Source 3B – L1]
- White learners: 2 915 (1 x 1) (1)
- Black learners: 750 (1 x 1) (1)
3.2.2 [Interpretation of evidence in Source 3B – L2]
- The opening of private schools for black learners could be seen as going against the demand for equal access to education for all Americans
- Black private schools could have perpetuated segregated system of education
- Few black families could have afforded private education for their children
- Supreme Court ruling of 1954 had ruled against segregated education
- Any other relevant response (any 2 x 2) (4)
3.3
3.3.1 [Interpretation of evidence in Source 3C – L2]
- To show how televised lessons were conducted during the Lost Year
- To show that learners were expected to learn without educators guidance/support
- To show the effects of Faubus' action regarding the closure of all high schools
- Any other relevant response (any 2 x 2) (4)
3.3.2 [Interpretation of evidence in Source 3C – L2]
Candidates should indicate SUPPORT or DO NOT SUPPORT and support their answer with relevant evidence.
SUPPORT
- No formal assessment was given to learners
- No teachers to guide learners
- Learners seem disinterested
- No records of learners who actually listened to lessons
- Any other relevant response
OR
DO NOT SUPPORT
- Shows learners listening to a televised lesson
- Shows an image of learning taking place
- Learners taking notes
- Any other relevant response (any 2 x 2) (4)
3.4 [Comparison of information in Sources 3B and 3C - L3]
- Source 3B refers to displaced learners while Source 3C shows learners watching a televised lesson
- Source 3B refers to alternative schooling while Source 3C shows learners taking notes in a living room
- Source 3B refers to the Lost Year while Source 3C shows learners during the Lost Year
- Any other relevant response (2 x 2) (4)
3.5
3.5.1 [Extraction of evidence from Source 3D – L1]
- To condemn the school closing action
- To support the reopening of schools (2 x 1) (2)
3.5.2 [Extraction of evidence from Source 3D – L1]
- To recall the segregationist board members
- They contacted registered voters and visited people door to door to create enough support to recall the three segregationist board members and retain the three moderate ones (any 1 x 2) (2)
3.5.3 [Analysis of evidence in Source 3D – L2]
- Schools in Little Rock were ultimately desegregated
- The Federal government had successfully implemented integration of the schools
- The American constitution was upheld
- Any other relevant response (any 2 x 2) (4)
3.6 [Interpretation, evaluation and synthesis of evidence from relevant sources – L3]
Candidates could include the following aspects in their response:
- Governor Faubus used state machinery to close schools (own knowledge)
- Governor Faubus influenced white parents against school desegregation (own knowledge)
- Schooling was interrupted by Governor Faubus' actions (Source 3A)
- The effects of school desegregation on learners and parents (Source 3B)
- 2915 white learners were displaced while 750 black learners were displaced (Source 3B)
- 93% of white learners were able to find alternative schooling while 50% of black learners could not find alternative schooling (Source 3B)
- Many learners lost out on schooling (own knowledge)
- Several groups were organised either to support the closure of schools or to keep them open (3B)
- Learners watched televised lessons (Source 3C)
- Televised lessons not effective as learners were not monitored (own knowledge)
- WEC and STOP worked together for the reopening of all schools (Source 3D)
- Parents attitude towards desegregation shifted towards limited desegregation (Source 3D)
- Relations between some white and black parents improved (own knowledge)
- Any other relevant response
Use the following rubric to allocate a mark:
LEVEL 1 |
| MARKS 0–2 |
LEVEL 2 |
| MARKS 3–5 |
LEVEL 3 |
| MARKS 6–8 |
(8)
[50]
SECTION B: ESSAY QUESTIONS
QUESTION 4: EXTENSION OF THE COLD WAR: CASE STUDY – VIETNAM
[Plan and construct an original argument based on relevant evidence using analytical and interpretative skills]
SYNOPSIS
Candidates are expected to evaluate whether the United States of America lost the war due to the opposition within the country or because of its military failure on the battlefields of Vietnam. Candidates should identify the different forms of opposition to the war in Vietnam and weigh these factors against the impact of the military strategies that were used on the battlefields of Vietnam.
MAIN ASPECTS
Candidates should include the following aspects in their response:
- Introduction: Candidates are expected to contextualise the question, establish a clear line of argument and indicate how they will answer the question.
ELABORATION
Reasons for USA's involvement in Vietnam
- Stop the spread of communism in Asia
- Gulf of Tonkin Resolution (1964)
- The Domino Theory
Opposition within the United States of America (USA Politics)
- Anti-war demonstrations
- Opposition to conscription (e.g.: Mohammed Ali, university learners)
- The role of the media
- Veteran anti-war protest
Military failure on the battlefields
- Conscription of young inexperienced soldiers/guerillas in Vietnam were highly experienced from struggle wars against colonial powers
- USA's mass aerial bombing 'Operation Rolling Thunder' from 1965 (conventional warfare)/guerilla tactics presented no visible targets for bombing; Ho Chi Minh Trail kept supplies from North Vietnam moving into South Vietnam
- 'Operation Ranch Hand' (use of chemicals to destroy forests (Agent Orange) and crops (Agent Blue)/Effects of napalm on the Vietnamese turned them against the USA and supported the guerrillas; guerrillas won support of farmers
- The TET offensive (January 1968) (The US controlled towns and cities ambushed by guerrillas)
- The US army used search and destroy methods (My Lai massacre) to destroy villages supported by Vietcong/killing of women and children turned locals against the US to support the guerrillas; media published pictures that won sympathy for Vietnam
- President Nixon's Vietnamisation policy/including WHAM (Winning the hearts and minds of the Vietnamese) was an attempt by the USA to withdraw from war and 'save face'
- The USA withdrew all troops by 1973 and North Vietnam took control of Saigon in 1975
- Any other relevant response
Conclusion: Candidates should tie up their argument with a relevant conclusion.
[50]
QUESTION 5: INDEPENDENT AFRICA: COMPARATIVE CASE STUDY – THE CONGO AND TANZANIA
[Plan and construct an argument based on evidence using analytical and interpretative skills]
SYNOPSIS
In writing this essay, candidates must critically discuss the aims, implementation and effects of policies of Zairianisation (the Congo) and Ujamaa (villagisation) (Tanzania) and how they failed to 'Africanise' their economies of the Congo and Tanzania after attaining independence in the 1960s. Candidates should also indicate why both countries failed to achieve full economic independence, and provide relevant evidence to support their line of argument.
MAIN ASPECTS
Candidates should include the following aspects in their response:
- Introduction: Candidates should contextualise the question and show how Mobutu Sese Seko and Julius Nyerere of newly independent Congo and Tanzania respectively hoped to 'Africanise' their economies. Candidates should establish their line of argument in response to the question.
ELABORATION
Africanisation in the Congo: Zairianisation
Aims
- To replace foreigners with Congolese nationals in key positions
- To take Congo's means of producing wealth into African hands by nationalising land, mines and industry
- To diversify the economy and develop an industrial and manufacturing sector
Implementation
- Replaced experienced and skilled foreigners with inexperienced locals
- Nationalisation of farmlands, industry and mining
Effects
- Lack of skilled Congolese technicians and managers made it difficult for industry to operate without foreign support.
- As a result the government was forced to re-privatise industry and mines
- Reversal of Zairianisation (retrocession)
- Failure to diversify the economy resulted in the Congo's on-going dependence on trading raw materials for manufactured goods as well as foreign aid and investment
- Foreign powers (USA and France) were unwilling to lose control of the rich mineral reserves in the Congo and continued economic support to the Congo
- The Congo failed to 'Africanise' economy and continued to rely heavily on aid and investment from its western allies such as the USA and France (neo-colonialism)
- Any other relevant answer
Africanisation in Tanzania: Ujamaa (Villagisation)
Aims
- African Socialism
- To replace foreigners with Tanzanian nationals in key positions and develop African leadership among its citizens through the Leadership Code
- To take Tanzania's means of production by nationalising industry and land
- Established 'collective' farms through the policy of Ujamaa to promote self sufficiency
- Nyerere wanted to avoid neo-colonialism so initially refused to take aid or assistance from foreign countries
Implementation
- Removed villagers and peasants from their original land to collective villages (ujamaa)
- Villagers opposed to the policy were forcefully removed
Effects
- Villagers resisted forced removals associated with the policy of Ujamaa
- Economy ceased to grow. Low production resulted in Tanzania suffering severe shortages of food and manufactured goods
- Growing dependence on foreign aid and loans after oil crisis of 1970s became more prevalent
- Tanzania was forced to take World Bank loans which led to debt and a dependency syndrome
- Tanzania remained one of the least developed countries in Africa
- Nyerere admitted that poverty could not be eliminated in Tanzania with existing world balance of economic power
- Any other relevant answer
Conclusion: Candidates should tie up their argument with a relevant conclusion
[50]
QUESTION 6: CIVIL SOCIETY PROTESTS FROM THE 1950s TO THE 1970s: BLACK POWER MOVEMENT
[Plan and construct an original argument based on relevant evidence using analytical and interpretative skills]
SYNOPSIS
Candidates are expected to refer to conditions of the African Americans before the 1960s and explain to what extent the ideas and actions of Malcolm X, Stokely Carmichael and the Black Panther Party gave African Americans a new sense of identity in the United States of America during the 1960s.
MAIN ASPECTS
Candidates should include the following aspects in their response:
- Introduction: Candidates should take a line of argument by indicating to what extent the ideas and actions of Malcolm X, Stokely Carmichael and the Black Panther Party gave African Americans a new sense of identity in the United States of America during the 1960s and indicate how they will answer the question.
ELABORATION
The situation in the USA before the 1960s
- Lack of political organisation for African Americans
- Lack of a strong cultural identity among African Americans
- Lack of a sense of pride due to socio-economic circumstances (Lived in ghettos and slum areas/poor housing/under-resourced facilities)
- Any other relevant response
Ideas and actions of:
Malcolm X
- An influential speaker and a dedicated human rights activist
- Believed in black separation, self-determination (black nationalism) and he advocated self-respect and self-discipline
- Promoted the concept of 'Black Pride' (self- esteem/self- respect/self - help)
- Encouraged African Americans to stand up against white American authorities in pursuit of freedom, justice and equality by whatever means possible
- Supported the use of violence as a means of self defence against those who attacked African Americans
- Any other relevant response
Stokely Carmichael
- Believed that non-violence was a strategy that was not working because of on going violence that was used by some white Americans against African Americans
- Advocated the principles of Black Power (do things for yourself; control politics in their communities; take pride in own culture and defend themselves against racial oppression and manipulation)
- Advocated the exclusion of white 'liberals' as a philosophy for African Americans
- In 1966 he popularised the Black Power slogan 'Black is Beautiful'
- Promoted African clothing/Afro hairstyles/music/literature/heritage as symbols of Black Pride
- Joined the Black Panther Party (for Self-Defence) which put into action the Black Power/Black Pride philosophy
- Any other relevant response
Black Panther Party:
Putting the ideas of the Black Power Movement into action
- Initiated and supported community based programmes/feeding schemes/anti poverty centres; focused on socio-economic conditions of African Americans and also operated community survival programmes
- Ten (10) point plan served as the Black Panther manifesto that covered its social, political and economic goals for the upliftment for African American community
- The Black Panther Party got involved in street patrols; monitored police activities and defended themselves against police brutality; by carrying guns (militant approach) to stop the on-going police brutality and harassment of young black men
- Any other relevant response
Conclusion: Candidates should tie up their argument with a relevant conclusion.
[50]
TOTAL: 150