
Adele
HISTORY PAPER 1 GRADE 12 ADDENDUM - NSC PAST PAPERS AND MEMOS NOVEMBER 2016
HISTORY
PAPER ONE (P1)
GRADE 12
NSC EXAM PAPERS AND MEMOS
NOVEMBER 2016
ADDENDUM
QUESTION 1: WHY DID THE UNITED STATES OF AMERICA GIVE FINANCIAL AID TO EUROPEAN COUNTRIES AFTER 1945?
SOURCE 1A
The extract below outlines why the European Recovery Programme was implemented in Europe after 1945.
In the aftermath (outcome) of World War II, Western Europe lay devastated. The war had ruined crop fields and destroyed infrastructure, leaving most of Europe in dire (desperate) need. On 5 June 1947 Secretary of State George Marshall announced the European Recovery Programme. To avoid antagonising (provoking) the Soviet Union, Marshall announced that the purpose of sending aid to Western Europe was completely humanitarian, and even offered aid to the communist states in the East. Congress approved Truman's request of 17 billion dollars over four years to be sent to Great Britain, France, West Germany, Italy, the Netherlands and Belgium. [From http://www.ushistory.org/us/52c.asp. |
SOURCE 1B
This source was written by an academic, Scott D Parrish, from the University of Texas in the United States of America. He analysed Evgenii Varga's (Soviet academic and economist) rejection of the Marshall Plan.
Varga put forward an economic explanation, arguing that 'the economic situation in the United States was the decisive (key) factor in putting forward the Marshall Plan proposal. The Marshall Plan is intended in the first instance to serve as a means of softening the expected economic crisis, the approach of which already no one in the United States denies'. Varga then went on to outline the dimensions (lengths) of the economic crisis, which he expected would soon overtake the United States. He anticipated a twenty per cent drop in production during this crisis, leading to the creation of a ten-million-man army of unemployed, and wreaking havoc (causing disaster) on the American banking system. As to the political effects of these economic difficulties, he concluded that 'the explosion of the economic and financial crisis will result in a significant drop in the foreign policy prestige (status) of the United States, which hopes to play the role of stabiliser of international capitalism'. [From https://www.wilsoncenter.org/sites/default/files/ACFB73.pdf. |
SOURCE 1C
This cartoon was published in the Krokodil, a Soviet magazine, in 1948. It depicts the effects of the Marshall Plan. 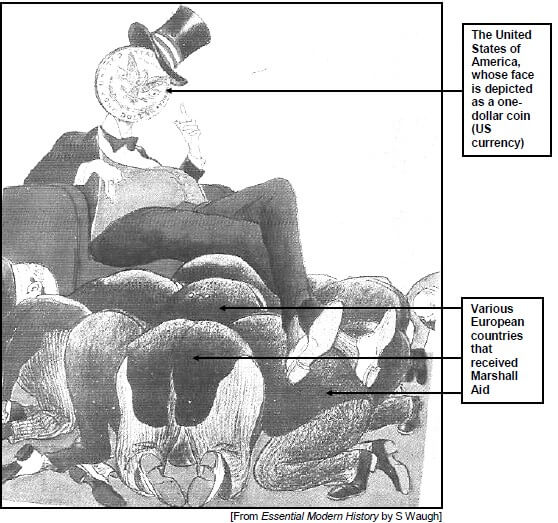
SOURCE 1D
This source was written by William R Keylor. He analyses the effects of the implementation of the Marshall Plan, both on Western European countries and the United States of America.
The economic consequences (results) of the Marshall Plan surpassed (were more than) the most optimistic expectations of its authors. By 1952, the termination date of the American aid programme, European industrial production had risen to 35 per cent and agricultural production to 10 per cent above the pre-war level. From the depths of economic despair the recipient nations of Western Europe embarked on a period of economic expansion that was to bring a degree of prosperity to their populations unimaginable (unbelievable) in the dark days of 1947. [From The Twentieth-Century World, An International History by WR Keylor] |
QUESTION 2: WHAT WERE THE CONSEQUENCES OF THE BATTLE OF CUITO CUANAVALE FOR SOUTHERN AFRICA?
SOURCE 2A
This source focuses on the opinions of historians Irina Filatova and Apollon Davidson, about the significance of the Battle of Cuito Cuanavale, which was fought in Angola between 1987 and 1988.
From the point of view of the Soviet military, the Angolans, Cubans, the post-apartheid South African government and many researchers, the Battle of Cuito Cuanavale was the turning point of the war, after which all the main goals of the war were achieved: South Africa had to withdraw its troops, Angola achieved relative peace and Namibia its independence. From the point of view of the South African military, there never was a 'Battle of Cuito Cuanavale', because, according to General J Geldenhuys, 'it had no strategic significance whatsoever. It played no role at all from whatever angle you look at it'. In fact, 'the Soviet alliance lost, because it did not manage to crush Savimbi and to demolish his capital, Jamba …'. [From The Hidden Thread. Russia and South Africa in the Soviet Era by I Filatova and A Davidson] |
SOURCE 2B
The extract below is taken from a speech by Fidel Castro (leader of Cuba) at a rally that was attended by thousands of people in Havana on 5 December 1988. Castro defended the involvement of Cuban troops in the Battle of Cuito Cuanavale.
The Angolan government had assigned us (Cuba) the responsibility of defending Cuito Cuanavale, and all necessary measures were taken not only to stop the South Africans, but to turn Cuito Cuanavale into a trap, a trap the South Africans ran into. In Cuito Cuanavale the South African army really broke their teeth (lost its power) … [From In Defence of Socialism: Four Speeches on the 30th Anniversary of the Cuban Revolution by F Castro] |
SOURCE 2C
This source by Christopher Saunders explains the role that the superpowers played in ensuring that the Angola/Namibia Accords (New York Accords) were signed. The Accords were signed by Cuba, Angola and South Africa at the United Nations headquarters in New York on 22 December 1988.
As Crocker (Assistant Secretary of African Affairs in the United States of America) had successfully argued over months would be the case, the final agreement provided something for each party involved … In the way the crisis was resolved, the two superpowers worked more closely together than ever, especially in the Joint Monitoring Commission that was established to ensure that the agreements were held to. [From Cold War in Southern Africa. White Power and Black Liberation, edited by S Onslow] |
SOURCE 2D
This photograph shows various leaders signing the New York Accords at the United Nations Headquarters in New York on 22 December 1988.
Seated from left to right are: Magnus Malan, Minister of Defence (South Africa), Roelof Frederik ('Pik') Botha, Minister of Foreign Affairs (South Africa), Javier Pérez de Cuéllar, Secretary General of the UN, George Shultz, Secretary of State (United States of America), Alfonso Van-Dunem, Minister of Foreign Affairs (Angola), António dos Santos Franҫa (Angolan representative), Isidoro Malmierca Peoli, Minister of Foreign Affairs (Cuba) and General Abelardo Colomé Ibarra (Cuba). 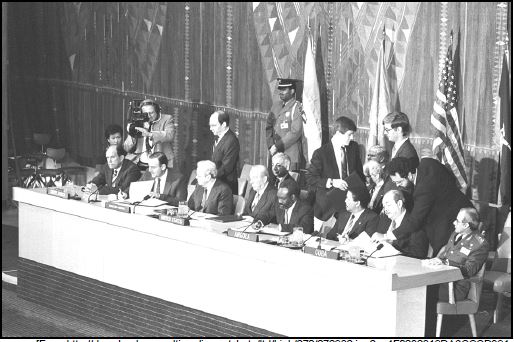
[From http://downloads.unmultimedia.org/photo/ltd/high/272/272982.jpg?s=4F0232819DA6CCCD391 EC97A2A1B59BD&save.
Accessed on 25 October 2015.]
QUESTION 3: WHAT CHALLENGES DID THE LITTLE ROCK NINE FACE DURING THE INTEGRATION OF CENTRAL HIGH SCHOOL IN 1957?
SOURCE 3A
This source focuses on the processes that occurred before the Little Rock Nine could enrol at Central High School in 1957.
… by the summer of 1957, school officials had selected 17 African-American students from over 200 applicants for enrolment at Central High School. School officials rejected many applicants because their grades were not high enough. Others were rejected because officials did not think they could handle the pressure of being a small minority in a school that was overwhelmingly white … Still other African students dropped out on their own after the superintendent told them that they would not be allowed to participate in sports or any other extracurricular activity. As resistance to integration became more vocal in the summer of 1957 in Little Rock and elsewhere, a number of parents withdrew their children out of fear for their safety. [From https://www.facinghistory.org/sites/default/files/publications/Choices_Little_Rock.pdf. |
SOURCE 3B
This source focuses on Elizabeth Eckford's experiences on 4 September 1957, her first day at Central High School.
The first scene Eckford saw when she got off the bus a block from Central High School was a sea of angry faces. She tried to walk to the school, but a jeering (mocking) mob blocked her path. All alone, her knees shaking, she pushed through the mob. She was trying hard not to show her fright. 'It was the longest block I ever walked in my whole life,' she said later. Eckford was one of nine students who had volunteered to be among the first African Americans to attend Central High School. When she left for school that morning, Eckford thought there might be trouble. But she didn't know that she would see hundreds of angry white people who had been waiting for her since early morning. Suddenly a shout went through the crowd. Elizabeth Eckford was attempting to enter the school. [From http://www.ahsd.org/social_studies/williamsm/The%20Mob%20at%20Central%20High%20School.pdf. |
*Nigger: A derogatory (offensive) term used to refer to African Americans
SOURCE 3C
This photograph shows Elizabeth Eckford at the bus stop outside Central High School, surrounded by a mob of white American segregationists. Grace Lorch, a member of the local National Association for the Advancement of Coloured People (NAACP), is seen with her arm around Elizabeth Eckford. 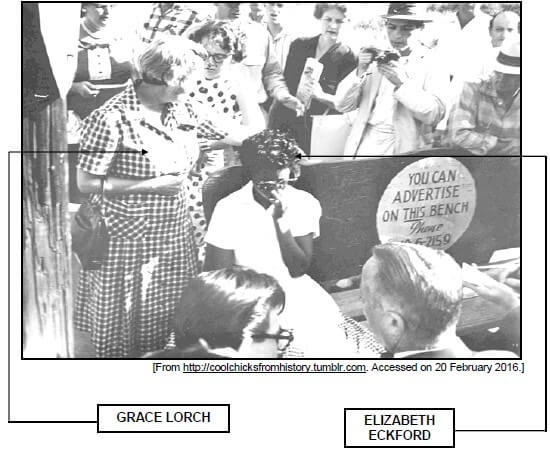
[From http://coolchicksfromhistory.tumblr.com. Accessed on 20 February 2016.]
SOURCE 3D
This extract focuses on events that occurred at the house of Daisy Bates on 5 September 1957. It was after the Little Rock Nine were prevented from entering Central High School the previous day.
… The Nine gathered at the Bates home. It was the first time Elizabeth had ever met Daisy Bates. Segregationists, reporters and Faubus were to accuse her of sending Elizabeth into the mob deliberately, to garner (gather) sympathetic publicity. Now Elizabeth let her have it, too. 'Why did you forget me?' she asked, with what Bates, who died in 1999, later called 'cold hatred in her eyes'. To this day Elizabeth believes that Bates, now lionised (praised) by everyone (a major street near Central High School has been named after her), saw the black students as little more than foot soldiers in a cause, and left them woefully unprepared for their ordeal. [From http://www.vanityfair.com/news/2007/09/littlerock200709. |
ACKNOWLEDGEMENTS
Visual sources and other historical evidence were taken from the following:
Castro, F. 1989. In Defence of Socialism: Four Speeches on the 30th Anniversary of the Cuban Revolution (Pathfinder, 1989)
Filatova I and Davidson A. 2013. The Hidden Thread. Russia and South Africa in the Soviet Era (Jonathan Ball, Cape Town)
http://coolchicksfromhistory.tumblr.com
http://downloads.unmultimedia.org/photo/ltd/high/272/272982.jpg?s=4F0232819DA6CCC D391 EC97A2A1B59BD&save
http://www.ahsd.org/social_studies/williamsm/The%20Mob%20at%20Central%20High%2 0School.pdf
http://www.ushistory.org/us/52c.asp
http://www.vanityfair.com/news/2007/09/littlerock200709
https://www.facinghistory.org/sites/default/files/publications/Choices_Little_Rock.pdf
https://www.wilsoncenter.org/sites/default/files/ACFB73.pdf
Keylor, WR. 1984. The Twentieth-Century World – An International History (Oxford University Press, New York)
Onslow (ed.). Cold War in Southern Africa. White Power and Black Liberation (Routledge, London)
Waugh, S. 1988. Essential Modern History (Oxford University Press, Harlow)
HISTORY PAPER 2 GRADE 12 ADDENDUM - NSC PAST PAPERS AND MEMOS NOVEMBER 2016
HISTORY
PAPER TWO (P2)
GRADE 12
NSC EXAM PAPERS AND MEMOS
NOVEMBER 2016
ADDENDUM
QUESTION 1: HOW DID THE PHILOSOPHY OF BLACK CONSCIOUSNESS INFLUENCE THE SOWETO UPRISING OF 1976?
SOURCE 1A
The source below is part of an article entitled 'The June 16 Uprising Unshackled: A Black Perspective' by Nelvis Qekema. It focuses on how the philosophy of Black Consciousness influenced black South African learners to challenge the use of the Afrikaans language as a medium of instruction.
… The Black Consciousness message was simple, 'Black man, you are on your own.' We had nothing to beg from our oppressors. Biko even introduced a practical disincentive (warning): 'Any black man who calls a white man "baas" is a non-white.' [From http://azapo.org.za/the-june-16-uprising-ushackled-a-black perspective/. Accessed on 05 May 2016.] |
SOURCE 1B
The source below is part of an eyewitness account of how events unfolded on 16 June 1976. This source was written by H Mashabela.
Earlier that day, Soweto schoolchildren had risen up against white authority and marched through Vilakazi Street alongside Phefeni Junior Secondary School and Orlando West High School in Soweto. The children had over the years witnessed the creation of urban Bantu councils, tribal schools and ethnic school boards by the country's white rulers and now Afrikaans was being imposed as a medium of instruction in the teaching of Mathematics, History and Geography. [From A People On The Boil by H Mashabela] |
SOURCE 1C
The photograph below was taken by photojournalist Sam Nzima. It shows Mbuyisa Makhubu carrying a dead Hector Pieterson, who was shot by the apartheid police force on 16 June 1976 in Soweto. On the left-hand side of the photograph is Hector Pieterson's sister, Antoinette. 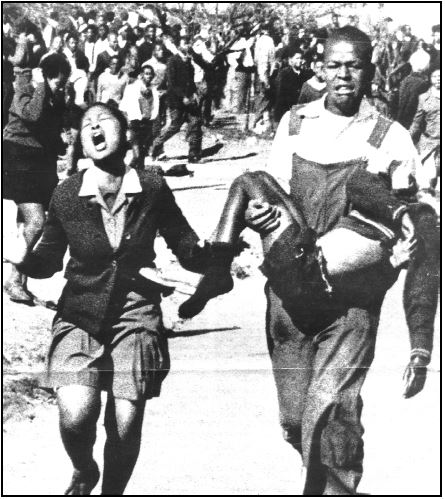
SOURCE 1D [From http://rebeccafjellanddavis.com/june16/youth-day-in-south-africa. Accessed on 27 April 2016.]
This source focuses on how the apartheid government responded to the Soweto uprising of June 1976.
The next day (17 June 1976) the government closed down the schools and put the South African military on alert. The Deputy Minister of Bantu Affairs, Andries Treurnicht (nicknamed 'Dr No'), announced: 'In the white areas of South Africa [including Soweto], where the government erects the buildings, grants the subsidies and pays the teachers, it is our right to decide on language policy.' [From The Rise and Fall of Apartheid by LC Clark et al.] |
QUESTION 2: WAS THE TRUTH AND RECONCILIATION COMMISSION (TRC) SUCCESSFUL IN DEALING WITH THE INJUSTICES OF THE PAST?
SOURCE 2A
This source focuses on the role that the Truth and Reconciliation Commission (TRC) played in attempting to establish the reasons for the disappearance of anti-apartheid activist, Nokuthula Simelane.
… After the fall of apartheid, the Truth and Reconciliation Commission (TRC) was instituted (established) as a way of bridging the divide (gap) between the oppressive National Party and the democratic South Africa … [From www.sahistory.org.za/people/nokuthula-orela-simelane. |
SOURCE 2B
The cartoon below by Zapiro portrays Desmond Tutu and Alex Borraine leading the TRC up Mount Evidence. 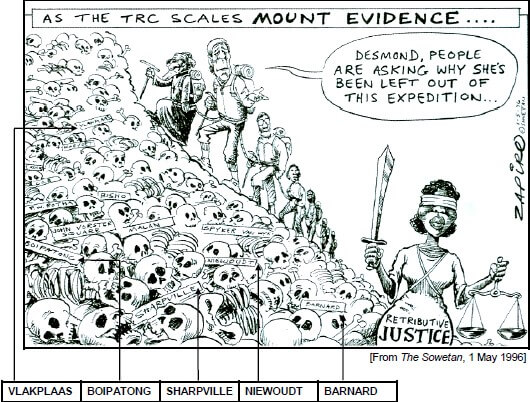
SOURCE 2C
The article below appeared in The Times on 11 February 2016. It was entitled 'Where is my baby's grave?'.
For Ernestina Simelane it's now or never. She hopes that a murder trial will reveal what happened to her daughter, who disappeared 33 years ago on 26 February. She will face the apartheid security branch policemen, Willem Helm Johannes Coetzee, Anton Pretorius, Frederick Barnard Mong and Msebenzi Timothy 'Vastrap' Radebe – who kidnapped Nokuthula Simelane and, the state believes, tortured and murdered the 23-year-old ANC courier. [From The Times, 11 February 2016] |
SOURCE 2D
The extract below focuses on Desmond Tutu's response to the National Prosecuting Authority's (NPA) decision to prosecute the alleged perpetrators in Nokuthula Simelane's murder.
Meanwhile Emeritus Archbishop Desmond Tutu has welcomed the NPA's decision to prosecute Simelane's alleged killers. [From http://www.tutu.org.za. Accessed on 27 February 2016.] |
QUESTION 3: HOW DID THE IMPLEMENTATION OF STRUCTURAL ADJUSTMENT PROGRAMMES (SAPs) BY INTERNATIONAL FINANCIAL INSTITUTIONS AFFECT AFRICAN COUNTRIES?
SOURCE 3A
This source is part of an article by A Ismi entitled 'Impoverishing a Continent: The World Bank and International Monetary Fund in Africa'. It focuses on how African countries became dependent on structural adjustment programmes that were made available by the World Bank and International Monetary Fund (IMF).
The debt crisis in the 1980s gave Washington the opportunity to 'blast open' and fully subordinate (suppress) Third World economies through World Bank and International Monetary Fund (IMF) structural adjustment programmes. Starting in 1980, developing countries were unable to pay back loans taken from Western commercial (profitable) banks which had gone on a huge lending binge (spree) to Third World governments during the mid to late 1970s when rising oil prices had filled up their coffers with petro-dollars. [From http://www.halifaxinitiative.org/updir/ImpoverishingAContinent.pdf. |
SOURCE 3B
This source is part of an interview entitled A View From Inside: The World Bank, conducted by Monte Leach, editor of Share International, with Ismail Serageldin, vice-president for Environmentally Sustainable Development at the World Bank. The interview focused on the controversy regarding structural adjustment programmes.
Monte Leach: One of the most controversial areas of involvement for the bank has been its structural adjustment programmes. Some people argue they hurt the poor by forcing governments to reduce or eliminate subsidies for basic goods in exchange for getting World Bank loans. Is that something that the bank is involved with? Ismail Serageldin: Sure. But let me backtrack (to explain the background) a bit. The bank is a co-operative (co-worker) of member states. If I have a member state who is in a deep mess, which is usually the case, they don't come for structural adjustment on a pre-emptive (preventive) basis … Monte Leach: Are you saying that structural adjustment programmes don't necessarily have to be a bad thing, that it depends on how they're implemented? Ismail Serageldin: Exactly. There is a lot of difference in the manner in which you do adjustments. [From http://www.shareintl.org/archives/economics/ec_mlview_wb.htm. |
SOURCE 3C
This source is an extract from an article by R Naiman and N Watkins entitled 'Has Africa "Turned the Corner" in Recent Years?'. It focuses on the impact that structural adjustment programmes had on Africa.
In 1998, the International Monetary Fund (IMF) released a series of publications and public statements claiming credit for an 'African economic renaissance' (revival) and 'a turnaround in growth performance'. The claim from the IMF and World Bank is that structural adjustment is beginning to pay off, at least in microeconomic terms. But examining just-released growth projections by the World Bank, one discovers that the 'growth turnabout' has been short-lived. According to the World Bank, real gross domestic product (GDP) per capita grew by 1,4% in 1996, but by 1997 growth slowed to 0,4% and in 1998 per capita incomes fell by 0,8%. The World Bank projects a further decline of 0,4% in 1999. In short, if there was an 'economic renaissance' for Africa it appears to be over … [From http://www.cerpr.net/documents/publications/debt 1999 04.htm. |
SOURCE 3D
This cartoon appeared in Eritrean News and was entitled 'How the World Bank and International Monetary Fund Destroy Africa'. The cartoonist and date of publication is unknown. 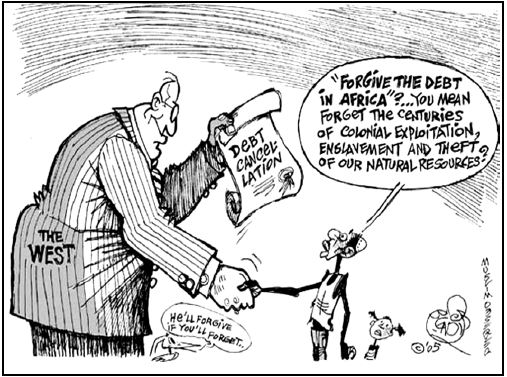
[From http://www.tesfanews.net/how-the-world-bank-and-the-imf-destroy-africa/. Accessed on 10 October 2015.]
ACKNOWLEDGEMENTS
Visual sources and other historical evidence were taken from the following:
Mashabela, H. 2006. A People on the Boil: Reflections on June 16, 1976 and Beyond (Jacana Media)
http://azapo.org.za/the-june-16-uprising-ushackled-a-black-perspective/
http://rebeccafjellanddavis.com/june16/youth-day-in-south-africa
http://www.cerpr.net/documents/publications/debt 1999 04.htm
http://www.halifaxinitiative.org/updir/ImpoverishingAContinent.pdf
http://www.shareintl.org/archives/economics/ec_mlview_wb.htm
http://www.tesfanews.net/how-the-world-bank-and-the-imf-destroy-africa/ http://www.tutu.org.za
Clark, LC et al. 2004. The Rise and Fall of Apartheid (Pearson Education) The Sowetan, 1 May 1996
The Times, 11 February 2016
www.sahistory.org.za/people/nokuthula-orela-simelane
GRADE 12 MATHEMATICAL LITERACY PAPER 2 ADDENDUM - NSC PAST PAPERS AND MEMOS NOVEMBER 2016
GRADE 12 MATHEMATICAL LITERACY
PAPER TWO (P2)
NSC EXAM PAPERS AND MEMOS
NOVEMBER 2016
ADDENDUM
ANNEXURE A
QUESTION 2.1
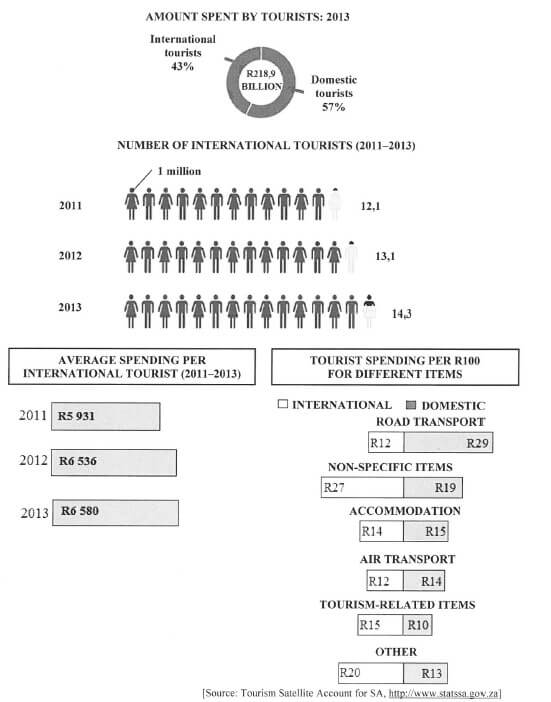
GRAPHICAL REPRESENTATION OF TOURIST SPENDING IN SOUTH AFRICA IN 2013
ANNEXURE B
QUESTION 2.2
| Johannesburg to East London = 992 Km | ||
| RAILWAY STATION | ARRIVAL | DEPARTURE |
| Johannesburg to ......... 17:30 day 1 | ||
| Germiston | 17:53 day 1 | 17:58 day 1 |
| Vereeniging | 19:00 day 1 | 19: 20 day 1 |
| Salsolburg | 19:43 day 1 | 19:48 day 1 |
| Koppies | 20:34 day 1 | 20:36 day 1 |
| Kroonstad | 21:42 day 1 | 21:50 day 1 |
| Hennenman | 22:26 day 1 | 22:28 day 1 |
| Virginia | 22:44 day 1 | 22:46 day 1 |
| Theunissen | 23:14 day 1 | 23:16 day 1 |
| Bloemfontein | 00:32 day 2 | 00:55 day 2 |
| Springfontein | 03: 49 day 2 | 04:15 day 2 |
| Bethulie | 05:00 day 2 | 05:03 day 2 |
| Burgersdrop | 06:17 day 2 | 06:34 day 2 |
| Molteno | 07:25 day 2 | 07:28 day 2 |
| Queenstown | 08:58 day 2 | 09:12 day 2 |
| Stutterheim | 11:43 day 2 | 11:46 day 2 |
| Berlin | 12:39 day 2 | 12:42 day 2 |
| East London | 13: 24 day 2 | |
| ADULT SINGLE FARE | ||||
| MONTHS | JANUARY | FEBRUARY | MARCH | APRIL |
| FARES | R560 | R490 | R490 | R490 |
[Adapted from: www.southafricanrailways.co.za]
NOTE:
- Peak season: Novemeber to January
- Children aged 3 to 5
- 50% of adult fare during off-peak season
- 80% of adult fare during peak season
- South African senior citizens (55+ years) qaulify for a 25% discoun
ANNEXURE C
QUESTION 3.2
RECORDS OF ATTENDANCE FOR THREE GROUPS OVER A PERIOD OF 18 DAYS (D1-D18)
| MORNING GROUP (M) | |||||||||||||||||
| D1 | D2 | D3 | D4 | D5 | D6 | D7 | D8 | D9 | D10 | D11 | D12 | D13 | D14 | D15 | D16 | D17 | D18 |
| 20 | 18 | 9 | 10 | 12 | 3 | 15 | 15 | 14 | 8 | 18 | x | 19 | 20 | 17 | x | 20 | 18 |
| AFTERNOON GROUP (A) | |||||||||||||||||
| D1 | D2 | D3 | D4 | D5 | D6 | D7 | D8 | D9 | D10 | D11 | D12 | D13 | D14 | D15 | D16 | D17 | D18 |
| 14 | 12 | 20 | 20 | 16 | 15 | 19 | 20 | 18 | 20 | 19 | 15 | 20 | 11 | 18 | 12 | 20 | 19 |
| EVENING GROUP (E) | |||||||||||||||||
| D1 | D2 | D3 | D4 | D5 | D6 | D7 | D8 | D9 | D10 | D11 | D12 | D13 | D14 | D15 | D16 | D17 | D18 |
| 8 | 7 | 8 | 6 | 8 | 6 | 7 | 8 | 8 | 6 | 6 | 7 | 8 | 8 | 8 | 8 | 7 | 8 |
[source: ww.emorycommunityswimming.com]
BOX AND WHISKER PLOTS REPRESENTING ATTENDAB=NCE FOR MORNING AND AFTERNOON GROUPS OVER A PERIOD OF 18 DAYS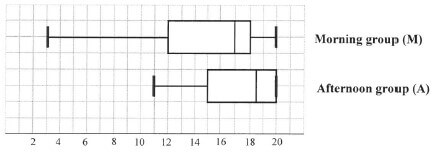
ANNEXURE D
QUESTION 4.2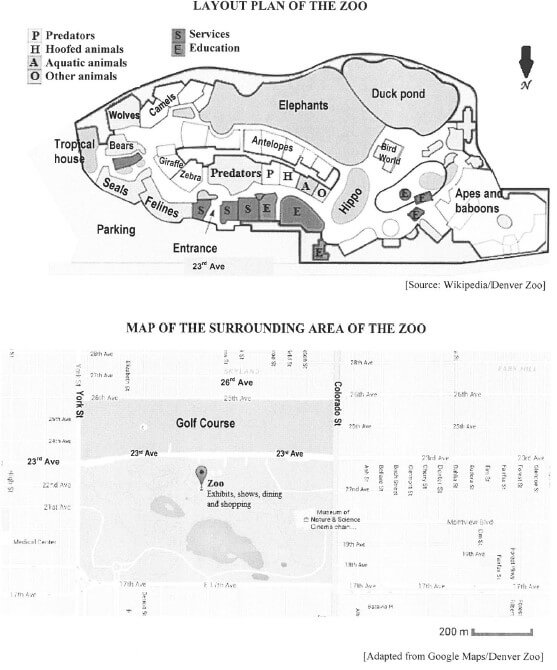
GRADE 12 MATHEMATICAL LITERACY PAPER 1 ADDENDUM - NSC PAST PAPERS AND MEMOS NOVEMBER 2016
GRADE 12 MATHEMATICAL LITERACY
PAPER ONE (P1)
NSC EXAM PAPERS AND MEMOS
NOVEMBER 2016
ADDENDUM
ANNEXURE A
QUESTION 1.1
BOOYSEN M | Bank Home Loans | |||
Home Loan Statement as on 22 March 2014 | ||||
Bonded property: | ACCOUNT SUMMARY | |||
Loan Details | ||||
Registered bond amount | R | 466 000,00Dr | ||
Balance outstanding | R | 378 123,87Dr | ||
Insured value of property | R | 1 185 627,28 | ||
Term of loan | ||||
Remaining loan term | 12 years 4 months | |||
Loan end date … | ||||
Interest rate | ||||
Current interest rate | 7,25% | |||
Monthly repayment breakdown | ||||
Basic repayment | R | 3 842,45Dr | ||
House insurance premiums | R | 454,37Dr | ||
Administration fee (including VAT) | R | 5,70Dr | ||
Total repayment | R | 4 302,52Dr | ||
Notice: Unpaid debit orders dated 1 October 2013 | ||||
Home Loan Transaction History from 22 September 2013 to 22 March 2014 | ||||
Transaction date | Description | Debits | Credits | Balance |
22 Sep 2013 | Opening balance | 385 127,06 | 385 127,06Dr | |
01 Oct 2013 | Interest | 2 137,43 | 387 264,49Dr | |
01 Oct 2013 | #Monthly administration fee | 5,70 | 387 270,19Dr | |
01 Oct 2013 | Debit order | 4 111,06 | 383 159,13Dr | |
01 Oct 2013 | Unpaid debit order | 4 111,06 | 387 270,19Dr | |
02 Oct 2013 | Debit order | 4 111,06 | 383 159,13Dr | |
14 Oct 2013 | Adjustment | 383 158,37Dr | ||
28 Oct 2013 | House owner's insurance | 5 275,04 | 388 433,41Dr | |
01 Nov 2013 | Interest | 2 201,26 | 390 634,67Dr | |
01 Nov 2013 | #Monthly administration fee | 5,70 | 390 640,37Dr | |
01 Nov 2013 | Debit order | 4 200,42 | 386 439,95Dr | |
01 Dec 2013 | Interest | 2 143,95 | 388 583,90Dr | |
02 Dec 2013 | #Monthly administration fee | 5,70 | 388 589,60Dr | |
02 Dec 2013 | Debit order | 4 200,42 | 384 389,18Dr | |
01 Jan 2014 | Interest | 2 204,43 | 386 593,61Dr | |
02 Jan 2014 | # Monthly administration fee | 5,70 | 386 599,31Dr | |
02 Jan 2014 | Debit order | 4 200,42 | 382 398,89Dr | |
01 Feb 2014 | Interest | 2 203,50 | 384 602,39Dr | |
01 Feb 2014 | #Monthly administration fee | 5,70 | 384 608,09Dr | |
01 Feb 2014 | Debit order | 4 302,52 | 380 305,57Dr | |
01 Mar 2014 | Interest | 2 115,12 | 382 420,69Dr | |
01 Mar 2014 | #Monthly administration fee | 5,70 | 382 426,39Dr | |
01 Mar 2014 | Debit order | 4 302,52 | 378 123,87Dr | |
22 Mar 2014 | Closing balance | 378 123,87Dr | ||
ANNEXURE B
QUESTION 3.1
SEATING PLAN OF AN OPEN-AIR ARENA WITH 432 SEATS 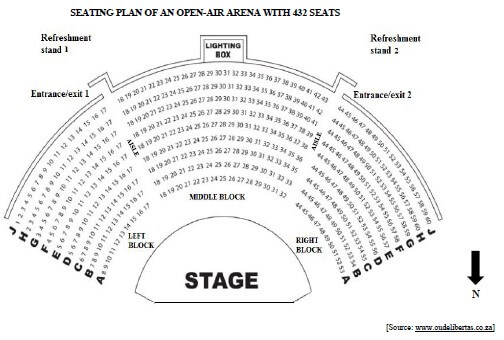
ANNEXURE C
QUESTION 3.2
ASSEMBLY DIAGRAMS FOR A FLOOR LAMP 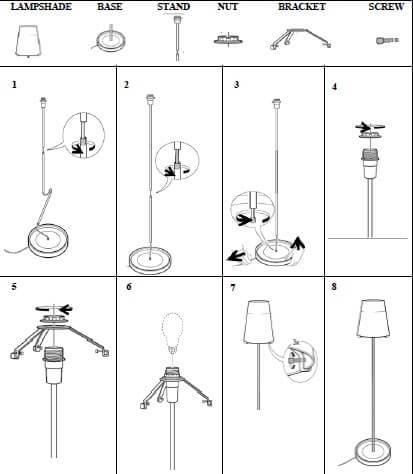
ANNEXURE D
QUESTION 5
TABLE 4: AVERAGE LOCAL PRICE OF A BIG MAC BURGER AND A 2-LITRE COLA WITH EXCHANGE RATES AS ON 30 APRIL 2016
COUNTRY | EXCHANGE RATES | 2 ℓ COLA | BIG MAC BURGER | BIG MAC BURGER |
South Africa | R16 | R50 | R50 | |
Brazil | 1 Brazilian real equals 4,14 South African rand | R$ 5,81 | R$ 23 | R95,22 |
China | 1 South African rand equals 0,46 Chinese yuan | ¥ 7 | ¥ 32 | R69,57 |
Egypt | 1 Egyptian pound equals 1,60 South African rand | E£ 8 | E£ 39 | R62,40 |
India | B | ₨ 74 | ₨ 267 | R56,07 |
Germany | 1 euro equals 16,28 South African rand | € 1,68 | A | R113,96 |
New Zealand | 1 New Zealand dollar equals 9,93 South African rand | NZ$ 3,40 | NZ$10 | R99,30 |
Singapore | 1 South African rand equals 0,095 Singaporean dollar | SGD $ 2,50 | SGD $ 8,00 | R84,21 |
United Arab Emirates | 1 United Arab Emirates dirham equals 3,87 rand | Dh 4,82 | Dh 24 | R92,88 |
United Kingdom | 1 South African rand equals 0,048 British pound | £ 1,80 | £ 5,70 | R118,75 |
United States of America | 1 South African rand equals 0,070 US dollar | $ 1,94 | $ 6,69 | R95,57 |
[Source: www.expatistan.com> cost of living]
GRADE 12 MATHEMATICAL LITERACY PAPER 1 QUESTIONS - NSC PAST PAPERS AND MEMOS NOVEMBER 2016
GRADE 12 MATHEMATICAL LITERACY
PAPER ONE (P1)
NSC EXAM PAPERS AND MEMOS
NOVEMBER 2016
INSTRUCTIONS AND INFORMATION
- This question paper consists of FIVE questions. Answer ALL the questions.
-
- Use the ANNEXURES in the ADDENDUM to answer the following questions:
ANNEXURE A for QUESTION 1.1
ANNEXURE B for QUESTION 3.1
ANNEXURE C for QUESTION 3.2
ANNEXURE D for QUESTION 5 - Answer QUESTION 1.2.4(a) on the attached ANSWER SHEET 1.
Answer QUESTION 4.2.6 on the attached ANSWER SHEET 2. - Write your centre number and examination number in the spaces on the ANSWER SHEETS. Hand in the ANSWER SHEETS with your ANSWER BOOK.
- Use the ANNEXURES in the ADDENDUM to answer the following questions:
- Number the answers correctly according to the numbering system used in this question paper.
- Start EACH question on a NEW page.
- You may use an approved calculator (non-programmable and non-graphical), unless stated otherwise,
- Show ALL calculations clearly.
- Round off ALL final answers appropriately according to the given context, unless stated otherwise.
- Indicate units of measurement, where applicable.
- Maps and diagrams are NOT necessarily drawn to scale, unless stated otherwise.
- Write neatly and legibly.
QUESTIONS
QUESTION 1
1.1
| ANNEXURE A shows a home loan statement and transaction history for the period 22 September 2013 to 22 March 2014. NOTE:
|
Use ANNEXURE A to answer the questions that follow.
1.1.1 Give the name of the borrower.
1.1.2 State the end date (month and year) of the loan. (2)
1.1.3 Calculate the difference between the insured value of the property and the registered bond amount. (2)
1.1.4 Determine the total administration fee payable for the whole loan period. (3)
1.1.5 On 30 January 2014 the interest rate was decreased by 0,5%.
Find the interest rate used before 30 January 2014. (2)
1.1.6 Calculate the VAT amount that is included in the monthly administration fee. (3)
1.1.7 Explain the term home loan. (2)
1.1.8 Choose ONE of the following statements that correctly explains why the interest amounts charged for February and March are different: (2)
- The interest rate changed.
- Interest is charged on the daily outstanding balance.
- The amount of interest decreases monthly. (2)
1.1.9 Due to a bank error the debit order was unpaid on 1 October 2013. The debit order was paid on 2 October 2013. The bank rectified the error by making an adjustment, as shown in the statement.
- Calculate the adjustment amount. (2)
- Hence, state whether this adjustment amount should be reflected as a debit or a credit. (2)
1.1.10 Calculate the amount of interest due on 1 April 2014 to be shown on the next statement. (3)
You may use the formula:
Interest = B × n × r where
365
B = balance on 1% of the previous month
n= the number of days in the month
r= the interest rate
1.2
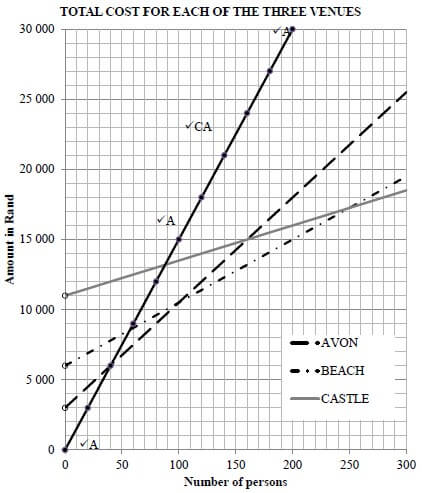
| Khumu is planning an event to raise funds for needy learners. Part of her plan is to find a suitable venue for about 200 to 300 people. She obtains quotations from three different service providers. Each venue had a fixed rental cost as well as a variable cost per person. TABLE 1: VENUE COSTING STRUCTURE
|
Use the information in the table above and the graphs on ANSWER SHEET 1 to answer the questions that follow.
1.2.1 Explain the term variable cost in this context. (2)
1.2.2 Calculate the exact total cost of renting the Beach Hotel venue for 230 people.
You may use the following formula:
Total cost (in rand) = fixed cost + 230 x variable cost (3)
1.2.3 Determine:
- The cheapest venue if only 90 persons attend the event (2)
- The maximum number of people that can attend the event if the total cost of the venue is R15 000 (2)
1.2.4 Khumu sells the tickets for R150 each.
- Draw the income graph from the sale of up to 200 tickets on the same grid as the total cost graphs on ANSWER SHEET 1. (4)
- Calculate the total profit to be made if she rents the Castle venue and pays for 250 people, but sells only 194 tickets. (5)
[43]
QUESTION 2
2.1
Kataryna is planning a fashion show and intends using the school hall for the event. The hall has a stage and she plans to have a raised T-shaped platform, called a runway, erected in front of the stage, as shown in the diagrams below. 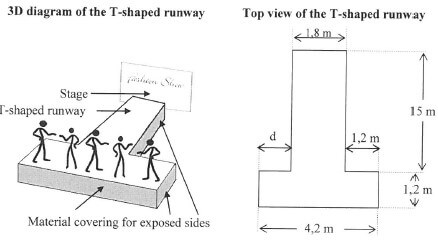 The SEVEN exposed rectangular sides of the T-shaped runway will be covered with material. The top of the runway will be carpeted. The total length of the runway is equal to į of the length of the hall. [Adapted from www.jerichostage.com] |
2.1.1 Calculate:
- The missing value d (in mm) (3)
- The total length (in mm) of the exposed sides of the runway (3)
The area (in m2) of the runway that needs to be covered with carpet (4)
You may use the following formula:
Area of a rectangle = length x width - The length (in m) of the hall (3)
2.1.2 Harry, a British model, wants to know the measurement (in feet) of the front end of the runway. (3)
Convert 4,2 m to feet, rounded off to one decimal place.
NOTE: 1 foot = 0,3048 m
2.2
The organisers of the fashion show decide to hand out chocolates to the audience at the entrance. The pictures and diagrams below show the two different containers in which the chocolates will be packed. 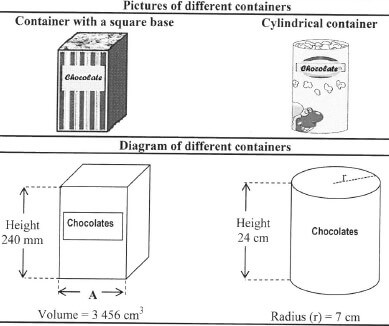 |
2.2.1 Determine A, the length (in cm) of ONE side of the square base. You may use the following formula:
Volume of box with square base = (side)2 x height (4)
2.2.2 The organisers of the fashion show want to use their own label around the outer curved side of the cylindrical container. The label will be 1 cm longer than the circumference of the circular base to allow for an overlap.
Determine the total area (to the nearest cm2) of all the labels that will be required for 76 cylindrical containers. (4)
You may use the following formula:
Area of one label (in cm2) = (1 + 2π × r ] × height
using π = 3,142
2.2.3 Show, with calculations, that the volume of the cylindrical container is 238,99 cm3 more than the volume of the container with the square base. (3)
You may use the following formula:
Volume of cylinder = π × r2 x height
using π = 3,142
2.2.4 State the most appropriate metric unit of measure for the mass of a container of chocolates. (2)
[29]
QUESTION 3
3.1
| Rahim's favourite band is performing at an open-air arena. The seating plan of the arena is shown in ANNEXURE B. |
Use ANNEXURE B to answer the questions that follow.
3.1.1 Determine the total number of seats available in the middle block. (3)
3.1.2 Give the compass direction from seat E12 towards the stage. (2)
3.1.3 Rahim is seated exactly in the middle of a row in the middle block. The row he is seated in has an odd number of seats and is furthest from the stage. Name the row and seat number where he is seated. (3)
3.1.4 Mali is seated at D14. She decides to go to the refreshment stand which is directly east of the lighting box. Give the directions for the route from her seat to the refreshment stand. (4)
3.1.5 Determine the probability of randomly choosing a spectator to join the band on the stage if 871% of all the seats in the arena are occupied. (3)
3.1.6 It is predicted that it is most unlikely that it will rain on the night of the performance. Choose ONE of the values below that best describes this probability:
1,0 ½ 0,0 40% 3/5 0,8 20% (2)
3.2 ANNEXURE C shows the assembly diagrams for a floor lamp.
Use ANNEXURE C to answer the questions that follow.
3.2.1 Refer to DIAGRAM 4.
- Must the nut be screwed or unscrewed? (2)
- Give the direction in which the nut should be turned. (2)
3.2.2 How many screws are needed to assemble the lamp shade? (2)
3.2.3 Which diagram is associated with the instruction: 'Join the stand to the base."? (2)
3.2.4 The total height of the floor lamp in the picture is 62 mm.
Determine the actual height (in m) of the floor lamp if the scale of the diagram is 1 : 30. (3)
[28]
QUESTION 4
4.1
The motorcycle land-speed record is the fastest speed achieved by a motorcyclist on land. TABLE 2: MOTORCYCLE LAND-SPEED RECORDS IN MILES PER HOUR
[Adapted from Wikipedia/Landspeedrecords] |
Use TABLE 2 to answer the questions that follow.
4.1.1 Determine the difference between the highest and lowest land-speed records that were set between 1950 and 2000. (3)
4.1.2 Determine the number of riders that set new land-speed records from 1930 to 2010. (2)
4.1.3 Identify the TWO years during which the land-speed record remained unbroken for the longest time AND also state the number of years the record remained unbroken. (3)
4.1.4 Name the rider that held the land-speed record the most number of times AND also state how many times this rider held the record. (3)
4.1.5 Determine the probability (as a percentage) of randomly selecting a land speed record in TABLE 2 that was set during the 219 century. (3)
4.2
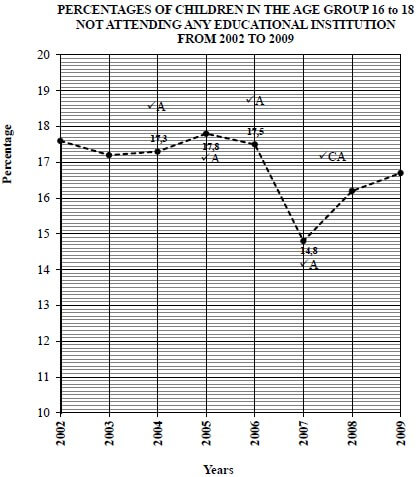
TABLE 3 below shows the numbers and percentages of children from three age groups who did not attend any South African educational institution from 2002 to 2009.
[Adapted from www.statssa.co.za | |||||||||||||||||||||||||||||||||||||||||||||||||||||||||||||||||||||||||||
Use TABLE 3 to answer the questions that follow.
4.2.1 State why the data for the number of children is regarded as discrete data. (2)
4.2.2 Identify the age group where the majority of children did not attend any educational institution. (2)
4.2.3 Give the year during which the age group 16 to 18 showed the best attendance. (2)
4.2.4 Determine the missing value A. (2)
4.2.5 Determine the missing value B, if the total number of children in that age group was 9 281 000 in 2008. (3)
4.2.6 Draw a broken line graph on ANSWER SHEET 2 to represent the percentage of children in the age group 16 to 18 not attending any educational institution from 2002 to 2009 (5)
[30]
QUESTION 5
| One of the ways to compare the purchasing power of one country's currency to another country's currency is to compare the local price of common items that are available in all the countries. The average local price of a Big Mac burger and a 2 { cola as well as the exchange rates are given in TABLE 4 in ANNEXURE D. |
Use ANNEXURE D to answer the questions that follow.
5.1 Identify the country that has the strongest currency in comparison to the rand. (2)
5.2 Calculate the price in rand that you will pay for a 2 { cola in the United States of America. (2)
5.3 Determine the missing values:
5.3.1 A (2)
5.3.2 B, the value of ONE Indian rupee in rand (2)
5.4 Determine the simplified ratio of the Singapore price of a Big Mac Burger to a 2 { cola. (3)
5.5 Identify the TWO countries that have almost similar purchasing power. (2)
5.6 Define the term median. (2)
5.7 Use the prices in rand for a Big Mac Burger to do the following:
5.7.1 Arrange the data in descending order (2)
5.7.2 Calculate the mean price (3)
[20]
TOTAL: 150
ANSWER SHEET I
CENTRE NUMBER:
EXAMINATION NUMBER:
QUESTION 1.2.4(a) 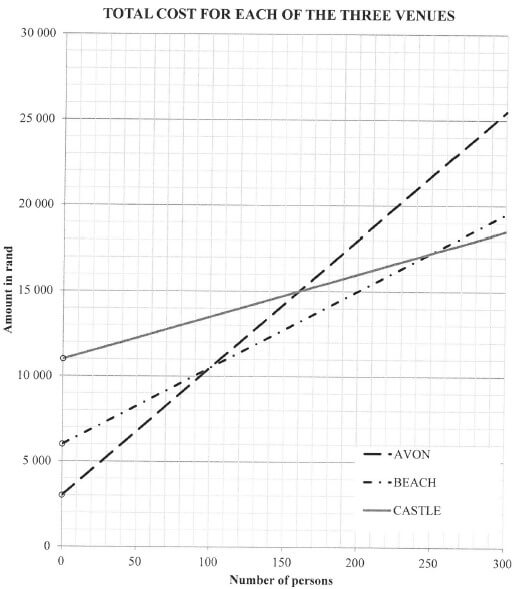
ANSWER SHEET 2
CENTRE NUMBER:
EXAMINATION NUMBER:
QUESTION 4.2.6 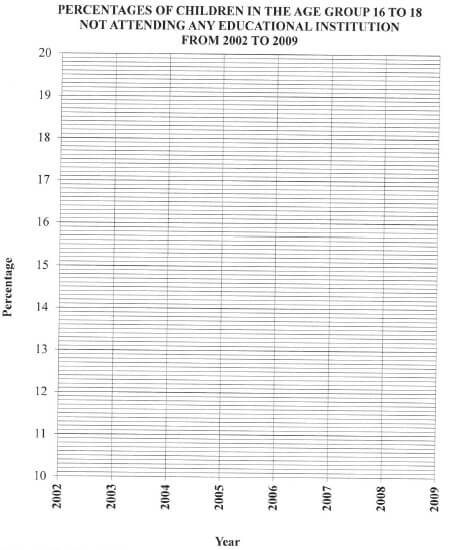
GRADE 12 MATHEMATICAL LITERACY PAPER 2 QUESTIONS - NSC PAST PAPERS AND MEMOS NOVEMBER 2016
GRADE 12 MATHEMATICAL LITERACY
PAPER TWO (P2)
NSC EXAM PAPERS AND MEMOS
NOVEMBER 2016
INSTRUCTIONS AND INFORMATION
- This question paper consists of FOUR questions. Answer ALL the questions.
- Use the ADDENDUM with ANNEXURES to answer the following questions:
ANNEXURE A for QUESTION 2.1
ANNEXURE B for QUESTION 2.2
ANNEXURE C for QUESTION 3.2
ANNEXURE D for QUESTION 4.2 - Number the answers correctly according to the numbering system used in this question paper.
- Start EACH question on a NEW page.
- You may use an approved calculator (non-programmable and non-graphical), unless stated otherwise.
- Show ALL calculations clearly.
- Round off ALL final answers appropriately according to the given context, unless stated otherwise.
- Indicate units of measurement, where applicable.
- Maps and diagrams are NOT drawn to scale, unless stated otherwise.
- Write neatly and legibly.
QUESTIONS
QUESTION 1
1.1
A company installed computers at a computer centre in October 2015. The manager used a bank account to pay the employees' wages for the project.
| |||||||||||||||||||||||||||||||||||||||||||||||||||||||||||||
Use TABLE 1 and the calendar above to answer the following questions.
1.1.1 Determine the probability of randomly selecting a workday in October 2015 with a date that is an even number. (3)
1.1.2 Give ONE valid reason why a company will not necessarily use a bank offering the lowest bank charges. (2)
1.1.3 Determine the missing value of A (rounded off to ONE decimal place) if the 2014 withdrawal fee was equal to:
(R3,50 + 1,1% of the withdrawal amount)
You may use the following formula:
Percentage change in fees = [ 2015 fee per R1 000 - 1] × 100%
2014 fee per R1 000
1.1.4 The company withdrew R15 000 for the weekly wages every Friday. The financial officer stated that the company would have saved more than R90 in withdrawal fees if they had used Bank Y rather than Bank X for the four withdrawals.
Verify whether this statement is valid. (7)
1.1.5 Calculate an employee's total monthly wage if he earned R2 142,85 per week in October 2015. Assume that the employee was not absent and did not work overtime in this month. (4)
1.2
| Since 2012 there has been a decrease in the number of computers shipped globally. TABLE 2 below shows the changes in the number of computers shipped globally by the five largest computer manufacturers worldwide in the first quarter of 2012 and the first quarter of 2013. TABLE 2: GLOBAL SHIPMENT OF COMPUTERS BY THE FIVE LARGEST COMPUTER MANUFACTURERS
| ||||||||||||||||||||
Use the information in TABLE 2 above to answer the following questions.
1.2.1 Give and explain TWO possible factors that could have led to the decrease in the global shipment of computers since 2012. (4)
1.2.2 Determine the difference between the total number of computers shipped globally by the five manufacturers in the first quarter of 2012 and the first quarter of 2013. (4)
1.2.3 It was stated that in this period, manufacturer A showed a greater percentage decrease in the shipment of computers compared with manufacturer D.
Verify (showing ALL calculations, whether this statement is valid. (7)
[36]
QUESTION 2
2.1
A representative of the Department of Tourism gave an overview of the spending by all tourists (domestic and international) in 2013. |
Use the information above and ANNEXURE A to answer the following questions.
2.1.1
(a) Calculate the total amount spent by all tourists in 2012. (3)
(b) Explain whether it is more appropriate to round off the rand value of the total amount spent in billions to one decimal place, rather than rounding off the rand value of the total amount spent in billions to the nearest whole number. (3)
2.1.2 The average amount spent by international tourists in 2013 was exactly R6 580. Verify, showing ALL calculations, whether this amount is CORRECT. (6)
2.1.3 Identify the item(s) on which international tourists spent the least money. (2)
2.1.4 Give ONE suitable example of a 'tourism-related item'. (2)
2.1.5 The tourism industry's direct contribution to the gross domestic product (GDP) was R103,6 billion in 2013.
The tourism industry's annual contribution to the GDP remained constant at an annual compound interest rate of 2,9% for the next three years.
Determine the total amount (rounded off to the nearest million) that the tourism industry contributed to the GDP in 2016. (6)
2.2
Tourists can travel by train as one of the modes of transport in South Africa. |
Use ANNEXURE B to answer the following questions.
2.2.1
- Calculate the total stopover time at all the railway stations between Johannesburg and East London. (5)
- Hence, determine the modal stopover time at the railway stations. (2)
- Determine the average speed at which the train travelled from Johannesburg to East London.
You may use the following formula:
D=SXT
where
D = distance (in km)
S = average speed (in km/h)
T = time in hours (h), excluding stopover times at railway stations (7)
2.2.2 Calculate the total cost of the return train trip for the family. (11)
[47]
QUESTION 3
3.1
Simone uses the local swimming pool to give swimming lessons.
|
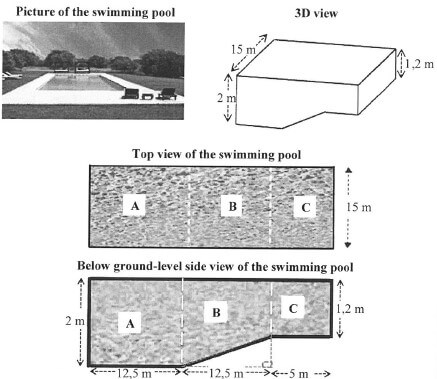
3.1.1 Show, with calculations, that the maximum capacity of the swimming pool is 765 m3. (5)
3.1.2 Calculate the volume of water (in gallons) required to fill the swimming pool to 94% of its capacity. (4)
3.1.3 The pool must be topped up with 135 000 l of water due to water loss. The pool is filled with water at a constant rate of 2 350 litres per hour. Simone says that it will take exactly 2½ days to top up the pool. Verify, showing ALL calculations, if her statement is valid. (5)
3.2
Swimming lessons are offered four times a week to three different groups. |
Use ANNEXURE C to answer the following questions.
3.2.1 Determine missing value x if the mean attendance for M is 15. (4)
3.2.2 Determine the interquartile range for A. (4)
3.2.3 Give a possible reason why E has full attendance on more days than M. (2)
3.2.4 Determine the probability (expressed as a whole percentage) of randomly choosing a day on which A has full attendance. (3)
3.2.5 Give TWO reasons why the attendance of A is considered to be better than that of M by using the box and whisker plots. (4)
[31]
QUESTION 4
4.1
In 2015 Keitumetse participated in the Oakland Marathon and the San Francisco Marathon. NOTE:
|
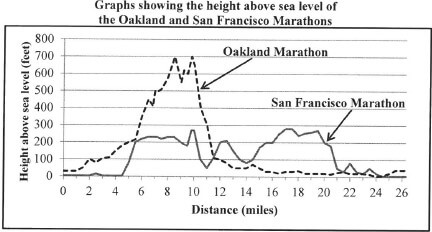
Use the graphs above to answer the following questions.
4.1.1 Show by calculation that one mile is equivalent to 1 760 yards. (2)
4.1.2 Determine the approximate distance (in miles) from the start of the San Francisco Marathon to where the height above sea level rises steeply for the first time. (2)
4.1.3 Calculate the maximum height above sea level (in metres) for the Oakland Marathon. (3)
4.1.4 An Oakland Marathon participant stated that the first 10 miles had been the most difficult, but thereafter it was much easier. Give a possible reason for this participant's statement. (2)
4.2
| Keitumetse also visited the Denver Zoo during his stay in America. The layout plan of the zoo, showing some animal enclosures and a map of the surrounding area, is given in ANNEXURE D. |
Use ANNEXURE D to answer the following questions.
4.2.1 Determine the total number of venues that are available for services and education. (2)
4.2.2 Keitumetse entered the zoo, passed the predator enclosure and continued walking in a westerly direction. Name the next major animal enclosure that he will encounter. (2)
4.2.3 If the area of the elephant enclosure is approximately the size of the area of four football fields, estimate the area of the entire zoo in terms of the area of football fields. (4)
4.2.4 The shortest distance between York Street and Colorado Street is 1,6 km. Verify (showing ALL calculations) whether the bar scale on the map is correct. (7)
4.3
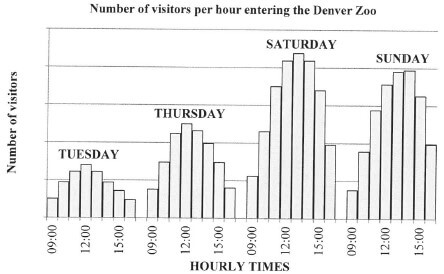
The bar graphs below show the number of visitors per hour entering the Denver Zoo on four days of the week. [Adapted from Wikipedia/Denver Zoo] |
Use the graph above to answer the following questions.
4.3.1 According to the graph, on which day do most people visit the zoo? (2)
4.3.2 Give ONE reason why it cannot be said with certainty that 12:00 on a Monday is NOT a very popular time for visitors to enter the zoo. (2)
4.3.3 Describe TWO possible trends that relate to the number of visitors and the hourly times visitors enter the zoo.(4)
4.3.4 Keitumetse states that at 09:00 on Saturdays the number of visitors entering the gates is nearly double the number of visitors at 09:00 on Tuesdays.
Give TWO reasons to justify this statement. (4)
[36]
TOTAL: 150
GRADE 12 MATHEMATICAL LITERACY PAPER 2 MEMORANDUM - NSC PAST PAPERS AND MEMOS NOVEMBER 2016
GRADE 12 MATHEMATICAL LITERACY
PAPER TWO (P2)
NSC EXAM PAPERS AND MEMOS
NOVEMBER 2016
Symbol | Explanation |
M | Method |
MA | Method with accuracy |
CA | Consistent accuracy |
A | Accuracy |
C | Conversion |
S | Simplification |
RT/RG/RD | Reading from a table/graph/map/diagram |
SF | Correct substitution in a formula |
O | Opinion/reason/deduction/example |
P | Penalty, e.g. for no units, incorrect rounding off, etc. |
R | Rounding off |
NP | No penalty for rounding |
AO | Answer only full marks |
J | Justification |
MEMORANDUM
QUESTION 1 [36 MARKS] | |||
Ques | Solution | Explanation | T&L |
1.1.1 | P(even number date) = 11 ✔✔A | 2A numerator | P L2 |
1.1.2 |
OR
OR
OR
OR
| 2O reason (2) | F L4 |
1.1.3 | 2014 Fee = R3,50 + 1,1% × R1 000 ✔SF OR % change = [ R15,50 - 1 ] × 100% ✔SF = [R15,50 − 1 ] × 100% | 1SF substituting R1000 OR 1SF correct values | F L2 |
Ques | Solution | Explanation | T&L |
1.1.4 | Withdrawal fee R15 000 at Bank X Withdrawal fee for R15 000 at Bank Y OR Withdrawal fee R15 000 at Bank X Withdrawal fee for R15 000 at Bank Y OR | 1SF substituting
OR 1MA substituting
OR | F L4 |
Ques | Solution | Explanation | T&L |
Bank X: | 1MA substituting (7) | ||
1.1.5 | Wage for 4 full weeks = R2 142,85 × 4 OR Average day wage = R2142,85 OR R2142,85 × 4 OR 2 days of a five day week = 2/5 of a week ✔ OR | 1A 4 weeks wage
OR 1M divide by 5
OR 1M divide by 5 OR | F L2 |
Ques | Solution | Explanation | T&L |
✓M | 1M multiplying (4) | ||
1.2.1 |
| 2O factor with reason (4) | D L4 |
1.2.2 | Q1 of 2012: | 1MA adding correct values
OR | D L2 |
Ques | Solution | Explanation | T&L |
Differences (in millions) for | 2A differences in millions (4) | ||
1.2.3 | ✔RT ✔M OR Percentage of 2012 shipped in 2013: | 1RT correct values
OR
1RT correct values | D L4 |
NP | |||
(7) | |||
[36] |
QUESTION 2 [47 MARKS] | |||
Ques | Solution | Explanation | T&L |
2.1.1 (a) | ✔A OR R199,54 billion or R1,9954 × 1011 | 1A correct value and % 1M dividing by 109,7% 1CA total amount | F L2 |
NP | |||
(3) | |||
2.1.1 (b) | ✔A OR ✔A | 1A statement (3) | F L4 |
2.1.2 | ✔A ✔A
Average spent per visitor = R94 127 000 000 ✔C OR ✔A ✔A OR | 1A percentage OR 1A percentage
OR | F L3 |
Ques | Solution | Explanation | T&L |
Amount spent by the International visitors | 1MA multiplying | ||
2.1.3 | Air transport and road transport ✔A✔A | 1A for each item (2) | F L2 |
2.1.4 | Payment of tourism levy ✔✔O | 2O example (2) | F L4 |
2.1.5 | Growth in 2014 = 2,9% × R103,6 billion ✔M OR | 1M multiplying OR |
Ques | Solution | Explanation | T&L |
2.1.5 | ✔A ✔M OR GDP contribution 2016 | 1M multiplying | F L3 |
2.2.1 (a) | ✔✔✔RT | 3RT correct stopover times | D L2 |
AO | |||
(5) | |||
2.2.1 (b) | 2 and 3 minutes ✔✔CA | CA From Q2.2.1 (a) | D L2 |
Ques | Solution | Explanation | T&L |
2.2.1 (c) | Actual train travel time: D = S × T OR ✔RT ✔CA OR From 17:30 to 00:00 = 6 hrs 30 min ✔RT D = S × T | CA From Q2.2.1(a) OR 1RT start and end time 1CA 19 hours 54 min 1M subtracting stopover time OR 1RT start and end times | M L3 |
NP | |||
(7) |
Ques | Solution | Explanation | T&L |
2.2.2 | Forward trip in January: Return trip in February: OR | 1MA two adult price OR | Fin L3 |
Ques | Solution | Explanation | T&L |
✔MA ✔MA | 1MA adding correct values | ||
[47] |
QUESTION 3 [31 MARKS] | |||
Ques | Solution | Explanation | T&L |
3.1.1 | Capacity of section C = 5 m × 1, 2 m × 15 m ✓SF OR Maximum capacity = Capacity of section (A + B + C) OR
Volume = 30 m × 15 m × 2 m ✓SF | 1SF correct values OR 1SF Correct values for A OR 1SF volume | M L3 |
3.1.2 | ✓M OR | 1M calculating % OR | M L3 |
Ques | Solution | Explanation | T&L |
Capacity (in litres) = 765 m3 × 1 000 = 765 000 ℓ ✓C | 1C convert to litres | ||
NP | |||
(4) | |||
3.1.3 | In 1 hour 2 350 litres of water will flow. OR Time to fill swimming pool = 135 000 ✓MA OR
Time to fill swimming pool = 135 000 L ✓MA OR | 1MA using flow rate OR 1MA finding time taken 1CA time OR 1MA finding time taken OR |
Copyright reserved Please turn over
Mathematical Literacy/P2 15 DBE/November 2016 NSC – Memorandum
Ques | Solution | Explanation | T&L |
3.1.3 |
Time to fill swimming pool = 135 000 L ✓MA OR ✓MA ✓A | 1MA finding time taken 1CA time OR 1MA multiplying with 24 h/d | M L3 |
3.2.1 | Total = 18 × 15 = 270 ✓MA OR
OR | 1MA multiplying OR 1MA adding correct values OR | Data L3 |
Ques | Solution | Explanation | T&L |
✓M | 1M adding correct values | ||
AO | |||
(4) | |||
3.2.2 | Q1 = 15 ✓RG and Q3 = 20 ✓RG | 1RG finding Q1 | Data L3 |
AO | |||
(4) | |||
3.2.3 | It is more convenient for them to go in the evening ✓✓O OR During daytime other distractions keep people away. ✓✓O OR Small groups receive individual attention ✓✓O OR Any other sensible reason ✓✓O | 2O reason (2) | D L4 |
3.2.4 | ✓A | 1A numerator | P L2 |
AO | |||
(3) | |||
3.2.5 | The range of the afternoon group was smaller. ✓✓O | 2O reason | D L4 |
[31] |
QUESTION 4 [36 marks] | |||
Ques | Solution | Explanation | T&L |
4.1.1 | ✓MA OR 1 = 4,571428571 ✓MA | 1MA recognising equal parts OR 1MA conversion factor | M L2 |
4.1.2 | Approximately 4,5 miles ✓✓RG | 2RG correct distance. (2) | MP L2 |
4.1.3 | ✓RG ✓C ✓CA | 1RG correct distance | MP L2 |
NP | |||
(3) | |||
4.1.4 | It is uphill. (steep) ✓✓O OR This runner found it difficult to run uphill. ✓✓O OR It is easier to run downhill. ✓✓O | 2O reason (2) | MP L4 |
4.2.1 | ✓A ✓A | 2A number of venues (2) | MP L2 |
4.2.2 | Hippo ✓✓A | 2A correct enclosure (2) | MP L2 |
Ques | Solution | Explanation | T&L |
4.2.3 | ✓✓A | 2 A estimation | MP L4 |
4.2.4 | ✓A
Real distance using the bar scale = 85 mm × 200m ✓M OR ✓A ✓M
Calculated map distance = 1600 m × 20mm ✓M | 1A measured distance OR 1A measured bar | MP L4 |
4.3.1 | Saturday ✓✓A | 2A correct day (2) | D L2 |
4.3.2 | Monday is NOT reflected on the given graph. ✓✓O | 2O reasoning (2) | P L4 |
Ques | Solution | Explanation | T&L |
4.3.3 | The number of visitors increase to about 12:00. on weekdays and then decrease again till 16:00. ✓✓O OR The number of visitors on weekends is more than the visitors on weekdays. ✓✓O OR The number of visitors increase to about 13:00 on weekends and then decrease again till 16:00. ✓✓O | 2O trend | D L4 |
4.3.4 | The number indicated by the height of the column on Saturday is a little more than double the height of the mean number for a Tuesday ✓✓O OR People work during the week ✓✓O OR Saturdays they go with their families to the zoo. ✓✓O OR Cheaper to go during the weekends ✓✓O OR More activities at the zoo on Saturday. ✓✓O | 2O reason | D L4 |
[36] |
TOTAL: 150
GRADE 12 MATHEMATICAL LITERACY PAPER 1 MEMORANDUM - NSC PAST PAPERS AND MEMOS NOVEMBER 2016
GRADE 12 MATHEMATICAL LITERACY
PAPER ONE(P1)
NSC EXAM PAPERS AND MEMOS
NOVEMBER 2016
Symbol | Explanation |
M | Method |
MA | Method with accuracy |
CA | Consistent accuracy |
A | Accuracy |
C | Conversion |
S | Simplification |
RT/RG | Reading from a table/graph/diagram |
SF | Correct substitution in a formula |
O | Opinion/Example/Definition/Explanation |
P | Penalty, e.g. for no units, incorrect rounding off, etc. |
R | Rounding off |
NP | No penalty rounding or omitting units |
MEMORANDUM
Question 1 [43 Marks] | ||||
Ques | Solution | Explanation | Topic/L | |
1.1.1 | Booysen M ✔✔A | 2A correct name (2) | F | |
1.1.2 | July ✔A
| 1A correct month
(2) | L1 | |
1.1.3 | ✔M/A | 1M/A subtracting correct values
NP (2) | L1 | |
1.1.4 | ✔RT ✔M | 1RT reading from table
NP (3) | L1 | |
1.1.5 | ✔M | 1M adding correct %
(2) | L1 | |
Ques | Solution | Explanation | Topic/L | |
1.1.6 | Amount without VAT = R5,70 ✔MA OR ✔A | 1MA dividing by 114% OR 1M dividing by 114%
NP (2) | L2 | |
1.1.7 | ✔O OR Money borrowed to buy a house | 1O Amount borrowed (2) | L1 | |
1.1.8 | B ✔✔A | 2A correct reason (2) | L1 | |
1.1.9 (a) | ✔MA | 1M/A subtracting correct values
(2) | L1 | |
1.1.9 (b) | Credit ✔✔A | 2A correct column (2) | L1 | |
1.1.10 | ✔A | 1A 31 days
NP (3) | L2 |
Ques | Solution | Explanation | Topic/L | |
1.2.1 | ✔✔O | 2O explanation (2) | L1 | |
1.2.2 | ✔A ✔A | 1A substituting 6 000 1A substituting 45 1CA cost
(3) | L2 | |
1.2.3 (a) | Avon ✔✔RG | 2RG reading from graph (2) | L1 | |
1.2.3 (b) | 200 ✔✔RG | 2RG reading from graph (2) | L1 |
Ques | Solution | Explanation | Topic/ L | |
1.2.4 (a) |
(4) | L2 | ||
Ques | Solution | Explanation | Topic/L |
1.2.4 (b) | Cost for 250 persons = R11 000 + R25 × 250 ✔SF Income from 194 tickets = R150 × 194 ✔MA Profit = R29 100 – R17 250 OR ✔SF ✔M | 1SF substitution OR 1SF substitution | L3 |
Note:
| |||
NP (5) | |||
[43] |
QUESTION 2 [29 MARKS] | ||||
Ques | Solution | Explanation | Topic/L | |
2.1.1 (a) | d = 4,2 m – (1,2 m + 1,8 m) ✔M OR ✔M ✔C | 1M subtracting OR 1M subtracting
(3) | L1 | |
2.1.1 (b) | ✔MA OR ✔MA 15 m × 2 + 1,2 m × 4 + 4,2 m = 39 m ✔CA | 1M/A adding all values OR 1M/A adding all values
(3) | L1 | |
2.1.1 (c) | Total area = 1,8 m × 15 m + 1,2 m × 4,2 m ✔SF OR ✔S ✔SF OR ✔S ✔SF OR | 1SF substituting OR 1SF substituting OR 1SF substituting OR | L2 | |
Ques | Solution | Explanation | Topic/L | |
✔SF | 1SF substituting | |||
Max 2 out of 4 if only one area correctly calculated with unit | ||||
(4) | ||||
2.1.1 (d) | ¹/3 of the length of the hall = 16,2 m ✔A | 1A length of runway
(3) | L1 | |
2.1.2 | ✔M | 1M dividing by conversion factor
(3) | L2 | |
2.2.1 | ✔SF ✔C OR ✔SF | 1SF substitute into formula OR 1SF substitute into formula
(4) | L2 |
Ques | Solution | Explanation | Topic/L |
2.2.2 | ✔SF OR ✔A ✔SF ✔M | 1SF substitute into formula OR 1SF substitute into formula | L2 |
Penalise with one mark if π on calculator is used | |||
(4) | |||
2.2.3 | ✔SF OR ✔SF ✔A ✔MA | 1SF substitute into formula OR 1SF substitute into formula (3) | L2 |
2.2.4 | kilograms or kg or g ✔✔A | 2A unit (2) | L1 |
[29] |
QUESTION 3 [28 MARKS] | ||||
Ques | Solution | Explanation | Topic/L | |
3.1.1 | Row A = 15 ; Row B = 16 ; Row C = 18 OR Total = 432 – total left block – total right block ✔M OR Total ✔A | 1A number in seats in row A – J OR 1M subtracting OR 1A number of seats in right block
(4) | L1 | |
3.1.2 | North West/NW ✔✔A | 2A direction (2) | L1 | |
3.1.3 | H30 ✔✔✔A | 3A if row AND seat are correct (3) | L1 | |
3.1.4 | Exit towards the left/ aisle ✔A | 1A Exit to left/ aisle 1 (4) | L2 | |
Ques | Solution | Explanation | Topic/L | |
3.1.5 | ✔MA
| 1MA calculating % of 432 (CA from Q 3.1.1)
(3) | P L2 | |
3.1.6 | 20% ✔✔A | 2A correct decimal (2) | P L1 | |
3.2.1 (a) | Unscrewed ✔✔A | 2A unscrewed (2) | L1 | |
3.2.1 (b) | Anti-clockwise OR left OR counter-clockwise ✔✔A | 2A direction (2) | L1 | |
3.2.2 | 3 ✔✔A | 2A 3 screws (2) | L2 | |
3.2.3 | ✔M | 2A correct diagram (2) | L1 | |
3.2.4 | Actual length = 62 mm × 30 OR 6,2 cm × 30 OR ✔C ✔M
| 1M multiply by scale OR 1C conversion
(3) | L2 | |
[28] |
QUESTION 4 [30 MARKS] | ||||
Ques | Solution | Explanation | Topic/L | |
4.1.1 | ✔A ✔M 322,15 – 180,29 mph = 141,86 mile per hour ✔CA | 1A identify correct highest and lowest values
(3) | L1 | |
4.1.2 | 14 ✔✔RT | 2RT correct number of riders (2) | L1 | |
4.1.3 | ✔RT ✔RT | 1RT first year (3) | L1 | |
4.1.4 | Ernest J Henne ✔✔RT | 2RT name of rider (3) | L1 | |
4.1.5 | ✔A | 1A number of years in 21st century
(3) | P L3 | |
4.2.1 | ✔✔O OR ✔✔O | 2O explanation OR 2O explanation (2) | L1 | |
4.2.2 | 16 to 18 ✔✔RT | 2RT identify correct age group (2) | L1 | |
4.2.3 | 2007 ✔✔RT | 1RT identify correct year (2) | L1 | |
Ques | Solution | Explanation | Topic/L | ||
4.2.4 | ✔RT | 1RT correct values
(2) | L1 | ||
4.2.5 | ✔RT ✔M B = 194 901 × 100 | 1RT correct values (3) | L1 | ||
4.2.6 |
(5) | L2 | |||
[30] | |||||
QUESTION 5 [20 MARKS] | ||||
Ques | Solution | Explanation | Topic/L | |
5.1 | United Kingdom OR Britain ✔✔RT | 2RT correct country (2) | D L1 | |
5.2 | 1 South African rand = 0,070 US dollar OR R95,57 ÷ $6,69 = 14,2855… ✔M | 1M dividing by exchange rate OR 1M dividing by price in dollar
(2) | F L2 | |
5.3.1 | A = 113,96 euro ✔M | 1M dividing by exchange rate
(2) | F L2 | |
5.3.2 | B = 56,07 ✔M | 1M dividing by exchange rate
(2) | F L2 | |
5.4 | SGD $ 8,00 : SGD $ 2,50 ✔A ✔MA
| 1A identifying the correct values
(3) | F L1 | |
Ques | Solution | Explanation | Topic/ L | |
5.5 | ✔RT | 1RT United States of America (2) | D L1 | |
5.6 | ✔O | 1O middle value (2) | D L1 | |
5.7.1 | ✔RT | 1RT correct values (2) | D L1 | |
5.7.2 | Mean (in rand ) = ✔M | 1M adding values
(3) | D L2 | |
[20] | ||||
TOTAL | 150 | |||
ECONOMICS PAPER 2 GRADE 12 MEMORANDUM - NSC PAST PAPERS AND MEMOS NOVEMBER 2016
ECONOMICS
PAPER TWO (P2)
GRADE 12
NSC EXAM PAPERS AND MEMOS
NOVEMBER 2016
MEMORANDUM
SECTION A (COMPULSORY)
QUESTION 1
1.1 MULTIPLE-CHOICE QUESTIONS
1.1.1 A ✓✓ electricity
1.1.2 B ✓✓ is horizontal
1.1.3 C ✓ ✓ demand
1.1.4 B ✓✓ externalities
1.1.5 A ✓✓ implicit
1.1.6 A ✓✓ biodiversity
1.1.7 B ✓✓ stagflation
1.1.8 C ✓✓ poverty (8 x 2) (16)
1.2 MATCHING ITEMS
1.2.1 B ✓ expenses incurred by businesses when producing an article
1.2.2 C ✓ situation where the business does not make a profit or a loss
1.2.3 D ✓ businesses that produce similar products
1.2.4 F ✓ the increase in the percentage output is less than the increase in the percentage input
1.2.5 I ✓ buyers are charged differently for the same product
1.2.6 E ✓ solid waste, for example plastic bags and garbage, that cannot be disposed of
1.2.7 A ✓ a general increase in prices caused by an increase in factor costs
1.2.8 G ✓ give businesses the right to pollute up to a certain extent (8 x 1) (8)
1.3 GIVE THE TERM
1.3.1 Economic profit / Supernormal / Abnormal ✓
1.3.2 Short term / Short run ✓
1.3.3 Market ✓
1.3.4 Patent ✓
1.3.5Greenhouse ✓
1.3.6 Opportunity cost ✓ (6 x 1) (6)
TOTAL SECTION A: 30
SECTION B
Answer any TWO of the three questions in this section in the ANSWER BOOK.
QUESTION 2: MICROECONOMICS
2.1 Answer the following questions.
2.1.1 Name any TWO institutions that regulate unfair competition in South Africa.
- Competition Commission ✓
- Competition Tribunal ✓
- Competition Appeal Court ✓ Any (2 x 1) (2)
2.1.2 How will producers benefit from minimum prices that are implemented by the government?
Producers will be able to make a comfortable profit, which will encourage them, to produce more – given them more certainty and for future planning ✓✓
(Accept any other correct relevant response) (1 x 2) (2)
2.2 Data response
2.2.1 Identify the market structure in the graph above.
Perfect market / Perfect competition ✓ (1)
2.2.2 Give the value of the market price depicted above.
R50 ✓ (1)
2.2.3 How will this equilibrium position change in the long run (long term)?
- It will change to normal profit due to firms leaving the industry. ✓✓
- In the long run firms will leave the industry, which will increase the revenue, thereby reducing the loss ✓✓ Any (1 x 2) (2)
2.2.4 What conditions must exist for this firm to shut down?
- When it cannot meet its average variable cost / price is less than/equal to AVC / TR < AVC ✓✓
- When the firm's total revenue is less than its variable costs ✓✓
- When MR = AVC = MC ✓✓ Any (1 x 2) (2)
2.2.5 Calculate the economic loss faced by this firm.
Unit loss: R40 ✓ OR TR – TC ✓
Total loss: 100 x 40 ✓ = 5000 – 9000 ✓
= R4000 ✓✓ = –4000 ✓✓
(Allocate 2 marks if only unit loss is given)
(Allocate 4 marks if only the correct final answer is given) (4)
2.3 Data response
2.3.1 Identify ONE external cost in the project above.
Pollution ✓ (1)
2.3.2 Identify a social benefit in the project above.
New job opportunities / quality service deliveries / High-quality product ✓ (1)
2.3.3 What can the government do to reduce the external cost of the project above?
The government can:
- Install equipment that will reduce pollution ✓✓
- Design the plant in such a way that pollution will be limited to the minimum ✓✓
- Tax the polluter ✓✓
- Issue marketable permits (regulations) for firms to pollute to a certain extent ✓✓
- Set maximum levels of pollution ✓✓
(Accept any other correct relevant response) (2)
2.3.4 How will the government benefit from the approval of the project above?
The government will:
- Earn more revenue from selling the product ✓✓
- Receive more money from taxes ✓✓
- Be able to create more jobs ✓✓
(Accept any other correct relevant response) Any (1 x 2) (2)
2.3.5 Why should the government do a cost-benefit analysis before starting each new project?
CBA will enable the government to:
- Make informed decisions ✓✓
- Be more objective in its decision making ✓✓
- Be more efficient in the allocation of resources ✓✓
(Accept any other correct relevant response) Any (2 x 2) (4)
2.4 Differentiate between productive inefficiency and allocative inefficiency.
Productive inefficiency
- The producer does not produce at the lowest possible cost ✓✓
- There is room to reduce costs without producing fewer goods or without producing a lower quality good ✓✓
- Not all resources are used effectively ✓✓
- Occurs at any point inside the PPC / under-utilisation of resources ✓✓ (Max 4)
Allocative inefficiency
- The producer is producing at a sub-optimal allocation (point B) ✓✓
- The allocation (combination) of resources in not in accordance with the consumer demand (tastes) ✓✓
- Not all resources are allocated effectively ✓✓
- The welfare of the community is not maximised ✓✓
- Government intervenes in an attempt to correct market failure ✓✓
(Accept tabular format) (Max 4) (Accept description connected to the graph)
(Accept any other correct relevant responses) (2 x 4) (8)
2.5 How may differentiated products influence consumers and producers in a monopolistic competitive market?
Consumer
- The consumer may regard one product as better, whether real or imagined, therefore, it is based on the opinion of consumers ✓✓
- Consumers tend to buy brand names and have their preferences in this regard ✓✓
- E.g. Levi jeans will be more popular than no name brand jeans ✓
- Advertising stresses differences that are attractive to consumers ✓✓
- Increase spending due to consumers wanting different brands of the same good ✓✓ e.g. Nike, Puma, etc. ✓
- Wider choice of goods / exposed to different products ✓✓
- Differences in packaging makes purchasing/buying easy ✓✓ (Max 4)
Producers
- By selling slightly differentiated product each producer distinguishes themselves from another producer ✓✓
- The unique characteristics of differentiated products allow producers to compete against others ✓✓
- Therefore they can justify a higher price for their product based on these 'uniqueness' (slight differentiation) ✓✓
- It may enjoy brand loyalty as customers have a preference towards a particular product ✓✓
- Profits used in research and development in order to make the product look different – stimulated creativity ✓✓
- Differentiated products create opportunities for non-price competition ✓✓
(Accept any other correct relevant response)
(Only 1 mark allocated for examples per participant) (Max 4) (8)
[40]
QUESTION 3: CONTEMPORARY ECONOMIC ISSUES
3.1 Answer the following questions.
3.1.1 Name any TWO millennium development goals that form part of international agreements that ensure a sustainable environment.
- Eradication of poverty and hunger ✓
- Achieving universal primary education ✓
- Gender equality ✓
- Reducing child mortality rates ✓
- Combat HIV/Aids ✓
- Improve health ✓
- Ensure environmental sustainability ✓ (2)
- Global partnership for development ✓ Any (2 x 1)
3.1.2 How may taxes be used to ensure environmental sustainability?
- Reduce pollution through green tax and environmental tax ✓✓
- By levying it on products associated with high pollution levels ✓✓
- Use tax revenue to promote environmental-friendly products e.g. solar geysers ✓✓ (2)
(Accept any other correct relevant response) Any (1 x 2)
3.2 Data response
3.2.1 Identify the percentage wage increase in the extract above that was demanded by workers in the transport industry.
25% ✓ (1)
3.2.2 Which labour union represents the workers in the mining sector above?
National Union of Mineworkers (NUM) ✓ (1)
3.2.3 Why is the wage demand by the transport workers unrealistic?
It is far above the inflation target of 6% ✓✓ (2)
3.2.4 Briefly explain ONE reason for the excessive wage demand above.
The high cost of living results in wages being insufficient to cover the basic needs ✓✓
(Accept any other correct relevant response) (2)
3.2.5 What will be the impact on the mining industry if the entry level workers' wage demands of R10 500 per month are met?
- The mining industry which is already under high cost pressure might struggle to survive / become less competitive ✓✓
- These wage increases will force many mines to shut down production ✓✓
- Some mines might have no option but to lay-off workers✓✓
- Meeting the wage demand might cause the ripple effect in the rest of the mining sector and related industries ✓✓
- Fewer strikes, hence less interruption in production ✓✓
(Accept any other correct relevant response) (2 x 2) (4)
3.3 Data response
3.3.1 What, according to the information above, should be reduced to avoid global warming?
The burning of fossil fuels/fossil fuel emissions / human activity ✓ (1)
3.3.2 Identify ONE negative effect of global warming.
- More heat returning to earth ✓
- Nights warming faster than days ✓
- Winter warming faster than summer ✓
- Less heat escape the space ✓
- Climate change ✓
- Less oxygen in the air ✓
- Cooling upper atmosphere ✓
- Pattern of ocean warming ✓
- More fossil-fuel carbon in the air ✓
- More fossil-fuel carbon in coral ✓ (1)
3.3.3 Briefly describe the term climate change.
It is the change in weather patterns due to global warming ✓✓
(Accept any other correct relevant response) (2)
3.3.4 Why do businesses resist changing to more environmentally friendly production methods?
They resist (fear) the change to more environmentally friendly methods due to higher cost and possible revenue losses / Environmentally methods are time consuming and need a lot of training of employees ✓✓
(Accept any other correct relevant response) (2)
3.3.5 What can be done to reduce the emissions caused by the burning of fossil fuels?
- Equipment can be installed in plants/cars that will reduce emissions ✓✓ e.g. catalytic converters / air filters ✓
- Businesses and households can switch to more environmentally
- friendly sources (technology) such as ✓✓ E.g. Solar energy/Wind energy/Hydro energy/Gas energy ✓ Impose taxes or fines ✓✓
(Accept any other correct relevant response)
(Allocate a maximum of 1 mark for the listing of examples) (Max 4) (4)
3.4 Differentiate between conservation and preservation.
Conservation
- It is the management of the environment in a way that prevents it from being damaged ✓✓
- E.g. game parks are used to keep certain endangered species ✓✓
- It is a creative continuity of the environment to ensure quality of life for both present and future generations ✓✓
- Conservation is needed due to pollution and over utilisation of the
environment ✓✓
- Ensure economical use of renewable and non-renewable resources ✓✓ (Max 4)
Preservation
- It is the process of keeping the environment in its present state ✓✓
- It is often applied where elements of the environment are threatened by extinction ✓✓
- e.g. Rhinoceros species / heritage sites have cultural significance / ecosystems ✓
(Accept tabular format) (Max 4) (Accept any other correct relevant response)
(A maximum of 1 mark for examples under each concept) (2 x 4) (8)
3.5 How will you advise the Minister of Tourism to overcome the impact of negative externalities generated by tourism?
- The minister can enforce the appointment of local unemployed people to ensure a redistribution of income and also provide opportunities to improve skills for people in that community. This will prevent the increase inequalities of rural people by tourism ✓✓
- The minister can use discriminatory pricing policy to benefit local people because tourists are willing to pay higher prices because of a favourable exchange rate ✓✓
- The minister should be made aware of programmes to address deficiencies in education and training ✓✓
- The minister can employ local unemployed people to facilitate traffic flow or get local people to fill up waste bags for recycling. This will alleviate traffic congestion and pollution caused by tourism ✓✓
- The minister can create specific business zones that will not impact negatively on the aesthetic appearance of the community. There should also be consultation with the community before erecting any infrastructure that will alter the landscape ✓✓
- Some tourists bring diseases such as Ebola. Government must screen people on arrival ✓✓
(Accept any other correct relevant response) (4 x 2) (8)
[40]
QUESTION 4: MICROECONOMICS AND CONTEMPORARY ECONOMIC ISSUES
4.1
4.1.1 Name any TWO types of tourism.
- Leisure and recreation ✓
- Business and professional ✓
- Eco-tourism ✓
- Cultural ✓
- Medical ✓
- Community ✓
- Paleo ✓
- Adventure ✓
- Humane ✓
(Accept any other correct relevant response) Any (2 x 1) (2)
4.1.2 Why is a perfect competitor unable to influence the market price?
The producer is too small in relation to the size of the market, therefore he is a price taker ✓✓ (1 x 2) (2)
4.2 Data response
4.2.1 Which curve represents the average revenue (AR) curve?
D / Demand curve ✓ (1)
4.2.2 How many firms dominate this type of market?
One / 1 ✓ (1)
4.2.3 Why does the marginal revenue (MR) curve lie below the demand curve?
Due to the negative-sloping demand curve, every additional unit is sold at a lower price ✓✓ (2)
(Accept any other correct relevant response)
4.2.4 Why will the monopolist not be able to charge excessively high prices for his/her product?
- Although the monopolist is the only supplier in the market, it is still influenced by market forces ✓✓
- Due to the limited budget that the consumer operates on, if the prices are too high there will not be enough demand for the product / consumer may switch to other alternative products ✓✓
- Price increases are sometimes regulated by the government to protect the consumer ✓✓
- Although the monopolist can set his own price he cannot do so without affecting the quantity that will be sold ✓✓
- To sell more products he must decrease the price ✓✓ (2)
4.2.5 Redraw the graph above into the ANSWER BOOK. Indicate economic profit on your graph by inserting the average cost (AC) curve and marginal cost (MC) curve on the same set of axes.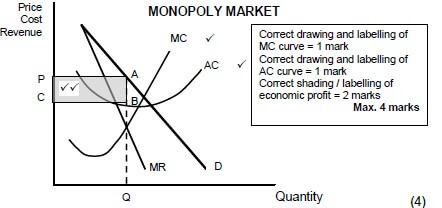
4.3 Data response
4.3.1 Give ONE reason in the extract above why South Africa is regarded as a very popular tourist destination.
- Spectacular scenery ✓
- Friendly people ✓
- World-class infrastructure ✓ (1)
4.3.2 Identify in the extract above why the tourism industry has been earmarked as a key sector?
Because of its growth potential / economic recovery ✓ (1)
4.3.3 Briefly describe the term tourism.
Activities of people travelling to and staying in places outside their usual environment for no more than one year ✓✓
(Accept any other correct relevant response) (2)
4.3.4 Give ONE reason why the tourism industry is growing at such a high rate.
- Increase in disposable income ✓✓
- Reduction on working hours ✓✓
- More awareness of leisure and recreation ✓✓
- Improved transport/accommodation/communication ✓✓
- Increase advertisements and promotion ✓✓
- Scenery / friendly people / easily obtaining foreign exchange / improved political climate ✓✓
(Accept any other correct relevant response) (2)
4.3.5 In your opinion, how can the tourism industry benefit the poor, rural communities of South Africa?
- Increase in employment opportunities / guesthouses / hotels / restaurants ✓✓
- Expansion of the market for indigenous arts / culture / products ✓✓
- Improvement of infrastructure in rural areas ✓✓
(Accept any other correct relevant response) (Any 2 x 2) (4)
4.4 Explain the goals of the South African competition policy.
- Prevent the abuse of economic power ✓✓ e.g. forming of monopolies ✓
- Regulate the growth of market power by means of takeovers and mergers ✓✓
- Prevent restrictive practices, especially by oligopolist ✓✓ such as fixing of selling prices, collusion and price discrimination ✓
- Improve the efficiency in the market through legislation ✓✓
- Promote healthy competition between businesses ✓✓
- Protect the consumer against unfair prices and inferior products ✓✓ for example through the Competition Act ✓
- Contribute to South Africa's development objectives to ensure that all South African have equal opportunities to participate fairly in economic activities ✓✓ They also improve equity in the market ✓✓ for example through the Employment Equity Act / enable SMME's ✓
(Accept any other correct relevant response)
(Max 2 for the mere listing of examples) (Max 8) (8)
4.5 How do consumers as key market role-players fail to protect the environment?
- As a result of the lack of knowledge consumers' actions often have a negative impact on the environment / consumers not aware of recycling ✓✓
- By using certain products such as aerosol they cause environmental damage without realising it ✓✓
- Due to the fact that some resources are not privately owned, they have an element of non-excludability. Therefore, these resources are often overused ✓✓ e.g. oceans and rivers ✓
- Consumers often care less about their practices that harm the environment because of self-interest ✓✓
- Some consumers pollute the environment through littering, disposal of waste, etc. because the costs (negative externalities) are borne by others ✓✓
(Accept any other correct relevant response)
(Allocate only 2 marks for examples) (8)
[40]
TOTAL SECTION B: 80
SECTION C
Answer any ONE of the two questions in this section in the ANSWER BOOK. Your answer will be assessed as follows:
STRUCTURE OF ESSAY | MARK ALLOCATION |
Introduction | Max. 2 |
Body | Max. 26 Max. 10 |
Conclusion
| Max. 2 |
TOTAL | 40 |
QUESTION 5: MICROECONOMICS
The oligopoly is a necessary market structure in a free-market system.
- Discuss in detail an oligopoly as a market structure. (26 marks)
- Explain, with the aid of a well-labelled graph, why the oligopolist will not compete on price to increase his/her market share. (10 marks)
[40]
INTRODUCTION
The oligopoly is a type of imperfect market in which only a few producers dominate the market ✓✓
(Accept any other correct relevant response) (Max 2) MAIN PART
Nature of the product ✓
- The product may be homogeneous (the same) or differentiated (heterogeneous) – slight differences ✓✓
- If the product is homogeneous, it is known as a pure oligopoly ✓✓
- If it is differentiated, it is known as a differentiated oligopoly ✓✓
Market information ✓
- There is incomplete information ✓✓
Market entry ✓
- Entry is easy to difficult, it is limited in the sense that huge capital outlay might be necessary ✓✓
Control over price ✓
- Considerable control over price, it can influence price, but not as much as the monopolist ✓✓
- Oligopolies can frequently change their prices in order to increase their market share and this can result in price wars ✓✓
Mutual dependence ✓
- Mutual dependence (interdependence) exists amongst these businesses ✓✓
- Each firm knows its market share, the behaviour of one firm can influence other significantly ✓✓
- A change in the price or change in the market share by one firm is reflected in the sales of the others ✓✓
Non-price competition ✓
- Because price competition can result in destructive price wars, oligopolists prefer to compete on a different basis ✓✓
- This encourage non-price competition through advertising, packaging, after-sales services ✓
- Participants observe one another carefully – when one oligopolist launches an advertising campaign, its competitors soon follow suit ✓✓
- If oligopolies operate as a cartel, firms have an absolute cost advantage over the rest of the other competitors in the industry ✓✓
Collusion ✓
Overt collusion: ✓
- Firms can work together to form a cartel, a cartel is a formal agreement amongst firms to work together in limiting total industry supply in order to increase prices or fix prices at certain levels ✓✓
- The main idea is to increase individuals' members' profits by reducing competition. ✓✓
- This is illegal and often investigated by the Competition Commission in South Africa ✓✓
- Guilty businesses are often heavily penalised in the form of fines ✓✓
Tacit collusion: ✓
- The oligopoly market may be characterised by a definite price leader, other may follow the pricing policy of the leader ✓✓
- This is not a formal agreement and thus not illegal in South Africa. ✓✓
- Examples in South Africa are cell phone operators: Cell C, MTN, Vodacom, Telkom Mobile, petrol garages like Engen, Total, Caltex, Shell, BP; Banks like FNB, ABSA, Standard Bank, Nedbank, Capitec ✓
Limited competition ✓
- There are only a few suppliers manufacturing the same product ✓✓
Economic profit ✓
- Oligopolies can make an economic profit over the long term ✓✓
- Abnormal profits may a result of joint decision-making in an oligopoly ✓✓
Demand curve ✓
- The demand curve slopes from left to right (downward sloping) ✓✓
- Also known as die kinked demand-curve ✓✓
- Contains two curves (elastic and inelastic parts) ✓✓
Productive/Technological efficiency ✓
- Productive efficiency is possible ✓
Allocative efficiency ✓
- Allocative efficiency is not possible ✓ (Max. 26)
ADDITIONAL PART 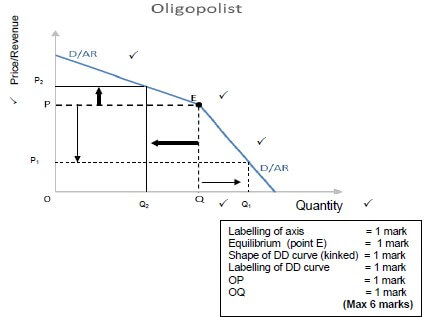
- As an oligopolist raises its price above point E, it will lose customers because the other oligopolists will not raise their price ✓✓
- Although he will benefit from the increased revenue per unit, his total revenue will be lower because of a greater loss of customers ✓✓
- If an oligopolist lowers its price below point E, other oligopolists will lower their price to compete, and as a result, the decrease in price does not attract many new customers ✓✓
- Because raising or lowering the price is not beneficial for the oligopolist, it engages in mostly non-price competition such as product differentiation and efficient service underscored by advertising ✓✓
(Accept any other correct relevant response) Max 6 (Max 10)
CONCLUSION
Oligopolies are interdependent, their actions are influenced by other firms in the market ✓✓
(Accept any other correct relevant response) (Max. 2)
[40]
QUESTION 6: CONTEMPORARY ECONOMIC ISSUES 40 MARKS – 40 MINUTES
Inflation originates from the demand side or supply side of the economy.
- Examine in detail the causes of demand-pull inflation. (26 marks)
- How successful have monetary policy measures been in combatting demand pull inflation in South Africa? (10 marks)
[40]
INTRODUCTION
Inflation is a sustained and significant increase in general price level over a period of time and a simultaneous decrease in the purchasing power of money ✓✓
OR
Demand-pull inflation occurs when aggregate demand in an economy outpaces (is faster than) aggregate supply ✓✓ (Max. 2)
MAIN PART
- Demand-pull inflation occurs when the total spending in the economy increases and the economy is unable to expand output to meet the increase in spending ✓✓
- Increased consumption by households (C) ✓ The disposable income of households can increase at a faster rate than aggregate supply for the following reasons ✓✓
- It is caused by easier access to credit ✓or lower interest rates, which make credit cheaper ✓✓ With credit being cheaper, households will borrow more ✓✓
- Lack of savings ✓ Consumers may spend their entire income and fail to save ✓✓ This results in a lack of liquidity for banks to finance essential capital investment ✓✓
- Reduction in taxes ✓ If the government decides to decrease personal income tax, consumers will use the extra income to buy more goods and services ✓✓
- Investment spending (I) ✓
- A reduction in interest rates will encourage firms to expanding their operations ✓✓
- Businesses invest more and this may lead to an increase in the demand for goods and services that are part of the investment ✓✓ e.g. new buildings, sement, brics and labour ✓
- If aggregate demand increases at a faster rate than aggregate supply, price increases will follow ✓✓
- Government spending (G) ✓
- An increase in government spending without an increase in productivity will lead to inflation ✓✓
- If increases in government spending are financed by borrowing from financial institutions, large sums of money are placed into circulation – aggravating the demands in the economy's real capacity ✓✓
- Government uses three channels for increased spending:
- Infrastructure ✓ government may embark in capital projects, such as roads, housing and water ✓✓ the sizes of these projects outstrip the economy's capacity which will increase prices ✓✓
- Consumption expenditure ✓ most governments will at times increase expenditures on education and health ✓✓
- Social spending ✓ Governments sometimes feel they have to do something substantive about unemployment and poverty ✓✓ e.g. public work programmes ✓ such expenditures invariably leads to inflation because they add to aggregate demand without adding anything to aggregate supply ✓✓
- Export earnings (X) ✓
- Increases in earnings from exports can come from various sources:
- Foreign growth ✓ growth of the economies of trading partner countries may create a demand for a variety of locally produced goods ✓✓ the sales of exports bring money into the country ✓✓ demand increases without corresponding increases in supply – resulting in an increase in prices ✓✓
- Commodities demand ✓ the world's demand for commodities expands and contracts like business cycles do ✓✓ during an expansionary period foreign demand increases and this leads to greater volumes of exports ✓✓ the income earned from these exports adds to aggregate demand and prices increase ✓✓ (Max 26)
- Increases in earnings from exports can come from various sources:
ADDITIONAL PART
- The South African Reserve Bank (SARB) and the government apply certain monetary measures to curb inflation successfully ✓✓
- The SARB has successfully adjusted the quantity of money regularly to the needs of the economy (e.g. through open-market policy) thus maintaining a fine balance between the supply of goods and services and money supply ✓✓
- The SARB tries to curb inflation by adhering to the inflation target of 3 – 6%, but haven't always been successful (currently at the upper end) ✓✓
- The bank rate of the central bank (SARB) has always affected the interest rates in the economy (an increased repo rate) to encourage more savings or encourage credit granting (a decreased repo rate) ✓✓
- The SARB applies moral pressure (moral suasion) on financial institutions to be more careful when granting credit ✓✓ e.g. a lack of moral pressure from SARB caused Bank of Africa to be liquidized ✓ on the other hand SARB's division of bank supervision led to severe penalties on some of the major banks in South Africa ✓
(Accept any other correct relevant response) (Max. 10)
CONCLUSION
Money can be regarded as the most important driver of inflation; high volumes off money will lead to higher income, higher expenditure and higher inflation, therefor authorities should effectively control the country's money supply ✓✓
(Accept any other correct relevant response) (Max. 2)
[40]
TOTAL SECTION C: 40
GRAND TOTAL: 150
ECONOMICS PAPER 1 GRADE 12 MEMORANDUM - NSC PAST PAPERS AND MEMOS NOVEMBER 2016
ECONOMICS
PAPER ONE (P1)
GRADE 12
NSC EXAM PAPERS AND MEMOS
NOVEMBER 2016
MEMORANDUM
SECTION A (COMPULSORY)
QUESTION 1
1.1 MULTIPLE-CHOICE QUESTIONS
1.1.1 A – public ✓✓
1.1.2 B – product ✓✓
1.1.3 C – parastatals ✓✓
1.1.4 C – free-floating ✓✓
1.1.5 B – per capita income ✓✓
1.1.6 B – interest rates ✓✓
1.1.7 A – urbanisation ✓✓
1.1.8 B – corridor ✓✓ (8 x 2) (16)
1.2 MATCHING ITEMS
1.2.1 F – worldwide interaction of economies with trade as a common element ✓
1.2.2 E – a trade policy that encourages the production of locally manufactured goods to be sold abroad ✓
1.2.3 D – a common argument in favour of free trade ✓
1.2.4 G – a system of government that does not approve rules and therefore causes delays ✓
1.2.5 A – the rate banks are paying for lending money from the central bank ✓
1.2.6 H – measures prices of locally manufactured goods at factory level ✓
1.2.7 B – products traded in its basic form, for example coal and timber ✓
1.2.8 C – hampers the cognitive development of children ✓ (8 x 1) (8)
1.3 GIVE THE TERM
1.3.1 Business cycles ✓
1.3.2 Amplitude ✓
1.3.3 Ad valorem ✓
1.3.4 Employment Equity ✓
1.3.5 Terms of Trade ✓
1.3.6 Unemployment ✓ (6 x 1) (6)
(No abbreviations or examples are accepted)
TOTAL SECTION A: 30
SECTION B
Answer TWO of the three questions in this section in the ANSWER BOOK. QUESTION 2: MACROECONOMICS
2.1 Answer the following questions.
2.1.1 Name TWO types of business cycles.
- Kitchin ✓
- Jugler ✓
- Kuznets ✓
- Kondratieff ✓ (2 x 1) (2)
2.1.2 How will foreign direct investment benefit the South African economy?
- Provide capital for new enterprises/expansion on existing enterprises / increased competition ✓✓
- Increase in income/revenue for business/state / more profits ✓✓
- Creation of more job opportunities/improve standard of living ✓✓
- Increase economic growth ✓✓
- Diversify the economy / a wider range of products ✓✓
- Bring in new technology and knowledge ✓✓
(Accept any other correct relevant response) (1 x 2) (2)
2.2 DATA RESPONSE
2.2.1 Identify TWO indirect taxes in the cartoon above.
- Value-added tax (VAT) ✓
- Fuel levies ✓
- Sin tax ✓ (2 x 1) (2)
2.2.2 Name the fiscal instrument represented by the scale in the cartoon above.
Taxation ✓✓ (2)
2.2.3 What is the 'surprise' depicted in the cartoon above?
The Minister of Finance did not increase any income tax and VAT as expected / but the impact of the increase in fuel levies and excise duties were to such an extent that it made up for not increasing income tax and VAT ✓✓
(Accept any other correct relevant response) (2)
2.2.4 In your opinion, why did the Minister of Finance decide to keep income tax and VAT at the same levels?
- Due to increased income tax in 2014/15 he didn't want to over burden the tax payers ✓✓
- To prevent a negative reaction from the labour force which is constantly demanding higher wages ✓✓
- VAT as a regressive type of taxation remained the same to prevent the poor from becoming poorer ✓✓
- To prevent loss of income through tax evasion and disincentive to work ✓✓
- To stimulate consumer spending and economic growth ✓✓
(Accept any other correct relevant response) (2 x 2) (4)
2.3 DATA RESPONSE
2.3.1 Identify the reason in the extract why South Africa agreed to import chicken from the US.
South Africans consume more chicken than people in any other African country / Local producers have struggled to keep up with the rising demand / to smooth the passage of AGOA ✓ (1)
2.3.2 Name the trade initiative mentioned above.
African Growth and Opportunity Act (AGOA) ✓ (1)
2.3.3 Briefly describe the term dumping.
Selling goods in a foreign market at prices that are below the cost of production in the country of origin ✓✓
(Accept any other correct relevant response) (2)
2.3.4 What will be the effect of population growth in South Africa on chicken imports from the US?
An increase in the population will cause an increase in the demand for chicken pieces from the US and imports will rise ✓✓
(Accept any other correct relevant response) (2)
2.3.5 What negative impact could this deal have on the local poultry industry?
- The local poultry industry may experience consumer's resistance against the product due to a low quality of import cuts / switch to other types of meat consumption ✓✓
- The local poultry industry may experience an oversupply in the product during certain periods which might lead to low prices, leading to less income to industry ✓✓
- Local producers leaving the industry because of losses due to unfair competition / low prices and high inputs ✓✓
(Accept any other correct relevant response) (2 x 2) (4)
2.4 Distinguish between exogenous approaches and endogenous approaches to business cycles.
Endogenous approach:
- This follows the belief that economic growth is primarily the result of endogenous and not external forces ✓✓
- This is often called the Keynesian view. This approach holds the view that markets are inherently unstable and therefore government intervention may be required ✓✓
- The price mechanism fails to co-ordinate demand and supply in markets and this gives rise to upswings and downswings ✓✓
- Prices are not flexible enough ✓✓ (e.g. wages) ✓
- A business cycle is an inherent feature of a market economy ✓✓
- Indirect links or mismatches between demand and supply are normal features of the economy ✓✓ (Max 4)
Exogenous approach:
- Refer to those independent factors that can influence business cycles and originate outside the economy ✓✓
- Some economists believe that business cycles are caused by exogenous factors such as those described below ✓✓
- The monetarists believe markets are inherently stable and disequilibrium is caused by incorrect use of policies, e.g. monetary policy ✓✓
The following are examples:
- Weather conditions and shocks cause upswings and downswings ✓ • Governments should not intervene in the market ✓
- Sunspot theory based on the belief that increased solar radiation causes changes in weather conditions ✓
- Technological changes ✓
(Accept any other correct relevant response)
(A maximum of 1 mark for examples per approach) (Max 4) (8)
2.5 How can imports be targeted to reduce the deficit on the balance of trade in South Africa?
- South Africa can use import substitution as part of their international trade policy ✓✓
- Tariffs can be imposed on imported goods, which will increase the prices of imported goods for domestic consumers, and that will tend to shift demand from imports to domestic products ✓✓ e.g. customs duties, ad valorem tariffs, specific tariffs ✓
- Quotas can be imposed to limit the import of goods and services ✓✓
- Subsidies will make local producers more competitive and switch from imported goods to locally produced goods ✓✓
- Through exchange control government can reduce imports and limit the amount of foreign exchange made available to those who wish to import ✓✓
- Physical control may put a complete ban or embargo on the import of certain goods from a particular country ✓✓
- Trade can be diverted through monetary deposits, time-consuming customs procedures and high-quality standards are imposed to make the importing of goods more difficult ✓✓ (Max 8) (8)
[40]
QUESTION 3: ECONOMIC PURSUITS
3.1 Answer the following questions.
3.1.1 Name TWO social indicators related to income distribution.
- Lorenz curve ✓
- Gini Coefficient ✓
- Quintile Ratio ✓
- Head Count Index ✓
- Human Development Index ✓
- Poverty line / poverty gap ✓
(Accept any other correct relevant response) (2 x 1) (2)
3.1.2 How can deregulation benefit the business sector of South Africa?
- By opening up opportunities for formerly excluded businesses to participate in the formal economy/Helping with entrance of new economic players in the economy / More businesses (more competition) benefits the business sector / efficiency of businesses will increase ✓✓
- By providing easy access to markets ✓✓
- By Simplifying administrative processes/red-tape / businesses interact directly with consumers without state interference ✓✓
(Accept any other correct relevant response) (1 x 2) (2)
3.2 DATA RESPONSE
3.2.1 Identify any TWO previous strategies in the information above that were used to improve economic growth in South Africa.
- GEAR – Growth Employment and Redistribution ✓
- NGP – New Growth Path ✓
- NSDS – National Skills Development Strategy ✓ Any (2 x 1) (2)
3.2.2 State the main aim of the NDP.
It provides a road map to government for 2030 / poverty relief / economic growth / economic transformation / sustainable job opportunities / income distribution ✓✓
(Accept any other correct relevant response) (2 )
3.2.3 What negative impact will the NDP have on the taxpayers?
For implementation of the NDP the state will increasingly need more revenue – more and higher taxation will be needed / reduce disposable income even more / higher levels of fraud and corruption affecting services to the poor ✓✓
(Accept any other correct relevant response) (2)
3.2.4 In your opinion, how successful will the implementation of the NDP be in the South African economy?
The implementation of NDP will be successful due to the following reasons:
- A good progress has been made since 2014 in the construction of renewable energy sources ✓✓ e.g. solar farms and wind farms ✓
- Standard of living might improve that will reduce poverty levels ✓✓ e.g. housing, social grants ✓
AND / OR
The implementation of NDP will not be successful due to the following reasons: - Since 2014 there has been no improvement in the unemployment rate and this scenario might continue to exist ✓✓ e.g. unemployment might increase even further ✓
- The gap between rich and poor might increase further ✓✓
The following targets set out in the NDP will be difficult to reach: - an economic growth rate of 5% (currently 0,8%) ✓ job creation of 5 million per annum ✓
(Accept any other correct relevant response) (4)
3.3 DATA RESPONSE
3.3.1 What happened to the standard of living of South Africans between 1996 and 2015?
It improved ✓ (1)
3.3.2 Identify an element of the Human Development Index (HDI) in the information above.
Standard of living ✓ (1)
3.3.3 What can the government do to improve the quality of service delivery even further?
The government should:
- Accept accountability and give account for their actions and expenditures ✓✓
- Improve on efficiency by appointing competent high skilled people ✓✓
- Operate according to market forces ✓✓
- Privatise those corporations that are not profitable ✓✓✓
- Assessing the needs of people ✓✓
- Put a stop to corruption / Prevent nepotism / poor management ✓✓
- Utilise the available resources more efficiently e.g. budgets ✓✓
- Practise transparency and consultation ✓✓
(Accept any other correct relevant response) Any (1 x 2) (2)
3.3.4 How can the private sector get involved through public-private partnerships to strengthen the efforts of government?
The private sector can:
- Accept responsibility for a clean environment (street and pavement) to reduce the workload of municipalities ✓✓
- Improve the skills of their workforce through in service training without any cost for tertiary training by government ✓✓
- Offer various initiatives to government and pay for it to uplift the state of the environment, and reduce government's involvement and responsibility ✓✓ Corporate Social Investment ✓
(Accept any other correct relevant response) Any (1 x 2) (2)
3.3.5 In your opinion, how can labour market access drive future improvement in living standards?
The following can improve the access into the labour market aimed at improved living standards:
- A better standard of basic education will improve skills needed to better the development of industry in general ✓✓ e.g. building and construction, tourism, health, service delivery ✓Proper training will ensure more people access to the job market, because they will be able to offer much needed initiative and originality to keep the business competitive in a fast changing market ✓✓
(Accept any other correct relevant response) Any (2 x 2) (4)
- A better standard of basic education will improve skills needed to better the development of industry in general ✓✓ e.g. building and construction, tourism, health, service delivery ✓Proper training will ensure more people access to the job market, because they will be able to offer much needed initiative and originality to keep the business competitive in a fast changing market ✓✓
3.4 Briefly discuss growth and trade as globalisation challenges that face developing countries.
Growth
- Inefficiencies in management/governance leads to inefficient allocation of recourses ✓✓
- It resulted in low levels of production and subsequently low levels in economic growth ✓✓ (Max 4)
Trade
- Rich countries subsidise production and make it difficult for poorer/ developing countries to compete/many developing countries feel they are marginalised ✓✓
- These countries have to accept low prices at relatively high input costs ✓✓ (Accept any other correct relevant response) (Max 4) (8)
3.5 How does South Africa comply with various international bodies that require them to standardise their indicators?
- IMF ✓ South Africa's annual budget review is compiled in terms the IMF's Government Finance Statistics (GFS) that focuses on public finance accounting ✓✓
- WORLD BANK ✓ Requires countries to report on various economic and social indicators which South Africa conforms to ✓✓ These indicators are collected and published by The World Bank group of institutions in the World Development Indicators and the African Development Indicators ✓✓. It assists the World Bank in deciding on how much loans it can make available to countries for development purposes ✓✓
- United Nations ✓ South Africa conforms to the UN system in compiling their national accounts e.g. GDP statistics ✓✓ The United Nation's best known guide of economic indicators in the UN's System of National Accounts (SNA) ✓✓ e.g. changes to the Balance of Payments by the SARB ✓✓ This allows the IMF to decide how much it can make available to correct BOP deficit ✓✓ (Max 8) (8)
[40]
QUESTION 4: MACROECONOMICS AND ECONOMIC PURSUITS
4.1 Answer the following questions.
4.1.1 Give TWO reasons for public sector failure.
- Management failure ✓
- Apathy ✓
- Lack of motivation ✓
- Bureaucracy ✓
- Politicians ✓
- Structural weaknesses ✓
- Special interest group ✓ (2 x 1) (2)
4.1.2 How will a decrease in export prices affect our country's terms of trade?
It would be negatively affected because our revenue received from exports will decline ✓✓
(Accept any other correct relevant response) (1 x 2) (2)
4.2 DATA RESPONSE
4.2.1 What market is depicted in the graph above?
Foreign Exchange market/Currency market ✓ (1)
4.2.2 What effect does the shift in the demand curve have on the price of dollars?
The price of dollars will increase/appreciate ✓ (1)
4.2.3 Briefly describe the term exchange rate.
The price of one currency expressed in terms of another ✓✓ (2)
4.2.4 What will the effect of the new price for dollars be on export trade between South Africa and the United States?
Exports from South Africa will increase / more South African goods can be purchased at the same price because of the depreciation of the rand/ appreciation of the dollar ✓✓ (2)
4.2.5 Explain how an increase in the number of US tourists to South Africa will influence the value of the rand.
- More US tourists in South Africa means a higher demand for ZAR / The supply of dollars will also increase ✓✓
- That will result in an increase in the value of the rand ✓✓ (2 x 2) (4)
4.3 DATA RESPONSE
4.3.1 Give TWO factors in the extract above that contributed to the poor performance of the South African economy.
- Slump in commodity price ✓
- Weakening demand from China ✓
- Drought ✓
- Plunging value of the rand ✓ Any (2 x 1) (2)
4.3.2 When is a country officially in a recession?
When the country experiences a negative economic growth rate for two consecutive quarters ✓✓ (2)
4.3.3 What impact will a downgrading of South Africa's credit rating have on its economy?
- Down grading implies a bigger risk for investors which might lead to an increase in interest rates ✓✓
- The fact that South Africa who have very high levels of debt will have to pay higher interest rates which will definitely impact on the lower income groups who will not be able to afford goods and services ✓✓
- There will be less money available for spending, that will put more pressure on the budget, the tax payer as well as social grants and infrastructure development ✓✓
- A poor credit rating might increase poverty that will drive a lower standard of living which might lead to a recession ✓✓
(Accept any other correct relevant response) (2)
4.3.4 In your opinion, what can government do to stabilise the business cycle?
- The government can get involved in the smoothing of cycles through monetary and fiscal policy measures ✓✓
- The government can apply supply and demand side policies to stabilise prices ✓✓
- The government might take measures to influence the aggregate demand that will stimulate consumer spending ✓✓
- The government might take measures to influence the level of aggregate supply and lead to an increase in domestic production and lower inflation pressure ✓✓
(Accept any other correct relevant response) Any (2 x 2) (4)
4.4 Briefly discuss any TWO arguments in favour of privatisation.
- Privatisation ensures additional funds (income) for government ✓✓ this will help them to maintain and manage state-owned enterprises ✓✓
- The tax base will be broadened ✓✓creating more income for government ✓✓
- Private enterprises are more efficient than public enterprises ✓✓ The profit motive in the private sector ensures that firms operate efficiently and at the lowest possible price ✓✓ SOE's – are bureaucratic, inefficient, unresponsive to consumer needs, poorly managed, uncreative with low levels of productivity ✓✓
- Privatisation attracts more foreign investors to South Africa ✓✓ capital, skills, technology and foreign exchange flows into the country ✓✓
- Privatisation relieves pressures from the budget ✓✓ deficits on the budget will decrease ✓✓
- Promote black economic empowerment ✓✓ shares in public companies can be made available to black entrepreneurs ✓✓ Any (2 x 4) (8)
4.5 How will subsidies influence export-orientated businesses negatively?
- By subsidising certain industries, capital and entrepreneurial talents are drawn away from other businesses who enjoyed a comparative advantage ✓✓
- Subsidies reduce the total cost of production which gives businesses a false indication of the real price (distorted prices) ✓✓
- Local production can be inefficient, because local producers are shielded from overseas competition ✓✓
- Businesses that become too dependant on subsidies will not be able to survive once the subsidies are withdrawn ✓✓
- Subsidies allow businesses to charge lower prices which edge other export competitive industries out of the market ✓✓
- Foreign countries may impose tariffs on subsidized products from other countries to benefit their own industries ✓✓ Max (8) (8)
[40]
TOTAL SECTION B: 80
SECTION C
Answer any ONE of the two questions in this section in the ANSWER BOOK. Your answer will be assessed as follows:
STRUCTURE OF ESSAY | MARK ALLOCATION |
Introduction | Max. 2 |
Body | Max. 26 Max. 10 |
Conclusion
| Max. 2 |
TOTAL | 40 |
QUESTION 5: MACROECONOMICS
The circular-flow model shows how the economy works via the various markets.
- Discuss the role of the various markets in the circular flow without the use of a diagram. (26 marks)
- Explain the multiplier concept with the aid of a well-labelled graph. (10 marks)
[40]
INTRODUCTION
- The circular flow model is a simplified representation of the interaction between the participants of the economy ✓✓/
- Markets coordinate economic activities and determine prices for goods and services ✓✓
(Accept any other relevant introduction) Max (2)
MAIN PART
Goods/Product/Output markets ✓
These are markets for consumer goods and services ✓✓
In economics a distinction is made between goods and services:
- Goods are defined as any tangible items such as food, clothing and cars that satisfy some human wants or need ✓✓
- Buying and selling of goods that are produced in markets e.g.
- Capital goods market for trading of buildings and machinery ✓✓
- Consumer goods market for trading of durable consumer goods, semi-durable consumer goods and non-durable consumer goods ✓✓
- Services are defined as non-tangible actions and includes wholesale and retail, transport and financial markets ✓✓
Factors/Resources/Input markets ✓
- Households sell factors of production on the markets: rent for natural resources, wages for labour, interest for capital and profit for entrepreneurship ✓✓
- The factor market includes the labour, property and financial markets ✓✓
Financial markets: ✓
- They are not directly involved in production of goods and services, but act as a link between households, the business sector and other participants with surplus funds ✓✓
- E.g. banks, insurance companies and pension funds ✓
Money markets ✓
- In the money market, short term loans and very short term funds are saved and borrowed by consumers and business enterprises ✓✓
- Products sold in this market are bank debentures, treasury bills and government bonds ✓✓
- The SARB is the key institution in the money market ✓✓
Capital markets ✓
- In the capital market long term funds are borrowed and saved by consumers and business enterprises ✓✓
- The Johannesburg Security Exchange is a key institution in the capital market ✓✓
- Products sold in this market are mortgage bonds and shares ✓✓
Foreign exchange markets ✓
- On the foreign exchange market businesses buy/sell foreign currencies to pay for imported goods and services ✓✓
- These transactions occur in banks and consists of an electronic money transfer from one account to another ✓✓
- The most important foreign exchange markets are in London/New York/Tokyo ✓✓
- The S.A Rand is traded freely in these markets ✓✓ e.g. when a person buys travellers cheques to travel abroad ✓
Flows ✓
- Flows of private and public goods and services are real flows and they are accompanied by counter flows of expenditures and taxes on the product market ✓✓
- Factor services are real flows and they are accompanied by counter flows of income on the factor market ✓✓
- Imports and exports are real flows and they are accompanied by counter flows of expenditure and revenue on the foreign exchange market ✓✓
| If candidates discussed only ONE market, a maximum of 14 marks. If candidates discussed only TWO markets, a maximum of 20 marks. If candidates discussed THREE or more markets, the maximum of 26 marks. Allocate a maximum of 8 MARKS for lower order elements, inclusive of headings, sub-headings or examples. |
ADDITIONAL PART
Explain the multiplier concept with the aid of a well-labelled graph. 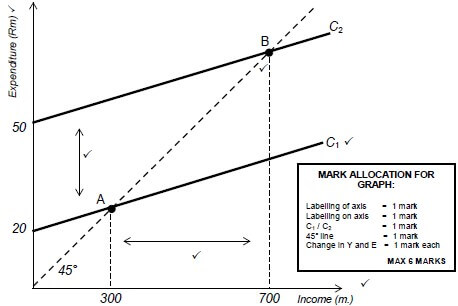
MARK ALLOCATION FOR GRAPH: Labelling of axis = 1 mark MAX 6 MARKS |
- The multiplier describes the fact that changes in spending/expenditure have an impact on income that is greater than the original change in spending ✓✓
- Expenditure/spending increase from 20 to 50 (expenditure change by 30) which causes an increase in income from 300 to 700 (Income change by 400) ✓✓
- ∆Y / ∆J = 400 / 30 = 13.3 ✓✓
- Therefore for each R1 increase in expenditure the aggregate income will rise by R13,30 ✓✓ Max (6) (Max 10)
CONCLUSION
Markets are critically important institutions in our economic system, because they regulate supply and demand and safeguard price stability and general business confidence ✓✓ Max (2)
[40]
QUESTION 6: ECONOMIC PURSUITS
Government actions encourage operations and new investments to boost industrial development.
- Discuss South Africa's Spatial Development Initiatives (SDIs), highlighting its initiatives, objectives and Industrial Development Zones (IDZs). (26 marks)
- What advice would you give government to promote industrial development in South Africa? (10 marks) [40]
INTRODUCTION
Regional development refers to policies which are aimed at increasing the economic livelihood op specific areas or regions ✓✓
(Any other relevant introduction) Max (2)
MAIN PART
Spatial Development Initiatives
- SDI is a policy to promote sustainable industrial development in areas where poverty and unemployment are at their highest ✓✓
- It can be defined as a link between important economic hubs and regions in a country ✓✓
- The intention was to grow the SDI's mostly through private sector investment ✓✓
- The state was to enhance inward investment through the granting of incentives ✓✓
- The Public Private Partnerships, promotes the economic potential of underdeveloped areas ✓✓
- In a PPP a private business may provide the capital to build the factory and to buy raw materials and employ labour, while the government provides the capital for the infrastructure ✓✓ e.g. roads and water ✓
- There are 2 types of PPPs which are compensated differently: unitary payments and user-fees ✓✓
- The SDI involves an interdepartmental investment strategy that the DTI and the Department of Transport (DOT) lead ✓✓
Objectives of Spatial Development Initiatives - Develop physical infrastructure such as roads and harbours ✓✓
- Stimulate economic activities in the underdeveloped areas ✓✓
- Create employment and stimulate economic growth in the underdeveloped areas ✓✓
- Develop inherent economic potential in the under developed areas ✓✓
- Attract private sector and foreign direct (FDI) investment ✓✓
- Establish Public Private Partnerships (PPP) ✓✓
Corridors ✓ - These are spatial areas that offer specific advantages to mining, manufacturing and other businesses ✓✓
- The advantages also include the presence of existing infrastructure and the specialisation of products or services ✓✓
- These corridors are development areas within South Africa and are the development priorities of all development agencies ✓✓
- The DTI provides help in support of the development corridors ✓✓
- E.g. Maputo corridor that starts in Gauteng and extends through Mpumalanga to the Maputo port ✓✓
The above discussion includes:
- the initiatives and
- objectives of the SDIs
- and Corridors. (Max 18)
Industrial Development Zones (IDZs)
- They are purpose-built industrial estates, physically enclosed and linked to a port or airport ✓✓
- They are in duty-free import areas ✓✓
- This strategy was aimed at making exports internationally competitive ✓✓
- They focus on creating jobs and promoting exports ✓✓
- The idea is that goods produced in these zones should be exported to foreign countries ✓✓
- As services are provided from outside, the economy in the areas should be stimulated ✓
- An IDZ offers a world-class infrastructure, enjoys a zero rate of VAT on supplies from South African sources and reduced taxation on some products ✓✓
Special Economic Zones ✓
- It creates a basis for a broader range of industrial parks and provide economic infrastructure to promote employment ✓✓
- It was introduced because of the limitations of the IDZs and need not be linked to a port of airport ✓✓
- IDZs are only created for export industries while the SEZs cater for exports and domestic consumption ✓✓
- Geographically demarcated area where specific economic activities have been identified to be developed ✓✓
- These areas may enjoy incentives such as tax relief ✓✓ e.g. 15% incentive to attract new industries ✓
The above discussion includes:
- IDZs
- and SEZs (Max 14)
Allocate a maximum of 8 MARKS for lower order elements, inclusive of headings, sub-headings or examples.
| Also allocate marks for the following: Small Business Support Program, Seda Technology Program, Duty Free Incentives, Foreign Investment Incentives and Services to Business Processes, Infrastructure Plan, Strategic Integrated Projects, Critical Infrastructure Programme, Skills Development Programme, Customs free incentives, Foreign investment incentives, Services to business processes |
ADDITIONAL PART
The government can be advised to:
- offer incentives to domestic and foreign entrepreneurs who establish new businesses in South Africa ✓✓
- pay incentives that will create an investor friendly environment for foreign direct investment to flow into the country ✓✓
What the government can do to promote industrial development:- Provide tax incentives and relief for the young industries ✓✓
- Develop a user-friendly labour regime for the country that both employer employee sensitive at the same promoting growth and development ✓✓
- Provide funding schemes for upstart businesses for support growth and development ✓✓
- Provide skills development programmes and offer cash grants as incentives to those who engage in this capacity development programmes ✓✓
- Critical Infrastructure Facilities (CIF)
- The government specify financial incentives in the form of a cash grant of up to 50% to large enterprises requiring critical infrastructure such as roads, electricity water and purification services ✓✓
- All these incentives are aimed at encouraging the development of businesses to support the state's effort to promote industrial development ✓✓
(Accept any other correct relevant answer) Max (10)
CONCLUSION
Despite all the efforts from government it would be important to see a more rapid growth in this area of the economy, there are still too many poor people in South Africa without a job. The industrial sector is earmarked as safety net for the millions of jobless people in the rural areas ✓✓
(Accept any other correct relevant response) Max (2)
[40]
TOTAL SECTION C: 40
GRAND TOTAL: 150