Adele
LIFE SCIENCES PAPER 1 GRADE 12 MEMORANDUM - AMENDED SENIOR CERTIFICATE EXAMS PAST PAPERS AND MEMOS MAY/JUNE 2018
LIFE SCIENCES
PAPER 1
GRADE 12
AMENDED SENIOR CERTIFICATE EXAMS
PAST PAPERS AND MEMOS
MAY/JUNE 2018
PRINCIPLES RELATED TO MARKING LIFE SCIENCES
- If more information than marks allocated is given
Stop marking when maximum marks is reached and put a wavy line and 'max' in the right-hand margin. - If, for example, three reasons are required and five are given
Mark the first three irrespective of whether all or some are correct/ incorrect. - If whole process is given when only a part of it is required
Read all and credit the relevant part. - If comparisons are asked for but descriptions are given
Accept if the differences/similarities are clear. - If tabulation is required but paragraphs are given
Candidates will lose marks for not tabulating. - If diagrams are given with annotations when descriptions are required
Candidates will lose marks. - If flow charts are given instead of descriptions
Candidates will lose marks. - If sequence is muddled and links do not make sense
Where sequence and links are correct, credit. Where sequence and links are incorrect, do not credit. If sequence and links become correct again, resume credit. - Non-recognised abbreviations
Accept if first defined in answer. If not defined, do not credit the unrecognised abbreviation but credit the rest of the answer if correct. - Wrong numbering
If answer fits into the correct sequence of questions but the wrong number is given, it is acceptable. - If language used changes the intended meaning
Do not accept. - Spelling errors
If recognisable, accept the answer, provided it does not mean something else in Life Sciences or if it is out of context. - If common names are given in terminology
Accept, provided it was accepted at the national memo discussion meeting. - If only the letter is asked for but only the name is given (and vice versa)
Do not credit. - If units are not given in measurements
Candidates will lose marks. Marking guidelines will allocate marks for units separately. - Be sensitive to the sense of an answer, which may be stated in a different way.
- Caption
All illustrations (diagrams, graphs, tables, etc.) must have a caption. - Code-switching of official languages (terms and concepts) A single word or two that appear(s) in any official language other than the learners' assessment language used to the greatest extent in his/her answers should be credited if it is correct. A marker that is proficient in the relevant official language should be consulted. This is applicable to all official languages.
- Changes to the marking guidelines
No changes must be made to the marking guidelines without consulting the provincial internal moderator who in turn will consult with the national internal moderator (and the Umalusi moderators where necessary). - Official marking guidelines
Only marking guidelines bearing the signatures of the national internal moderator and the Umalusi moderators and distributed by the National Department of Basic Education via the provinces must be used.
MEMORANDUM
SECTION A
QUESTION 1
1.1
1.1.1 C✓✓
1.1.2 A✓✓
1.1.3 C✓✓
1.1.4 A✓✓
1.1.5 C✓✓
1.1.6 D✓✓
1.1.7 C✓✓
1.1.8 B✓✓
1.1.9 B✓✓ (9 x 2) (18)
1.2
1.2.1 Endocrine✓
1.2.2 Monoculture✓
1.2.3 Spermatogenesis✓
1.2.4 Prolactin✓
1.2.5 Thorns✓
1.2.6 Carbon footprint✓
1.2.7 Tropism✓ (7)
1.3
1.3.1 Both A and B✓✓
1.3.2 A only✓✓
1.3.3 B only✓✓ (3 x 2) (6)
1.4
1.4.1 Reflex arc✓ (1)
1.4.2
- B - Motor✓ neuron/multipolar neuron/efferent neuron (1)
- C - Interneuron✓/connector neuron (1)
- E - Sensory✓ neuron/unipolar neuron/afferent neuron (1)
1.4.3
- F✓ (1)
- A✓ (1)
1.4.4
- D✓ - Synapse✓ (2)
- G✓ - Myelin sheath✓ (2) (10)
1.5
1.5.1 Anaphase II✓ (1)
1.5.2
- Centriole✓ (1)
- Centromere✓ (1)
- Spindle fibre✓ (1)
1.5.3 The chromatids separate✓/centromere splits (1)
1.5.4 Crossing over✓ (1)
1.5.5 Reduces genetic variation✓ (1)
1.5.6
- Four✓/4 (1)
- 23✓ (1) (9)
TOTAL SECTION A: 50
SECTION B
QUESTION 2
2.1
2.1.1
- Corpus luteum✓
- Placenta✓ (2)
(Mark first TWO only)
2.1.2 Progesterone levels are increasing✓ (1)
2.1.3
- High levels of progesterone✓
- inhibits/causes a decrease in the secretion of FSH✓ (2)
2.1.4 To prevent the growth of a new follicle✓/ovulation during the pregnancy (1)
2.1.5
- 39,5 – 21,6✓ = 17,9
17,9 × 100✓ = 82,87✓/82,9/83% (3)
21,6
2.1.6
-
- The endometrium/uterine lining/placenta will not be maintained✓
- Menstruation will begin✓/the placenta will detach/ she will have a miscarriage (2)
- Give the woman progesterone supplements✓ (1) (12)
2.2
2.2.1 Methane✓/CH4 (1)
2.2.2 Used as a fuel✓/cooking/heating/light/electricity
(Mark first ONE only) Any (1)
2.2.3
- Reduce pests✓/rats/flies
- Reduce bad smells✓/pollution
- To promote decomposition✓
(Mark first ONE only) Any (1)
2.2.4 It is full✓/It has reached ground level
(Mark first ONE only) (1)
2.2.5
-
- Golf course✓
- Recreational park✓
- Car park✓
- Forestry✓
(Mark first TWO only) Any (2)
-
- Reuse✓ waste materials
- Recycle✓ waste materials
- Reduce the amount of waste produced✓
- Manufacture more products that can be recycled✓
(Mark first TWO only) Any (2) (8)
2.3
2.3.1
- Cerebellum✓ (1)
- Cerebrum✓ (1)
2.3.2 Organ of Corti✓ (1)
2.3.3
- The semi-circular canals/part A contain fluid✓ /endolymph which moves when the person moves✓
- There are cristae✓/receptors present which convert the stimulus to an impulse✓/are sensitive to the movement of the fluid
- The canals lie on three different planes✓ to detect movement in any direction✓
(Mark first TWO only) Any 2 x 2 (4) (7)
2.4
2.4.1
- Choroid✓ (1)
- Sclera✓ (1)
2.4.2
- The person cannot see✓/is blind in that eye/has no binocular vision
- because the impulses from the retina cannot be transmitted to the cerebrum✓ from one eye (2)
2.4.3
- The circular muscles of part A/the iris contract✓
- and the radial muscles relax✓
- making the pupil smaller✓/constricting the pupil
- so that less light enters the eye✓ (4)
2.4.4
-
- Accommodation will not occur✓
- The refractive power of the lens is low✓/lens cannot become more convex
- and light rays are not refracted/bent enough✓
- and would not be focussed onto the retina✓/would be focussed behind the retina/a clear image would not be formed on the retina
- Therefore the person cannot focus on objects that are closer than 6m✓/the person can only focus on distant objects
Any (4)
- Convex✓/biconvex (1) (13) [40]
QUESTION 3
3.1
3.1.1 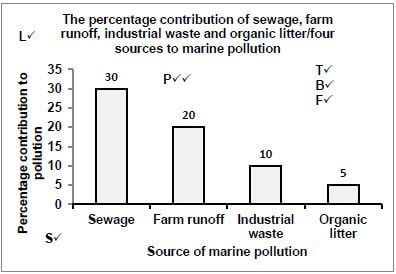
Mark allocation of the graph
Criteria | Mark Allocation |
Title of graph (T) including both variables | 1 |
Bar graph drawn (B) | 1 |
Correct scale for X-axis (equal width and spacing of the bars) and Y-axis (S) | 1 |
Correct label and unit for X-axis and Y axis (L) | 1 |
Only the correct four bars have been plotted (F) | 1 |
Plotting of the bars (P) | 0: No bars plotted correctly |
NOTE:
- If a line graph is drawn – marks will be awarded for the 'title and label for X and Y axes' only
- If a histogram is drawn – marks will be lost for the 'type of graph and correct scale' only (7)
3.1.2
- The sewage/organic litter contains nutrients✓
- The amount of nutrients in the water increases✓/eutrophication occurs
- causing an algal bloom✓
- The algae cover the surface of the water✓/blocks out sunlight
- causing water plants to die✓
- thereby reducing photosynthesis✓
- and increasing decomposition✓ thus reducing the oxygen content of the water Any (4) (11)
3.2
3.2.1 Adrenalin✓ (1)
3.2.2
- Increases the heart rate✓
- Increases blood pressure✓
- Stimulates the conversion of glycogen into glucose✓
- Increases the blood supply to the heart✓/skeletal muscles
- Decreases blood flow to the digestive system✓
- Decreases blood flow to the skin✓
- Increases muscle tone✓
- Increases the rate/depth of breathing✓
- Increases the rate of respiration✓/metabolism
- Dilates/increases the diameter of the pupils✓
(Mark first THREE only) Any (3) (4)
3.3
- Blood glucose levels rise✓ above normal
- The pancreas✓/islets of Langerhans
- secretes insulin✓ into the blood
- which travels to the liver✓/muscle cells
- and stimulates them to absorb glucose✓ from the blood
- and to convert the excess glucose into glycogen✓
- which decreases the blood glucose levels✓ to normal Any (5)
3.4
3.4.1
- Volume of urine✓ (1)
-
- Decide on a time✓/date/place to conduct the investigation
- Decide on the apparatus✓/materials that need to be used
- Decide how to record the data✓
- Decide on the number of participants to include✓
- Decide what factors to keep constant✓/example of factor to be kept constant
- Decide on the composition of the sample✓
- Develop an indemnity form for the participants to sign✓
- Recruit✓/get permission from volunteers to participate
(Mark first TWO only) Any (2)
-
- The same room✓/environment/temperature
- The same apparatus✓
- The same investigator✓
- No other liquid intake by both groups✓
- Same type of beer✓
(Mark first TWO only) Any (2)
-
- They used a large sample✓/12 men/6 men in each group
- The average volume of urine produced was calculated✓ (2)
(Mark first TWO only)
3.4.2
- Alcohol inhibits/reduces the secretion of ADH✓
- causing the renal tubules✓/distal convoluted tubules and collecting ducts
- to become less permeable to water✓
- Less water is reabsorbed✓ back into the blood
- A larger volume of urine is produced✓ Any (4) (11)
3.5
3.5.1 To ensure unilateral light✓/the plant receives light from one direction only (1)
3.5.2 Auxins✓/IAA/indole acetic acid (1)
3.5.3 Differences between plants A and B after two weeks
T✓
Plant A | Plant B |
The stem of the plant will bend towards the light✓ | The stem of the plant will remain straight✓/will not bend towards the light |
Does not have lateral branches✓/only lower lateral branches will start to grow | All the lateral branches will grow✓along the whole stem |
The plant will be taller✓ | The plant will be shorter✓ |
(Mark first TWO only) 1 table (T) + (2 x 2) (5)
3.5.4
- The gibberellins cause the stem/plant to grow longer✓/taller
- because gibberellins stimulate the elongation/growth of the internodes✓ (2) (9) [40]
TOTAL SECTION B: 80
SECTION C
QUESTION 4
Gaseous exchange in amniotic eggs (A)
- Gases move by diffusion✓
- into and out of the egg✓
- through the porous shell✓/allantois/chorion
Nourishment of the embryo in amniotic eggs
- The egg contains yolk✓/albumin
- which provide nutrients✓ to the embryo Max (4)
Gaseous exchange and nourishment of the foetus in humans (F)
- In the placenta✓
- the mothers blood comes into close contact with the foetal blood✓
- Oxygen✓
- and nutrients✓
- diffuse from the mothers blood into the foetal blood✓
- in the umbilical veins✓
- This nutrient rich blood is carried to the foetus through the umbilical cord✓
- Carbon dioxide diffuses from the foetal blood✓
- in the umbilical artery✓
- into the maternal blood✓ Max (7)
Protection of the foetus in humans (P)
- The foetus develops inside the uterus✓
- and is protected by the mothers body✓
- Antibodies from the mothers blood✓
- pass into the foetus' blood and provide immunity✓
- The placenta acts as a microfilter✓
- preventing toxins from the mother entering the foetal blood✓
- The foetus is enclosed in the amnion✓
- which contains amniotic fluid✓
- The amniotic fluid provides protection against dehydration✓
- and acts as a shock absorber✓
- It provides a suitable temperature✓ for the developing embryo
Max (6)
Content: (17)
Synthesis: (3)
(20)
ASSESSING THE PRESENTATION OF THE ESSAY
Relevance | Logical sequence | Comprehensive |
All information provided is relevant to the question | Ideas arranged in a logical/ cause-effect sequence | Answered all aspects required by the essay in sufficient detail |
All the information provided is relevant to:
There is no irrelevant information | All the information regarding the:
| At least the following points should be included:
|
1 mark | 1 mark | 1 mark |
TOTAL SECTION C: 20
GRAND TOTAL: 150
LIFE SCIENCES PAPER 2 GRADE 12 MEMORANDUM - AMENDED SENIOR CERTIFICATE EXAMS PAST PAPERS AND MEMOS MAY/JUNE 2018
LIFE SCIENCES
PAPER 2
GRADE 12
AMENDED SENIOR CERTIFICATE EXAMS
PAST PAPERS AND MEMOS
MAY/JUNE 2018
PRINCIPLES RELATED TO MARKING LIFE SCIENCES
- If more information than marks allocated is given
Stop marking when maximum marks is reached and put a wavy line and 'max' in the right-hand margin. - If, for example, three reasons are required and five are given
Mark the first three irrespective of whether all or some are correct/incorrect. - If whole process is given when only a part of it is required
Read all and credit the relevant part. - If comparisons are asked for, but descriptions are given
Accept if the differences/similarities are clear. - If tabulation is required, but paragraphs are given
Candidates will lose marks for not tabulating. - If diagrams are given with annotations when descriptions are required
Candidates will lose marks. - If flow charts are given instead of descriptions
Candidates will lose marks. - If sequence is muddled and links do not make sense
Where sequence and links are correct, credit.
Where sequence and links are incorrect, do not credit.
If sequence and links become correct again, resume credit. - Non-recognised abbreviations
Accept if first defined in answer. If not defined, do not credit the unrecognised abbreviation, but credit the rest of the answer if correct. - Wrong numbering
If answer fits into the correct sequence of questions, but the wrong number is given, it is acceptable. - If language used changes the intended meaning
Do not accept. - Spelling errors
If recognisable, accept the answer, provided it does not mean something else in Life Sciences or if it is out of context. - If common names are given in terminology
Accept, provided it was accepted at the national memo discussion meeting. - If only the letter is asked for, but only the name is given (and vice versa)
Do not credit. - If units are not given in measurements
Candidates will lose marks. Marking guidelines will allocate marks for units separately. - Be sensitive to the sense of an answer, which may be stated in a different way.
- Caption
All illustrations (diagrams, graphs, tables, etc.) must have a caption. - Code-switching of official languages (terms and concepts) A single word or two that appear(s) in any official language other than the learner's assessment language used to the greatest extent in his/her answers should be credited, if it is correct. A marker that is proficient in the relevant official language should be consulted. This is applicable to all official languages.
- Changes to the marking guidelines
No changes must be made to the marking guidelines. The provincial internal moderator must be consulted, who in turn will consult with the national internal moderator (and the Umalusi moderators where necessary). - Official marking guidelines
Only marking guidelines bearing the signatures of the national internal moderator and the Umalusi moderators and distributed by the National Department of Basic Education via the provinces must be used.
MEMORANDUM
SECTION A
QUESTION 1
1.1
1.1.1 B✓✓
1.1.2 D✓✓
1.1.3 C✓✓
1.1.4 B✓✓
1.1.5 D✓✓
1.1.6 B✓✓
1.1.7 A✓✓
1.1.8 B✓✓
1.1.9 D✓✓ (9 x 2) (18)
1.2
1.2.1 Phylogenetic tree✓/cladogram
1.2.2 Cytokinesis✓
1.2.3 (DNA) Replication✓
1.2.4 Continuous✓variation
1.2.5 Biogeography✓
1.2.6 Non-disjunction✓
1.2.7 Homologous✓ structures
1.2.8 Heterozygous✓ (8 x 1) (8)
1.3
1.3.1 None✓✓
1.3.2 A only✓✓
1.3.3 None✓✓ (3 x 2) (6)
1.4
1.4.1
- Ribosome✓
-
- W – mRNA✓
- Y – tRNA✓
- Nucleotide ✓
1.4.2
- Cytoplasm✓/endoplasmic reticulum
- Nucleus✓ /nucleoplasm
1.5
1.5.1 Hominidae✓
1.5.2 600✓ cm3
1.5.3 1,6 million years ago✓/mya
1.5.4
- Taung child✓/ A.africanus
- Mrs Ples✓/ A.africanus
- Karabo✓/A.sediba
- Little foot✓/A.prometheus Any 2 (2)
(Mark first TWO only)
1.5.5 Homo sapiens✓
1.6
1.6.1
- Metaphase I✓
- Telophase I✓
1.6.2
- B✓
- C✓
- D✓
1.6.3 Testis✓
TOTAL SECTION A: 50
QUESTION 2
2.1
2.1.1 DNA profile✓ (1)
2.1.2 Q✓ (1)
2.1.3 All the DNA bands match the DNA bands of the blood on the broken glass✓ (1)
2.1.4
- Human error could give incorrect results✓
- Only a small amount of DNA was used✓and may not be reliable
- Framing✓/planting false evidence
- Suspect can have an identical twin✓ with the same DNA profile
(Mark first TWO only) Any 2 (2) (5)
2.2
2.2.1 Protein synthesis✓ (1)
2.2.2 Peptide✓ bond (1)
2.2.3 63✓ (1)
2.2.4
- Guanine✓ (1)
-
- CAG✓ (1)
- CCT✓ (1)
- CAU✓ (1) (7)
2.3
- The double helix DNA unwinds✓
- The double-stranded DNA unzips✓/weak hydrogen bonds break
- to form two separate strands✓
- One strand is used as a template✓
- to form mRNA✓
- using free RNA nucleotides✓ from the nucleoplasm
- The mRNA is complementary to the DNA✓
- mRNA now has the coded message for protein synthesis✓ Any 6 (6)
2.4
2.4.1
- Autosomes✓ (1)
- Gonosomes✓ /sex chromosomes (1)
2.4.2 Male✓ (1)
2.4.3
- There is a Y-chromosome✓/XY chromosomes
- at chromosome pair 23✓ (2)
2.4.4
- One comes from the male parent✓ and the other comes from the female parent✓
OR - One comes from the sperm✓ and the other comes from the ovum✓ (2) (7)
2.5 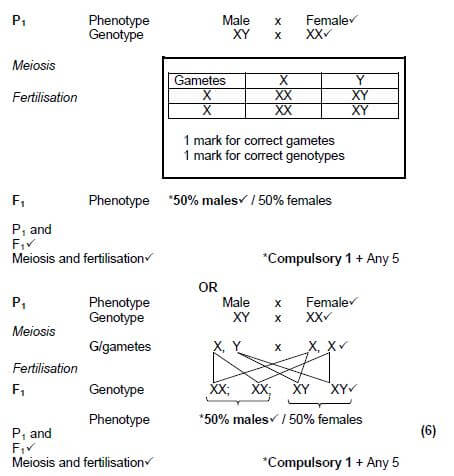
2.6
2.6.1 Dihybrid✓ cross
2.6.2
- Black✓
- Black without white patches✓
- Grey with white patches✓
2.6.3
- They can be homozygous dominant for coat colour✓/ have the genotype BBtt
- or heterozygous for coat colour✓/have the genotype Bbtt
2.6.4
- Alleles of a gene for one characteristic segregate independently✓
- of the alleles of a gene for another characteristic✓
- The alleles for each gene will therefore come together randomly✓ during gamete formation [40]
QUESTION 3
3.1
3.1.1
- Stem cells are undifferentiated✓
- and have the potential to develop into any type of cell✓
- to replace the nerve cells that are damaged✓ (3)
3.1.2
- An embryo is a potential life✓/could develop into a baby
- It poses moral or ethical issues✓
OR - Umbilical cords are discarded✓
- Do not pose a moral or ethical issue✓ (2) (5)
3.2
3.2.1 One✓/ 1 (1)
3.2.2 Mrs Thomas✓ (1)
3.2.3
- The child has the genotype ii✓/ is homozygous recessive and
- if both parents are heterozygous✓/ have the genotypes IAi or IBi
- she inherits one recessive allele from each parent✓ (3) (5)
3.3
3.3.1 Bipedal✓ (1)
3.3.2 A✓ and B✓ (2)
(Mark first TWO only)
3.3.3 Both have a short✓and wide✓ pelvis (2)
3.3.4 Less curved spine✓/C-shaped spine (1)
(Mark first ONE only) (6)
3.4 Differences between the skulls
T✓
Humans | African apes |
Large cranium✓ | Small cranium✓ |
No cranial ridge✓ | Cranial ridge across the top of the cranium✓ |
Brow ridges are not well developed✓ | Brow ridges well developed✓ |
Foramen magnum in a forward position✓ | Foramen magnum in a backward position✓ |
Jaws less protruding /less prognathous✓ | Jaws more protruding/more prognathous✓ |
Smaller jaws✓ | Larger jaws✓ |
Palate shape more rounded✓ | Palate shape more rectangular✓ |
Teeth arranged on a gentle (round) curve✓ | Teeth arranged in a less curved way✓ |
Smaller spaces between the teeth✓ | Larger spaces between the teeth✓ |
Small canines✓ | Large canines✓ |
(Mark first THREE only) Table1+ Any 3 x 2 (7)
3.5
3.5.1
- Obtain permission from the relevant authority✓
- Plan when to do the investigation✓
- Get all the equipment✓
- Decide where to obtain shrimp cysts✓
- Decide on the different concentrations of solution to use✓
- Decide on how to record the data✓
- Decide on where to do the investigation✓ Any 2
(Mark first TWO only)
3.5.2
- Salt concentration✓
- Number of cysts that hatched/ percentage of cysts hatched✓
3.5.3
- % Hatched = [1/53] ✓ × 100✓
= 1,9✓% (accept range 1,88 to 2)
3.5.4
- Temperature✓
- The volume of solution✓ used/30ml solution was used
- Duration✓/the amount of time/ left the beakers for 48 hours
- Cysts from the same type of shrimp✓ Any 3
(Mark first THREE only)
3.5.5 1%✓salt solution
3.5.6
- There was variation amongst the brine shrimp✓
- Some had the ability to produce cysts✓
- and some did not✓
- When the salt concentration became unfavourable✓
- the brine shrimp which were unable to produce cysts died✓
- Those which were able to produce cysts survived✓
- and reproduced✓
- The allele for producing cysts was passed on to their offspring✓
- The next generation therefore had a higher proportion of brine shrimp with the ability to produce cysts✓ Any 6 (17) [40]
TOTAL SECTION B: 80
SECTION C
QUESTION 4
Mutations (Mu)
- A mutation is a change in the DNA✓/ gene/nucleotide sequence or
- a change in the number✓/size of a chromosome
- Mutations introduce new alleles✓ which results in
- new genotypes✓ and hence
- new phenotypes✓ from one generation to another Any 4 (4)
Meiosis (M)
- In prophase I✓ of meiosis
- crossing over✓ occurs
- between homologous chromosomes✓
- resulting in the exchange of genetic material✓
- leading to chromosomes with a mixture of maternal and paternal genetic material✓
- In metaphase✓ of meiosis
- random arrangement of chromosomes occur✓
- leading to chromosomes moving into gametes in different combinations✓ Any 5 (5)
Role of variation in speciation (S)
- Speciation occurred through geographical isolation✓
- The original population was separated by the sea✓/a body of water
- and there was no gene flow✓ between the two populations
- There was variation in neck length within each population✓ *
- Each population was exposed to different environmental conditions✓ and
- underwent natural selection independently✓
- Over a long period of time the two populations became different✓
- genotypically and phenotypically✓
- When the two populations were mixed again✓
- they were unable to interbreed to produce fertile offspring✓
- thus indicating the formation of a new species✓
*Compulsory 1 + Any 7 (8)
Content: (17)
Synthesis: (3)
(20)
ASSESSING THE PRESENTATION OF THE ESSAY
Criterion | Relevance (R) | Logical sequence (L) | Comprehensive (C) |
Generally | All information provided is relevant to the question | Ideas are arranged in a logical/cause-effect sequence | All aspects required by the essay have been sufficiently addressed |
In this essay in Q4 | Only information relevant to the description of mutations and meiosis as sources of variation and the role of variation in speciation is given. There is no irrelevant information. | All the information regarding description of mutations and meiosis as sources of variation and the role of variation in speciation is given in a logical manner | Correct points as follows:
|
Mark | 1 | 1 | 1 |
TOTAL SECTION C: 20
GRAND TOTAL: 150
LIFE SCIENCES PAPER 2 GRADE 12 QUESTIONS - AMENDED SENIOR CERTIFICATE EXAMS PAST PAPERS AND MEMOS MAY/JUNE 2018
LIFE SCIENCES
PAPER 2
GRADE 12
AMENDED SENIOR CERTIFICATE EXAMS
PAST PAPERS AND MEMOS
MAY/JUNE 2018
INSTRUCTIONS AND INFORMATION
Read the following instructions carefully before answering the questions.
- Answer ALL the questions.
- Write ALL the answers in the ANSWER BOOK.
- Start the answers to EACH question at the top of a NEW page.
- Number the answers correctly according to the numbering system used in this question paper.
- Present your answers according to the instructions of each question.
- Do ALL drawings in pencil and label them in blue or black ink.
- Draw diagrams, tables or flow charts only when asked to do so.
- The diagrams in this question paper are NOT necessarily drawn to scale.
- Do NOT use graph paper.
- You must use a non-programmable calculator, protractor and a compass, where necessary.
- Write neatly and legibly.
QUESTIONS
SECTION A
QUESTION 1
1.1 Various options are provided as possible answers to the following questions. Choose the answer and write only the letter (A to D) next to the question numbers (1.1.1 to 1.1.9) in the ANSWER BOOK, e.g. 1.1.10 D.
1.1.1 Which ONE of the following is a mechanism of reproductive isolation?
- Extinction
- Breeding at different times of the year
- Mutation
- Independent assortment
1.1.2 Who formulated the law of use and disuse?
- Lee Berger
- Rosalind Franklin
- Gregor Mendel
- Jean Baptiste de Lamarck
1.1.3 Which ONE of the following features is found in BOTH humans and African apes?
- Short upper arms
- Claws instead of nails
- Opposable thumbs
- Small brain
1.1.4 Scientists made an observation that some species of butterfly are more numerous during wet summers than dry summers. In order to investigate this, the next step would be to …
- record the results.
- state a hypothesis.
- measure the results.
- draw a conclusion.
1.1.5 Which ONE of the following is the CORRECT definition of a species? A group of …
- similar organisms that live in the same habitat at the same time
- similar organisms that have the same chromosome number
- organisms that are similar in size, shape and colour
- similar organisms that are able to interbreed to produce fertile offspring
QUESTIONS 1.1.6 AND 1.1.7 REFER TO THE DIAGRAM BELOW SHOWING THE INHERITANCE OF HAEMOPHILIA IN A FAMILY. 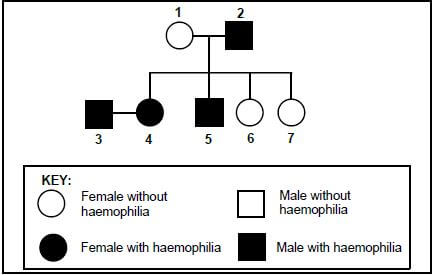
1.1.6 Which ONE of the combinations in the table below is CORRECT for BOTH individuals 1 and 5?
PHENOTYPE OF INDIVIDUAL 1 | GENOTYPE OF INDIVIDUAL 5 | |
| A | Female without haemophilia | XhXh |
| B | Female without haemophilia | XhY |
| C | Female with haemophilia | XHXh |
| D | Female without haemophilia | XHY |
1.1.7 What is the percentage chance that individuals 3 and 4 would have a child with haemophilia?
- 100%
- 75%
- 25%
- 0%
1.1.8 A dye stains a particular type of nucleic acid red. When this dye was used to identify which organelles in a cell contain this nucleic acid, only the nucleus and ribosomes stained red.
This result shows that the dye stains structures that contain …
- DNA.
- RNA.
- DNA and protein.
- both DNA and RNA.
1.1.9 Study the diagram below. 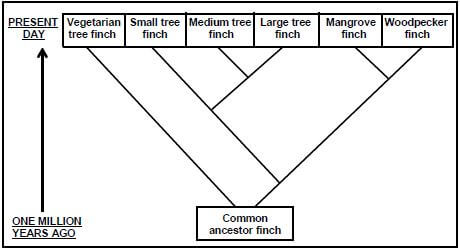
Which present-day finch is LEAST related to all the others?
- Woodpecker finch
- Large tree finch
- Mangrove finch
- Vegetarian tree finch (9 x 2) (18)
1.2 Give the correct biological term for each of the following descriptions. Write only the term next to the question numbers (1.2.1 to 1.2.8) in the ANSWER BOOK.
1.2.1 A diagrammatic representation of possible evolutionary relationships amongst species
1.2.2 The splitting of the cytoplasm during cell division
1.2.3 The process whereby DNA makes an exact copy of itself
1.2.4 A type of variation where there is a range of phenotypes for the same characteristic
1.2.5 The present-day distribution of living organisms
1.2.6 The failure of chromosome pairs to separate during meiosis
1.2.7 Similar structures in different species that show modification by descent
1.2.8 An individual having two non-identical alleles for a characteristic (8 x 1) (8)
1.3 Indicate whether each of the descriptions in COLUMN I apply to A ONLY, B ONLY, BOTH A AND B or NONE of the items in COLUMN II. Write A only, B only, both A and B or none next to the question numbers (1.3.1 to 1.3.3) in the ANSWER BOOK.
COLUMN I | COLUMN II |
1.3.1 Law of inheritance of acquired characteristics | A: Darwinism |
1.3.2 Humans select the characteristics when breeding organisms | A: Artificial selection |
1.3.3 A testable statement that may be accepted or rejected | A: Theory |
(3 x 2) (6)
1.4 The diagram below represents the process of translation. 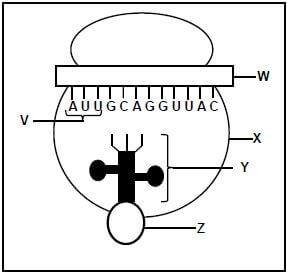
1.4.1 Name:
- Organelle X (1)
- Molecules W and Y (2)
- The monomer of molecule W (1)
1.4.2 Where in the cell is:
- Organelle X found (1)
- Molecule W formed (1) (6)
1.5 Study the graph below. 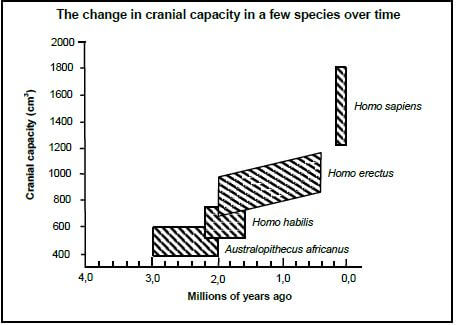
1.5.1 Name the family to which all these species belong. (1)
1.5.2 What is the largest cranial capacity (in cm3) of Australopithecus africanus? (1)
1.5.3 When did Homo habilis become extinct? (1)
1.5.4 Name TWO Australopithecus fossils found in South Africa. (2)
1.5.5 Which of the organisms represented above has the greatest range in cranial capacity? (1) (6)
1.6 Diagrams 1 to 3 below represent some of the phases of meiosis shown in the correct order. 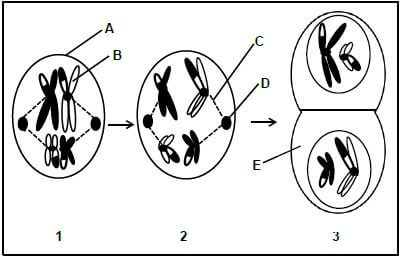
1.6.1 Identify the phase represented by diagram:
- 1 (1)
- 3 (1)
1.6.2 Give the LETTER only of the part that:
- Contains DNA (1)
- Attaches to the centromeres of chromosomes (1)
- Forms the spindle fibres (1)
1.6.3 Name the organ in a human male where meiosis occurs. (1) (6)
TOTAL SECTION A: 50
SECTION B
QUESTION 2
2.1 When a thief broke into a car he cut his arm on the broken glass. Scientists extracted DNA from the blood found on the broken glass. They analysed this DNA sample and compared it to the DNA from three suspects, P, Q and R.
The table below shows the results of the analysis for the DNA from each source. 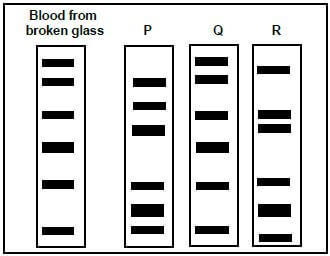
2.1.1 What do the diagrams above represent? (1)
2.1.2 Which suspect is most likely the thief? (1)
2.1.3 Give a reason for your answer to QUESTION 2.1.2. (1)
2.1.4 State TWO possible disadvantages of using this evidence in a court of law. (2) (5)
2.2 Insulin is one of the hormones responsible for the control of blood glucose levels in humans. It is made up of two long amino acid chains, A and B, which are joined. Chain A is made up of 21 amino acids and chain B of 30 amino acids.
The diagram below represents the amino acids present in each chain. 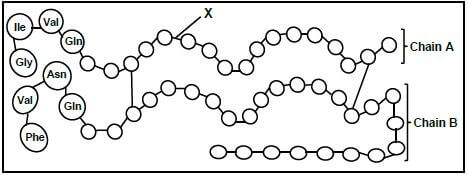
2.2.1 Name the process whereby insulin is produced in a normal human cell. (1)
2.2.2 Identify bond X. (1)
2.2.3 How many nitrogenous bases in a DNA molecule code for the amino acids in chain A? (1)
2.2.4 The table below shows the mRNA codons that code for some amino acids.
mRNA CODON | AMINO ACID |
UUC | Phenylalanine (Phe) |
AUC | Isoleucine (Ile) |
AAU | Asparagine (Asn) |
GAA | Glutamic acid (Glu) |
GUA | Valine (Val) |
CAG | Glutamine (Gln) |
CAU | Histidine (His) |
GGA | Glycine (Gly) |
- Name the nitrogenous base represented by G in the mRNA codon CAG. (1)
- Read the chains from left to right and give the:
- Codon for the fourth amino acid in chain B (1)
- DNA base triplet that codes for the first amino acid in chain A (1)
- Give the anticodon for valine. (1) (7)
2.3 Describe the process of transcription. (6)
2.4 The diagram below shows the karyotypes of two individuals. 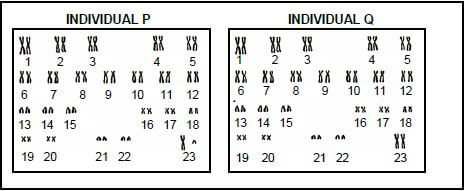
2.4.1 What term is given to the chromosomes numbered:
- 1 to 22 (1)
- 23 (1)
2.4.2 State the gender of individual P. (1)
2.4.3 Give ONE observable reason for your answer to QUESTION 2.4.2. (2)
2.4.4 Each of the pairs shown is a homologous pair of chromosomes.
State the origin of each chromosome in a homologous pair of chromosomes. (2) (7)
2.5 Lindiwe has two sons and she is now pregnant for the third time. Use a genetic cross to show the percentage chance that this child could be a boy. (6)
2.6 In dogs, coat appearance is controlled by two genes; one for coat colour and one for coat pattern (presence or absence of white patches).
The alleles for each characteristic are shown in the table below.
CHARACTERISTIC | ALLELES | |
Coat colour | Black (B) | Grey (b) |
Coat pattern | Without white patches (T) | With white patches (t) |
In a cross between two dogs, the four offspring, V, W, X and Y, had the phenotypes as shown in the diagram below. 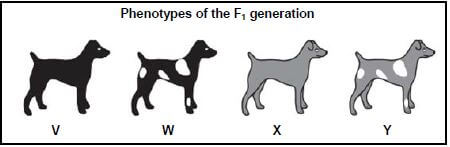
2.6.1 What is the term given to a genetic cross involving two characteristics? (1)
2.6.2 Give the phenotype of:
- The dominant coat colour (1)
- Dog V (1)
- A dog that is homozygous recessive for both characteristics (1)
2.6.3 Explain why all dogs with the phenotype of dog W may not have the same genotype. (2)
2.6.4 The two characteristics are inherited in accordance with Mendel's principle of independent assortment. State this principle. (3) (9)
[40]
QUESTION 3
3.1 Read the extract below.
| Stem cell surgery has been performed for the first time in South Africa at a Cape Town hospital. A patient became paralysed in a diving accident. He had no movement or feeling in any of his limbs because his nerve cells were damaged. Embryonic stem cells were used in an attempt to correct a defect in the spinal cord of the patient. He has now developed partial sensation throughout the body. |
3.1.1 Explain why stem cells are suitable cells to use for the treatment of this patient. (3)
3.1.2 Explain why some people prefer the use of umbilical cords as a source of stem cells rather than the use of human embryos. (2) (5)
3.2 A baby was kidnapped from a hospital immediately after she was born. Fifteen years later it was discovered that Mr and Mrs Thomas, who were raising her, were not her biological parents. Mr and Mrs George, whose baby was born around the same time, claimed that she was their child.
The blood groups of both families are shown in the table below.
INDIVIDUAL | BLOOD GROUPS |
Child | O |
Mr Thomas | O |
Mrs Thomas | AB |
Mr George | B |
Mrs George | A |
3.2.1 How many genes control the inheritance of blood groups? (1)
3.2.2 Name the individual whose blood group shows co-dominance. (1)
3.2.3 Explain why Mr and Mrs George could possibly be the parents of this child. (3) (5)
3.3 In a study to establish the mode of locomotion of some species, scientists compared the pelvic structure of their fossils. They established that two of these species had the ability to walk upright permanently. The diagrams (A, B and C) below show the pelvic structure of three species, drawn to scale. 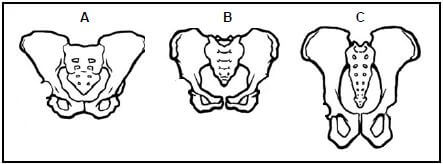
3.3.1 What term is used to describe organisms that are able to walk upright permanently? (1)
3.3.2 Which TWO diagrams above represent the pelvis of the organisms in QUESTION 3.3.1? (2)
3.3.3 Explain your answer to QUESTION 3.3.2. (2)
3.3.4 State ONE feature of the spine of the organism represented by C. (1) (6)
3.4 Tabulate THREE differences between the skulls of humans and African apes. (7)
3.5 Read the extract below.
| Brine shrimp are small arthropods found in saltwater lakes. During favourable conditions female shrimps produce eggs that hatch into live young. However, when conditions are unfavourable, the shrimp produce cysts. Each cyst contains the embryo covered with a hard, protective covering. In this state the embryo stops growing and is said to be dormant. The embryo can remain in this dormant state for many years and the cyst will only hatch at the optimum salt concentration. |
Scientists wanted to investigate which salt concentration resulted in the highest percentage of hatched cysts.
They did the following:
- Prepared salt solutions of different concentrations: 0%, 0,5%, 1%, 1,5% and 2%
- Placed 30 mℓ of each solution into one of five beakers
- Took samples of brine shrimp cysts using a dropper
- Counted the number of cysts in each sample
- Recorded this as the initial number of cysts
- Placed the samples into each of the five beakers
- Left the beakers at room temperature for 48 hours
- Recorded the number of cysts that hatched in each beaker
- Calculated the percentage of cysts that hatched
The results are shown in the table below.
SALT CONCENTRATION (%) | NUMBER OF CYSTS USED AT THE START | NUMBER OF CYSTS THAT HATCHED | PERCENTAGE OF CYSTS THAT HATCHED |
0 | 54 | 0 | 0 |
0,5 | 34 | 2 | 6 |
1 | 40 | 6 | 15 |
1,5 | 40 | 1 | 2,5 |
2 | 53 | 1 | X |
3.5.1 State TWO planning steps to consider before collecting the samples. (2) 3.5.2 State the:
- Independent variable (1)
- Dependent variable (1)
3.5.3 Calculate the value of X in the table. Show ALL working. (3)
3.5.4 State THREE factors that were kept constant in order to ensure the validity of this investigation. (3)
3.5.5 Which salt concentration resulted in the highest percentage of hatched cysts? (1)
3.5.6 Use the theory of evolution through natural selection to explain how the ability to produce cysts led to the survival of the brine shrimp. (6) (17)
[40]
TOTAL SECTION B: 80
SECTION C
QUESTION 4
There was variation in neck length in a population of Galapagos tortoises. The original population from the mainland was separated onto two islands with different environmental conditions. Many years later it was established that speciation of the tortoises had occurred.
Describe how mutations and meiosis lead to variation within a population and the role of variation in the speciation of the tortoises.
Content: (17)
Synthesis: (3)
NOTE: NO marks will be awarded for answers in the form of a table, flow charts or diagrams.
TOTAL SECTION C: 20
GRAND TOTAL: 150
LIFE SCIENCES PAPER 1 GRADE 12 QUESTIONS - AMENDED SENIOR CERTIFICATE EXAMS PAST PAPERS AND MEMOS MAY/JUNE 2018
LIFE SCIENCES
PAPER 1
GRADE 12
AMENDED SENIOR CERTIFICATE EXAMS
PAST PAPERS AND MEMOS
MAY/JUNE 2018
INSTRUCTIONS AND INFORMATION
Read the following instructions carefully before answering the questions.
- Answer ALL the questions.
- Write ALL the answers in the ANSWER BOOK.
- Start the answers to EACH question at the top of a NEW page.
- Number the answers correctly according to the numbering system used in this question paper.
- Present your answers according to the instructions of each question.
- Do ALL drawings in pencil and label them in blue or black ink.
- Draw diagrams, tables or flow charts only when asked to do so.
- The diagrams in this question paper are NOT necessarily drawn to scale.
- Do NOT use graph paper.
- You must use a non-programmable calculator, protractor and a compass, where necessary.
- Write neatly and legibly.
QUESTIONS
SECTION A
QUESTION 1
1.1 Various options are provided as possible answers to the following questions. Choose the answer and write only the letter (A to D) next to the question numbers (1.1.1 to 1.1.9) in the ANSWER BOOK, e.g. 1.1.10 D.
1.1.1 Which part of the male reproductive system secretes testosterone?
- Cowper's glands
- Prostate gland
- Testis
- Epididymis
1.1.2 Which ONE of the following represents the CORRECT sequence of development in humans?
- Zygote ?morula ?blastocyst ? foetus
- Morula ?blastocyst ?zygote ?foetus
- Foetus ?morula ? blastocyst ? zygote
- Zygote ?foetus ? morula ?blastocyst
1.1.3 A function of the medulla oblongata is to …
- control higher thought processes.
- regulate blood glucose levels.
- regulate breathing.
- inhibit voluntary movement.
1.1.4 A disorder of the brain that is characterised by memory loss and confusion is …
- Alzheimer's disease.
- haemophilia.
- multiple sclerosis.
- Down syndrome.
1.1.5 Which ONE of the following is a part of the ear where grommets are inserted?
- Oval window
- Semi-circular canal
- Tympanic membrane
- Pinna
1.1.6 Depth perception refers to the ability to judge distance.
An investigation was carried out to determine the effect of using one eye only or both eyes on depth perception.
Participants were asked to thread a needle as a test of depth perception. The number of attempts needed to successfully thread the needle was counted when using one eye only and then when using both eyes.
The results of the investigation are provided in the table below.
EYES USED | NUMBER OF ATTEMPTS |
One eye only | 12 |
Both eyes | 2 |
The results of this investigation show that …
- binocular vision reduces depth perception.
- using one eye only increases depth perception.
- the number of eyes used has no effect on depth perception.
- binocular vision increases depth perception.
1.1.7 Which ONE of the following refers to a part of the nervous system that is involved in the regulation of body temperature?
- Corpus callosum
- Cerebellum
- Hypothalamus
- Spinal cord
1.1.8 A person experiences the following symptoms:
- Loses weight easily
- Is always hungry
- Never feels cold
The most likely explanation for this combination of symptoms is that the person …
- secretes too much growth hormone.
- has an overactive thyroid gland.
- is diabetic and just had an insulin injection.
- has an underactive hypothalamus.
1.1.9 The diagram below represents a cell during the early stages of prophase I. 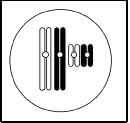
Various combinations of chromosome arrangements are given below. 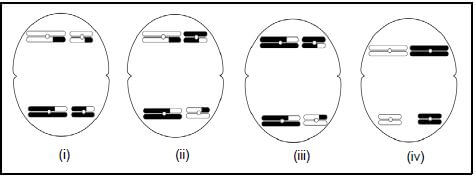
Which diagrams, (i) to (iv), are possible representations of the chromosomes at the poles of the cell during telophase I of normal meiosis?
- (iii) and (iv) only
- (i) and (ii) only
- (i) and (iii) only
- (i), (ii) and (iv) only (9 x 2) (18)
1.2 Give the correct biological term for each of the following descriptions. Write only the term next to the question numbers (1.2.1 to 1.2.7) in the ANSWER BOOK.
1.2.1 The system in the body that regulates processes by secreting hormones directly into the blood
1.2.2 The farming practice of growing a crop of a single species only
1.2.3 The production of male gametes through meiosis
1.2.4 The hormone that stimulates the production of milk in a mother after the birth of a baby
1.2.5 Sharp structures found in plants for protection from herbivores
1.2.6 A measure of the total amount of carbon dioxide emissions of a person/population/company per year
1.2.7 A plant growth response to an external stimulus (7 x 1) (7)
1.3 Indicate whether each of the descriptions in COLUMN I apply to A ONLY, B ONLY, BOTH A AND B or NONE of the items in COLUMN II. Write A only, B only, both A and B or none next to the question numbers (1.3.1 to 1.3.3) in the ANSWER BOOK.
COLUMN I | COLUMN II |
1.3.1 Decreases food security | A: Alien plant invasion |
1.3.2 The use of plant hormones to fight alien plant invasions | A: Chemical control |
1.3.3 Hormone secreted by the pituitary gland | A: Aldosterone |
(3 x 2) (6)
1.4 The diagram below represents a possible 'path' followed by an impulse when a person touches a hot plate. 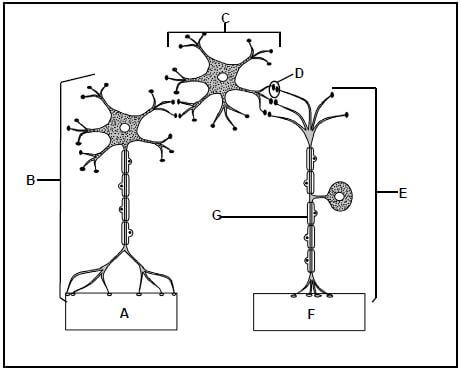
1.4.1 Name the 'path' represented in the diagram. (1)
1.4.2 Identify the type of neuron represented by:
- B (1)
- C (1)
- E (1)
1.4.3 Give the LETTER only of the part that represents the:
- Receptor (1)
- Effector (1)
1.4.4 Give the LETTER and NAME of the:
- Region where the impulse is transmitted chemically (2)
- Part that has an insulating function (2) (10)
1.5 The diagrams below represent two phases of meiosis in an organism. 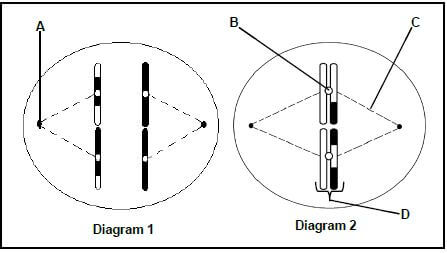
1.5.1 Identify the phase of meiosis represented in Diagram 1. (1)
1.5.2 Identify part:
- A (1)
- B (1)
- C (1)
1.5.3 State what happens to structure D in the next phase of meiosis. (1)
1.5.4 Name the process during which genetic material was exchanged, as shown in the diagrams above. (1)
1.5.5 State the consequence if the process named in QUESTION 1.5.4 does not occur. (1)
1.5.6 Give the number of chromosomes present in:
- The original parent cell in this organism (1)
- A human cell in the same phase as that shown in Diagram 2 (1) (9)
TOTAL SECTION A: 50
SECTION B
QUESTION 2
2.1 The graph below shows the concentration of progesterone in a woman's blood during the early stages of pregnancy. 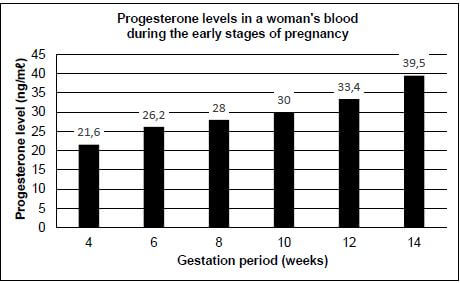
2.1.1 Name TWO structures responsible for producing progesterone during pregnancy. (2)
2.1.2 Describe the general trend in the change in progesterone levels in the woman's blood during the early stages of pregnancy. (1)
2.1.3 Describe the negative feedback mechanism that occurs between progesterone and FSH during pregnancy. (2)
2.1.4 State the importance of the negative feedback mechanism described in QUESTION 2.1.3. (1)
2.1.5 Calculate the percentage increase in progesterone levels between week 4 and week 14. Show ALL calculations. (3)
2.1.6 The woman's progesterone level in week 16 was 25 ng/mℓ.
- Explain why this woman should be concerned about the decrease in progesterone levels. (2)
- Suggest ONE way in which this problem could possibly be treated by a doctor. (1) (12)
2.2 The diagram below represents the structure of a landfill site. 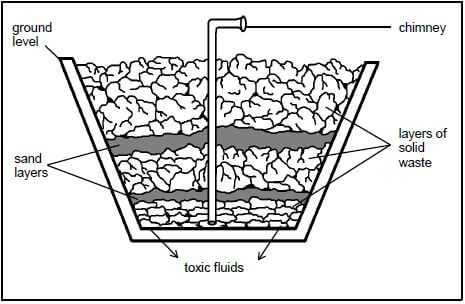
2.2.1 Name the flammable gas that escapes through the chimney. (1)
2.2.2 State ONE possible use for the gas in QUESTION 2.2.1. (1)
2.2.3 Give ONE reason for covering the waste with layers of sand at landfill sites at regular intervals. (1)
2.2.4 Give ONE visible reason why this landfill site would not be in use for much longer. (1)
2.2.5 State TWO ways in which the:
- Landfill site could be used after rehabilitation (2)
- Amount of waste going to the landfill site could be reduced (2) (8)
2.3 The diagram below represents a part of the human ear. 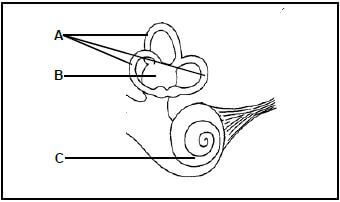
2.3.1 Name the part of the brain that receives impulses from:
- Parts A and B (1)
- Part C (1)
2.3.2 Name the receptor found in part C. (1)
2.3.3 Explain TWO ways in which part A in the diagram is structurally suited to maintain balance. (4) (7)
2.4 The diagram below shows the structure of the human eye.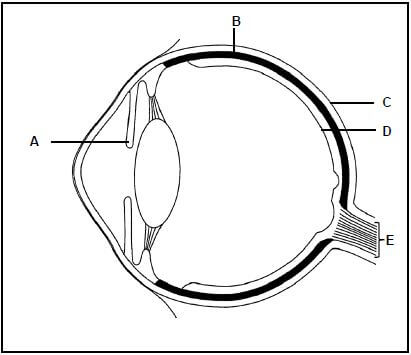
2.4.1 Identify part:
- B (1)
- C (1)
2.4.2 Explain the effect on a person's vision if part E is cut. (2)
2.4.3 Part D can be damaged by very bright light. Describe how part A helps to protect part D in very bright light. (4)
2.4.4 In a condition called presbyopia, lenses lose their elasticity and therefore maintain a constant flat shape.
- Explain how this condition would affect a person's vision. (4)
- Suggest the shape of the lens that may be prescribed by a doctor to correct this disorder. (1)
(13) [40]
QUESTION 3
3.1 The table below gives information about the sources of marine pollution.
SOURCES OF MARINE POLLUTION | PERCENTAGE CONTRIBUTION TO POLLUTION |
Sewage | 30 |
Farm runoff | 20 |
Air pollution | 20 |
Marine transportation | 10 |
Industrial waste | 10 |
Offshore oil | 5 |
Organic litter | 5 |
3.1.1 Draw a bar graph to represent the percentage contribution of sewage, farm runoff, industrial waste and organic litter to marine pollution. (7)
3.1.2 Untreated sewage and organic litter sometimes flow into dams. Describe how this pollution reduces oxygen levels in the water. (4) (11)
3.2 The endocrine system plays a role in helping a person to cope during a dangerous situation.
3.2.1 Name the hormone that is secreted in the person's body in response to a dangerous situation. (1)
3.2.2 State THREE effects that the hormone in QUESTION 3.2.1 has on the body. (3) (4)
3.3 Describe the homeostatic control of blood glucose levels in a person who consumed a drink with a large amount of sugar. (5)
3.4 An investigation was carried out to determine the influence of alcohol on the volume of urine produced.
12 healthy, 23-year-old males of similar height and mass participated in the investigation.
The investigation was conducted as follows:
- The men were divided into two groups of six each, Group A and Group B.
- The two groups ate the same food and did the same exercise for the 24-hour-period before testing.
- Each group was given the following to drink after the 24-hour-period:
- Group A: 1 litre of alcohol-free beer (beer that does not contain alcohol)
- Group B: 1 litre of alcoholic beer
- Urine was collected from each man every hour.
Assume that the volume of urine collected is equal to the volume of urine produced.
The results of the investigation are shown in the table below.
TIME OF COLLECTION | AVERAGE VOLUME OF URINE COLLECTED (mℓ) | |
GROUP A | GROUP B | |
After 1 hour | 599 | 643 |
After 2 hours | 413 | 504 |
After 3 hours | 112 | 132 |
3.4.1 State:
- The dependent variable in this investigation (1)
- TWO planning steps the investigators had to take before the investigation could start (2)
- TWO factors that need to remain constant, other than the ones already mentioned (2)
- TWO steps that the investigators took to ensure the reliability of the investigation (2)
3.4.2 Based on the results, explain how the intake of alcohol influences the secretion of ADH and consequently the volume of urine that is produced by the kidneys. (4) (11)
3.5 The diagram below shows two plants (A and B) at the start of an investigation. The plants were treated in the following ways:
- No changes were made to plant A.
- The apical bud of plant B was removed.
- Each plant was covered with a box with a single opening, as shown in the diagram, and placed in a lit room.
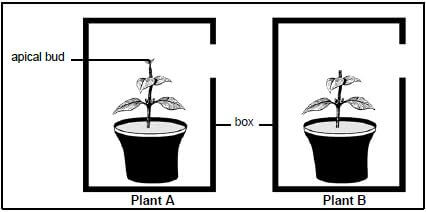
3.5.1 State the role of the boxes in the investigation. (1)
3.5.2 Name the hormone that is removed by cutting off the apical bud from plant B. (1)
3.5.3 Tabulate TWO differences between plants A and B you would expect after two weeks. (5)
3.5.4 The diagram below shows plant B seven days after being sprayed with gibberellins. 
Explain the effect that the gibberellins had on the plant by referring to the changes observed in the diagram. (2) (9)
[40]
TOTAL SECTION B: 80
SECTION C
QUESTION 4
Protection, nourishment and gaseous exchange are important requirements for the successful development of an embryo.
Describe how gaseous exchange and the nourishment of the embryo occur in an amniotic egg and how gaseous exchange and nourishment as well as protection of the foetus occur in humans.
Content: (17)
Synthesis: (3)
NOTE: NO marks will be awarded for answers in the form of a table, flow charts or diagrams.
TOTAL SECTION C: 20
GRAND TOTAL: 150
GEOGRAPHY PAPER 1 GRADE 12 ANNEXURE - AMENDED SENIOR CERTIFICATE EXAMS PAST PAPERS AND MEMOS MAY/JUNE 2018
GEOGRAPHY
PAPER 1
GRADE 12
AMENDED SENIOR CERTIFICATE EXAMS
PAST PAPERS AND MEMOS
MAY/JUNE 2018
ANNEXURE
FIGURE 1.1: STAGES IN THE DEVELOPMENT OF MID-LATITUDE CYCLONES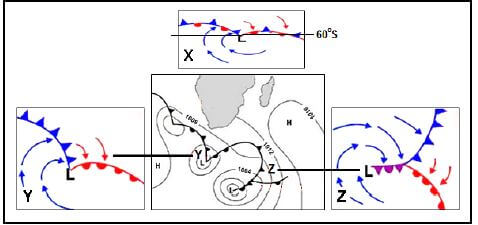
[Adapted from geography myschoolstuff.co.za]
FIGURE 1.3: INFLUENCE OF THE PLATEAU ON SOUTH AFRICAꞌS CLIMATE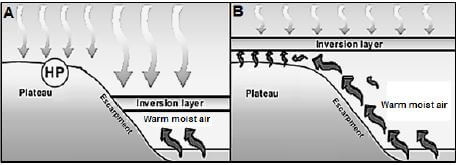
[Source: https://www.google.co.za/search?biw=1366&bih=613&tbm=isch&sa=1&q=+inversion+on+SA]
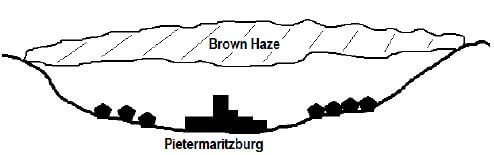
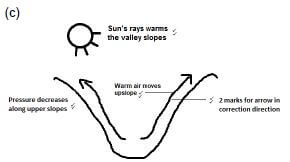
FIGURE 1.4: VALLEY CLIMATE
Pietermaritzburg is located in a valley. Air pollution concentration is at its worst during winter. Pollutants are trapped in the valley and cannot be easily dispersed. This condition causes the city's well-known brown haze which is a mixture of fog and pollutants. This condition is mainly visible between 08:00 and 11:00 during the winter when the radiation fog has not been dispersed yet. This also coincides with peak hour traffic, which creates a spike in pollution levels that increases to as much as 10 times the normal level. The brown haze disappears after 11:00.
|
[Adapted from News24, with examiner's sketch]
FIGURE 1.5: TYPES OF DRAINAGE PATTERNS 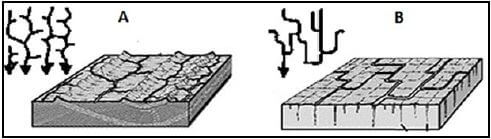
[Source: http://slideplayer.com/7545408/24/images/30/Stream+Drainage+Patterns.jpg]
FIGURE 1.6: DELTA 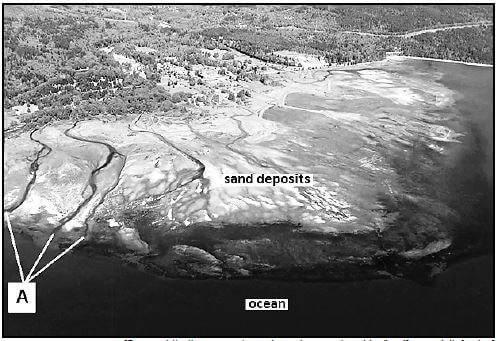
[Source: http://www.pugetsoundnearshore.org/graphics/landforms_deltafan.jpg]
FIGURE 2.1: PRESSURE CELLS – SUMMER CONDITIONS 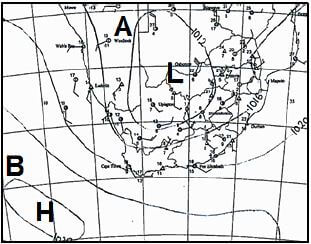
[Source: South African Weather Services]
FIGURE 2.3: TROPICAL CYCLONES
IS SOUTH AFRICA DUE FOR A TROPICAL CYCLONE? Most South Africans don't associate tropical cyclones with our shores, but they can and do affect the eastern part of our country. They are rare (unusual) conditions, with only one storm having crossed into our borders in the last 33 years. [Adapted from eNCA news] |
FIGURE 2.4: COASTAL LOW PRESSURE 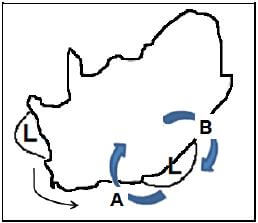
[Source: Examiner's Sketch]
FIGURE 2.5: THE COURSE OF A RIVER 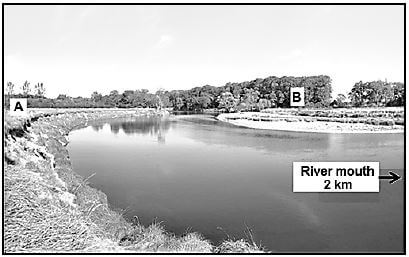
[Adapted from https://upload.wikimedia.org/wikipedia/commons/thumb/0/0f/Mulde_%28Fluss%29%2CPrallhang% 2CGleithang.jpg/1200px-Mulde_%28Fluss%29%2CPrallhang%2CGleithang.jpg]
FIGURE 2.6: HUMAN IMPACT ON THE VAAL DAM
SEWAGE IN GAUTENG DRINKING WATER | |
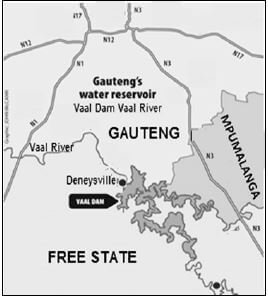 | Sitting on the bank of the Vaal Dam is the town of Deneysville which is being overwhelmed by streams of human waste. The billion cubic metres of water of the dam supply most of Gautengꞌs drinking water. At fault are the townꞌs two sewerage-pumping stations and the wastewater works that should be cleaning that waste. (through the Highlands Water Scheme) into the Vaal Dam is polluted so much that it has to be heavily treated to become drinking water again. The majority of municipalities around the dam are in contravention of the National Water Act because they are not preventing the release of unsafe levels of bacteria like E. coli. |
[Adapted from https://mg.co.za/article/2015-07-23-sewage-in-gautengs-drinking-water]
FIGURE 3.2: DATA RELATING TO ECONOMIC ACTIVITIES OF SOUTH AFRICA 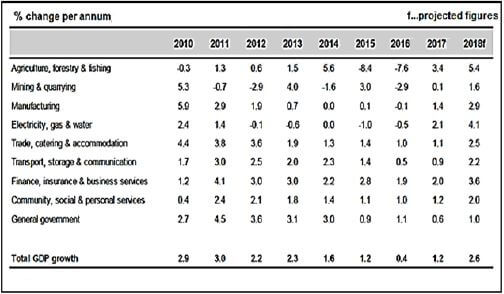
[Adapted from Stats SA (historical data) IDC forecasts]
FIGURE 3.4: URBAN LAND-USE ZONES 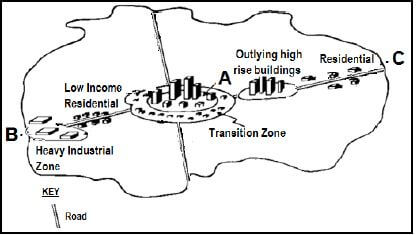
[Adapted from http://www.globalsecurity.org/military/library/policy/army/accp/in0726/image5.gif]
FIGURE 3.5: AGRICULTURAL TRADE
EXPORTS | INPORTS | |
Unprocessed Processed | Maize, sugar cane, grapes Wine, syrup, mealie meal | Rice, wheat Flour, breakfast cereal |
[Adapted from News24 Wire]
FIGURE 3.6: WEST COAST SPATIAL DEVELOPMENT INITIATIVE
[Adapted from http://0- www.tandfonline.com.innopac.wits.ac.za/doi/pdf/10.108 0/03768350500163014] | GROWTH OF THE WEST COAST ECONOMY Africa is experiencing accelerated growth in oil and gas production. This increase in oil and gas activity, the location of Saldanha Bay in relation to West and East Africa, and the size of the harbour ensures that Saldanha Bay is ideally placed for rig repair and servicing. With 120 oil rigs passing around the Cape coast annually, the West Coast SDI has been designated as an oil and gas processing and marine vessel repairing and logistics services complex. [Adapted from http://acceleratecapetown.co.za/saldanha-idz west-coast-economy/] |
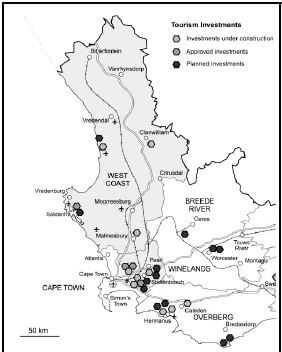
FIGURE 4.1: RURAL SETTLEMENTS 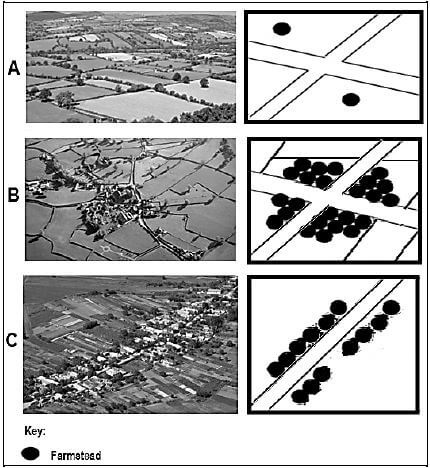
[Adapted from https://images.search.yahoo.com/yhs/search;_ylt=A0LEVvwh_YFZ73sA6rwPxQt.?p=r ural+settlement+patterns and http://rogpalmer.cantabphotos.com]
FIGURE 4.3: INFORMAL SETTLEMENTS
INFORMAL SETTLEMENTS One in five residents of South African cities lives in a shack, most of which is densely clustered in informal settlements. These areas present the country with its biggest challenges. Shack dwellers are exposed to hardship, insecurity and hazards from living in unhygienic and overcrowded conditions on un-serviced and sometimes unsuitable land. They believe they deserve better, which adds to their growing discontent (unhappiness) and violent protests in recent years. [Adapted from www.hsrc.co.za] |
FIGURE 4.4: ENVIRONMENTAL INJUSTICE
ENVIRONMENTAL INJUSTICE IN SOUTH AFRICA Through its work at the Medupi site (mega coal-fired power station), Eskom is guilty of an environmental injustice. In South Africa it is the poor who bear the impact of poor air quality caused by coal-fired power stations. These power stations are situated close to poor mining communities who live in poorly built houses that provide little protection against bad air quality. [Source: www.twitter.com/NezirSinani] |
FIGURE 4.5: MANUFACTURING ACTIVITIES 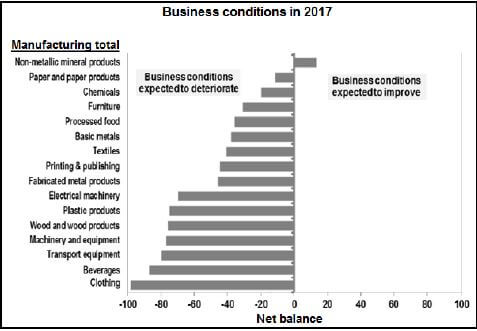
[Adapted from IDC, compiled from BER data]
FIGURE 4.6: INFORMAL TRADING
THE SLEEPING GIANT – INFORMAL TRADE IN SOUTH AFRICA The SA food market is worth R485 billion. Of this, 66% is accounted for by the major supermarkets and branded superettes (R320 billion); while informal and wholesalers account for the rest of the total market. [Source: http://www.supermarket.co.za/news-article.asp?ID=6851&CatTags=16-Economic%20factors] |
GEOGRAPHY PAPER 1 GRADE 12 MEMORANDUM - AMENDED SENIOR CERTIFICATE EXAMS PAST PAPERS AND MEMOS MAY/JUNE 2018
GEOGRAPHY
PAPER 1
GRADE 12
AMENDED SENIOR CERTIFICATE EXAMS
PAST PAPERS AND MEMOS
MAY/JUNE 2018
MEMORANDUM
SECTION A: CLIMATE, WEATHER AND GEOMORPHOLOGY
QUESTION 1
1.1
1.1.1 Polar front (1)
1.1.2 Wave/Formative stage (1)
1.1.3 1 000 hPa/mb (1)
1.1.4 Z (1)
1.1.5 Occlusion/Occluded stage (1)
1.1.6
- Clockwise rotation of air (1)
- Subcontinent of southern Africa is visible on the map (1)
- Warm sector facing northwards (1)
- Cold sector facing southwards (1)
- 60°S line of latitude shown (1)
[ANY ONE]
1.1.7 Family of cyclones/Cyclone families/Family of depressions (1) (7 x 1) (7)
1.2
1.2.1 permanent (1)
1.2.2 periodic (1)
1.2.3 episodic (1)
1.2.4 periodic (1)
1.2.5 permanent (1)
1.2.6 episodic (1)
1.2.7 exotic (1)
1.2.8 periodic (1) (8 x 1) (8)
1.3
1.3.1 A (1) (1 x 1) (1)
1.3.2
- The inversion layer is well below the plateau/escarpment (1)
- Presence of a high pressure over the plateau (1)
- Strong subsidence of air which indicates cold conditions (1)
- Moist air from the ocean is being prevented from moving inland (1)
[ANY ONE] (1 x 1) (1)
1.3.3 A stronger subsiding cold air mass (from the Kalahari HP) descends onto a weaker (warm) air mass creating an inversion layer (2) (1 x 2) (2)
1.3.4
- There are stronger convection currents reducing the subsidence of cooler air (2)
- It is higher than the plateau during summer months because the interior experiences higher temperatures (2)
- Weak descending cold air mass thus not pushed very far down (2)
- Kalahari High Pressure Cell not well developed in summer (2)
[ANY TWO] (2 x 2) (4)
1.3.5 Summer
- Additional warm moist air is drawn in from the coastal area (2)
- Rising moist air results in unstable conditions (2)
- Rising moist air results in cloud formation over the interior (2)
- Rising moist air results in more rainfall occurring over the interior (2)
- Drop in pressure over land as warm air rises (2)
- Moisture front develops over interior (2)
- Line thunderstorms develop over eastern interior (2)
Winter
- Warm moist air blocked off from reaching the interior (2)
- Lack of rising moist air results in stable conditions (2)
- Lack of rising moist air reduces cloud cover over the interior (2)
- Lack of rising warm air results in no/little rainfall over the interior (2)
- Fewer clouds may result in the development of frost (2)
- Increase in pressure as interior is dominated by subsiding air (2)
- Large temperature range as a result of low temperatures at night and higher temperatures during the day (2)
[ANY FOUR – must refer to both summer and winter conditions] (4 x 2) (8)
1.4
1.4.1 Located on the valley floor/in a valley (1) (1 x 1) (1)
1.4.2
- Pollution is concentrated (1)
- Pollutants are trapped (1)
- Cannot easily be dispersed (1)
[ANY ONE] (2 x 1) (2)
1.4.3
- Anabatic/upslope wind (1) (1 x 1) (1)
-
- Air rises along slopes/Air moves upslope (2)
- Air is lighter and warmer (2)
[ANY ONE] (1 x 2) (2)

Must indicate correct direction of movement by arrow (2) and any ONE descriptive label. (2 x 2) (4)
1.4.4
- Poor visibility (2)
- Increased traffic congestion (2)
- Increased motor vehicles accidents (2)
- Motor vehicles have a greater risk of hitting pedestrians/cyclists/animals (2)
[ANY TWO] (2 x 2) (4)
1.5
1.5.1
A – trellis (1)
B – rectangular (1) (2 x 1) (2)
1.5.2
A – folded sedimentary rocks/alternating hard and soft rock layers (1)
B – rocks with joints/cracks/faulted rocks (1) (2 x 1) (2)
1.5.3
- Both have tributaries that join the main stream at a 90° angle (2) (1 x 2) (2)
- In A the main streams follow more or less a straight path and in B the main stream follows an irregular path (90° angles) (2)
A has more than one drainage basin while B has only one drainage basin evident (2)
Tributaries in A shorter than in B (2)
[ANY ONE] (1 x 2) (2)
1.5.4 Short, steep slopes (of anticlines) cause short tributaries and the main river is longer because it flows along the length of the valley (2) (1 x 2) (2)
1.5.5
- The river flows along the joints and cracks within the rocks (2)
- It is easier for the river to erode along existing fault lines rather than cutting a new path (2) (2 x 2) (4)
1.6
1.6.1 A fan shaped fluvial landform that is formed by deposited material where a river enters the sea/at the mouth of the river (1)
[CONCEPT] (1 x 1) (1)
1.6.2
- Sand deposits can be seen (1)
- The fan shape (1)
- Distributaries/River splits into smaller streams near mouth (1)
[ANY TWO] (2 x 1) (2)
1.6.3 Distributaries (1) (1 x 1) (1)
1.6.4 River splits up into smaller rivulets as it moves into a gentle gradient, in order to move around sand deposits that block its path. (1 x 2) (2)
1.6.5
- If the sea bed next to the coastline is too steep/deep, the deposits will be washed away (2)
- Some coastlines have a big tidal range which do not allow material to accumulate (2)
- Some coastlines have strong ocean currents which do not allow material to accumulate/easily remove material (2)
[ANY ONE] (1 x 2) (2)
1.6.6
- Regular deposition of silt makes soils, fertile, which is useful for farming (2)
- Access to water makes it suitable for farming (2)
- Water is available for fishing or aquaculture/fish farming (2)
- Deltas extend the coastline and make more land available for farming (2)
- Suitable for crop/rice farming because crop/rice needs a lot of water to grow (2)
- The land is fairly flat - suitable for machinery (2)
- Flat land ideal to construct transport routes for distributing produce (2)
[ANY FOUR] (4 x 2) (8) [75]
QUESTION 2
2.1
2.1.1 A/low (1)
2.1.2 B/high (1)
2.1.3 B/high (1)
2.1.4 A/low (1)
2.1.5 A/low (1)
2.1.6 B/high (1)
2.1.7 B/high (1)
2.1.8 A/low (1) (8 x 1) (8)
2.2
2.2.1 F/Surface run-off (1)
2.2.2 E/Groundwater (1)
2.2.3 H/Confluence (1)
2.2.4 G/Drainage Density (1)
2.2.5 B/First Order Streams (1)
2.2.6 D/Laminar Flow (1)
2.2.7 A/Longitudinal Profile (1) (7 x 1) (7)
2.3
2.3.1 East coast (1) (1 x 1) (1)
2.3.2
- High sea surface temperatures of 26,5 °C or more (1)
- High evaporation rate (1)
- Condensation releases latent heat (1)
- Unstable atmospheric conditions (1)
- Calm conditions for the vortex to form (1)
- Upper air divergence to maintain a low pressure on the surface (1)
- Between latitudes 5º to 25º S (1)
- Coriolis force is present (1)
[ANY TWO] (2 x 1) (2)
2.3.3
- Strong winds (2)
- Torrential/heavy rainfall (2)
- Storm surges (2)
- Rough/stormy seas (2)
- Damage to infrastructure/property (2)
- Outbreak of diseases (2)
- Possible loss of life (2)
- Destruction of crops (2)
- Drowning of livestock (2)
- Prepare for evacuations (2)
- Preparation of emergency teams (2)
- Flooding (2)
[ANY TWO] (2 x 2) (4)
2.3.4
- South Africa is outside of the tropics (2)
- The prevailing wind is deflected from its original path (2)
- The tropical cyclone moves over a colder ocean which reduces its energy levels (2)
- Protected by Madagascar which reduces the strength of a tropical cyclone as it passes over the island (2)
- Increased frictional drag reduces the tropical cyclones movement/speed (2)
- Reduced moisture/latent heat weakened the tropical cyclone (2)
- Once the cyclone makes landfall it starts to dissipate (2)
- Dissipation rates are increased further south of the tropics (2)
[ANY FOUR] (4 x 2) (8)
2.4
2.4.1 A weak low pressure system that develops along the west coast (1) [CONCEPT] (1 x 1) (1)
2.4.2 It moves southwards along the west coast(1) and eastwards along the south coast (1) (2 x 1) (2)
2.4.3 Ahead of the low, offshore winds occur blowing dry air off the land (2) Behind the low, onshore winds feed moisture onto the land (2) (2 x 2) (4)
2.4.4 West coast: cold air is fed onto the land which causes (advection) fog (2) East coast: warm/moist air is fed onto the land causing drizzle (2) (2 x 2) (4)
2.4.5
- Air descends from the Kalahari High towards the coast and it warms adiabatically (at the Dry Adiabatic Lapse Rate) (2)
- The formation of warm/berg winds increases temperature along the coast (2) Clockwise air circulation brings warm, dry conditions towards the coast (2)
[ANY TWO] (2 x 2) (4)
2.5
2.5.1 Lower course/plain stage/older stage (1) (1 x 1) (1)
2.5.2 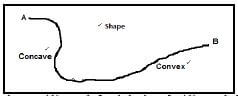
[(1) mark for the shape; (1) mark for label at A; (1) mark for label at B] [MIRROR IMAGE ACCEPTED] (3 x 1) (3)
2.5.3
- Undercut/Outer bank (1) (1 x 1) (1)
- The water flows faster (faster current) along the outer bank which results in erosion and undercutting of the slope (2) (1 x 2) (2)
2.5.4
- Water is slow moving (slower current) on the inner bank (2)
- The river cannot carry its load (loses energy), so deposition occurs (2) (2 x 2) (4)
2.5.5 Slope A
- River is deeper and canoe cannot get stuck (2)
- River flows faster so canoeist can move at a higher speed/use less energy to row (2)
OR
Slope B
- River too shallow and canoe can get stuck (2)
- River flows slower so canoeist move at slower speed (2) (2 x 2) (4)
2.6
2.6.1 (One) billion cubic metres (1) (1 x 1) (1)
2.6.2
- Free State (1)
- Mpumalanga (1) (2 x 1) (2)
2.6.3 Lesotho (1) (1 x 1) (1)
2.6.4 Water becomes polluted (1) (1 x 1) (1)
2.6.5
- People get ill from drinking the water (2)
- Causes dysentery/diarrhoea/colon infection (2)
- Water-borne diseases e.g. cholera/bilharzia (2)
- Death from bacteria (2)
[ANY ONE] (1 x 2) (2)
2.6.6
- Creating awareness (advertising boards) and providing education on healthy drinking water (2)
- River health programmes (2)
- Consulting and creating public participation around water needs (2)
- Legislation prohibiting pollution around the Vaal Dam (2)
- Fines for not properly maintaining equipment (2)
- Regular monitoring and testing of the water quality (2)
- Implement effective maintenance and renovation of the sewerage pumps and waste water works (2)
- Long term plan for sustainable water usage (2)
- Implementation and policing of the National Water Act (2)
- Making municipalities accountable for high quality drinking water (2)
- Water purification before released into the Vaal Dam (2)
- Buffering around the Vaal Dam preventing settlement development (2)
- Introducing efficient waste removal around the Vaal Dam (2)
[ANY FOUR] (4 x 2) (8) [75]
SECTION B: RURAL AND URBAN SETTLEMENTS AND SOUTH AFRICAN ECONOMIC GEOGRAPHY
QUESTION 3
3.1
3.1.1 C/Break-of-bulk point (1)
3.1.2 D/Junction towns (1)
3.1.3 G/Gap towns (1)
3.1.4 E/Specialised towns OR I/ Military towns (1)
3.1.5 E/Specialised towns (1)
3.1.6 B/Central Places (1)
3.1.7 E/Specialised towns OR F/Resort towns (1)
3.1.8 A/Mining towns (1) (7 x 1) (7)
3.2
3.2.1 Primary (1)
3.2.2 Agriculture, forestry and fishing (1)
3.2.3 General government (1)
3.2.4 Electricity, gas and water (1)
3.2.5 Tertiary (1)
3.2.6 2011 (1)
3.2.7 1,7% (1) (8 x 1) (8)
3.3
3.3.1 The movement of people from rural areas to urban areas (1) [CONCEPT] (1 x 1) (1)
3.3.2
- Drought (1)
- Floods (1)
- Infertile soils (1)
- Soil erosion (1)
- Diseases and pests (1)
- [ANY TWO] (2 x 1) (2)
3.3.3
- Rural depopulation causes a reduction in labour force (2)
- Insufficient threshold population to sustain basic services (2)
- Closure of businesses/services because of less customers (2)
- Decline in quality of service delivery (2)
- Fewer job opportunities/unemployment (2)
- Aging population because young leave the area (2)
- Brain drain as educated people leave the rural areas (2)
- Poor use of resources/farm lands (2)
- Lack of productivity (declining profits) with an older labour force (2)
- Fewer investments due to decrease in buying power (2)
[ANY TWO] (2 x 2) (4)
3.3.4
- Higher municipal budgets/more money needed to cater for increased populations (2)
- Increased pressure on municipal services (or give examples) (2)
- Understaffing of medical personnel (2)
- Not enough specialist for the increased population numbers (2)
- More demand for public transport (2)
- Need to improve/increase infrastructure as population numbers increased (2)
- Increased congestion on the roads/higher levels of traffic (2)
- More accidents/increased rate of accidents (2)
- More demand for low cost housing (2)
- More informal settlements (2)
- Overcrowding as a result of influx of people (2)
- Higher unemployment/lack of jobs (2)
- Higher levels of crime and other social ills (2)
- Higher levels of air/noise/land/water pollution (2)
- More difficult to control waste management (2)
- More landfill sites created resulting in despoliation (2)
- Increased pressure on education/overcrowded schools in urban areas (2)
- More money required to maintain urban areas e.g. policing and creating buffer zones (2)
- Municipal by-laws must be adjusted (2)
- Increase in service delivery protests (2)
- Increased number of people that are unwilling/reluctant to pay for services (2)
[ANY FOUR – ISSUE MUST BE QUALIFIED] (4 x 2) (8)
3.4
3.4.1 Central Business District/CBD (1) (1 x 1) (1)
3.4.2
- The convergence of roads from various directions (1)
- Central location (1)
[ANY ONE] (1 x 1) (1)
3.4.3
- High density of buildings in a small area (1)
- High rise buildings/sky scrapers (1)
[ANY ONE] (1 x 1) (1)
3.4.4 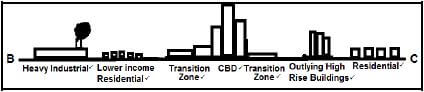
[(1) mark for the shape of the sketch; any THREE labels, correctly positioned] (4 x 1) (4)
3.4.5
-
- Buildings are abandoned (2)
- Landlords don't want to spend money on maintenance (2)
- Many homeless/foreigners/refugees live in the abandoned buildings (2)
- High crime rates (or give descriptive examples) make landlords reluctant to maintain buildings (2)
- Constant vandalism that must be maintained (or explained examples) (2)
- Occupants cannot afford to pay rent (2)
- People that are renting are not prepared to maintain the buildings (2)
- This is a mixed function zone (or give examples of different functions that have mixed) (2)
[ANY ONE] (1 x 2) (2)
-
- It is the future expansion areas for the CBD/Next to the CBD (2)
- Located in the inner city and has high degree of accessibility (2)
[ANY ONE] (1 x 2) (2)
3.4.6
- Associated with air pollution (2)
- Associated with noise pollution (2)
- Away from higher and middle income residential areas (2)
- Where the land is cheaper (2)
- It is flat land (2)
- Need enough space and room for expansion (2)
- Closer to transport routes (2)
- Nearby labour supply/lower income residential area (2)
- It is situated closer to the raw material (2)
[ANY TWO] (2 x 2) (4)
3.5
3.5.1
- Maize (1)
- Sugar cane (1)
- Grapes (1)
[ANY ONE] (1 x 1) (1)
3.5.2
- Unprocessed products are in their raw/natural state (1)
- Processed products are when raw materials have been converted into more useful products (1)
[CONCEPT] (2 x 1) (2)
3.5.3
- Lower profits as primary goods sell for less than finished goods (2)
- Some unprocessed goods are perishable (2)
[ANY ONE] (1 x 2) (2)
3.5.4
- Low and unreliable rainfall (2)
- Poor quality or infertile soils (2)
- Diseases and pests (2)
- Drought (2)
- Floods (2)
[ANY ONE] (1 x 2) (2)
3.5.5 Decline in the number of people employed
- Modern machinery has replaced manual labour (2)
- More commercial farmers use a smaller labour force (2)
- Capital intensive rather than labour intensive farming (2)
- Not enough farming activities as a result of climate change (2)
- Seeking better employment opportunities (2)
- Lower income in farming (2)
- Farmers cannot meet minimum wage (2)
- Exploitation of farm workers (2)
- Seeking better paying employment opportunities (2)
- Natural disasters decrease employment opportunities (2)
- People with chronic illnesses (or give examples) can no longer work
Likely impact on the people
- An increase in poverty (2)
- An increase in crime (2)
- Encourage rural depopulation (2)
- Causes more rural-urban migration (2)
- Increase dependency on social grants (2)
- Labour more expensive which raises production costs (2)
- Decrease in the standard of living/quality of life (2)
Can also have positive impact on people
- Increased earnings in other sectors (2)
- Improved standard of living (2)
- Entrepreneurial opportunities (2)
- Upgrading of skills (2)
- Higher purchasing power (2)
- Encouragement for better qualifications (2)
[ANY FOUR – REFER TO BOTH COMPONENTS] (4 x 2) (8)
3.6
3.6.1 Western Cape (1) (1 x 1) (1)
3.6.2
- Oil/gas processing (1)
- Rig repair and servicing (1)
- Marine vessel repairing (1)
- Industrial development (1)
[ANY ONE] (1 x 1) (1)
3.6.3
- Accelerated growth of oil and gas production in Africa (1)
- More oil rigs passing by the west coast (1)
- More maintenance required by passing oil rigs (1)
- Harbour promotes trade (1)
[ANY ONE] (1 x 1) (1)
3.6.4
- Limited access to power supply increases cost of electricity (2)
- Dependency on a nuclear power station is a threat to power supply (2)
- Located away from thermal power plants, thus electricity is expensive (2)
- Failing electricity infrastructure (2)
- Mediterranean climate means they have insufficient rainfall (2)
- Fresh water supply is restricted/expensive, pushing up production costs (2)
[ANY TWO] (2 x 2) (4)
3.6.5
- Increases accessibility (2)
- Transport of raw materials (2)
- Transport is needed for finished products (2)
- Traffic volume will increase, so the roads need to be upgraded (2)
- To gain access to markets (local and international) (2)
- To attract foreign and local investment (2)
- To promote industrial decentralisation (2)
- To transport labour force to and from work (2)
[ANY TWO] (2 x 2) (4)
3.6.6
- More job/employment opportunities (2)
- Increase in spending power will lead to more business development (2)
- Attract both local and foreign investors (2)
- Contribute to an increase in the GDP (2)
- Provides greater entrepreneurial opportunities to local communities/SMMEs (2)
- Infrastructure will be upgraded to meet increased demands (2)
- Transport routes will be upgraded to improve network efficiency (2)
- Economy will be decentralised away from the core to stimulate growth in other areas (2)
- Development associated with the multiplier-effect (2)
- Promote tourism and provide income (2)
[ANY TWO] (2 x 2) (4) [75]
QUESTION 4
4.1
4.1.1 C (1)
4.1.2 A (1)
4.1.3 A (1)
4.1.4 C (1)
4.1.5 A (1)
4.1.6 B (1)
4.1.7 C (1) (7 x 1) (7)
4.2
4.2.1 Market/Raw material (1)
4.2.2 Light (1)
4.2.3 Bridge (1)
4.2.4 Ubiquitous (1)
4.2.5 Heavy (1)
4.2.6 Market (1)
4.2.7 Footloose (1)
4.2.8 Heavy (1) (8 x 1) (8)
4.3
4.3.1 20% (1) (1 x 1) (1)
4.3.2
- Lack of space in informal settlements (2)
- Great demand for informal housing which is cheaper/affordable (2)
- Too many people who cannot afford formal housing that chose to live in informal settlements (2)
- Built in a piecemeal manner, with no planning (2)
[ANY ONE] (1 x 2) (2)
4.3.3
- Protest actions that can turn to violence/can lead to violence (2)
- Burning of tyres (2)
- Blocking of roads (2)
- Littering of roads (2)
- Looting and damaging businesses/shops (2)
- Burning down shacks (2)
- Burning down government/municipal buildings (2)
- Disruption of service provision (2)
- Destruction of infrastructure e.g. water/power meters (2)
- Stoning of motor vehicles (2)
- Illegal marches (2)
- Land grabs (2)
- Picketing outside government buildings (2)
[ANY TWO] (2 x 2) (4)
4.3.4
- Exposed to poor service delivery or give examples (2)
- Ill-health due to unhygienic conditions or examples of diseases (2)
- Exposed to hazards and poor weather conditions due to poor housing (2)
- Lack of privacy due to overcrowding (2)
- Exposed to violence and other social ills e.g. prostitution, drug trafficking (2)
- People lack the necessary life skills, therefore not employed in high end jobs (2)
- Lack of money restricts people from furthering their studies (2)
- People end up being unemployed (2)
- People are poverty stricken (2)
- Dependent on family and friends (2)
- Due to lower income paid work resulting in more debt (2)
- Cannot afford formal housing (2)
- People possibly tempted to get involved in crime (2)
- Due to lack of skills, lack of knowledge, lack of access to resources etc. people are unable to achieve a better life (2)
[ANY FOUR] (4 x 2) (8)
4.4
4.4.1 Any harmful substance/condition/activity causing damage to people and the environment (1) [CONCEPT] (1 x 1) (1)
4.4.2 Air pollution/poor quality of air (1) (1 x 1) (1)
4.4.3 They live close to the power stations (1) (1 x 1) (1)
4.4.4
- More respiratory problems (2)
- More skin ailments (2)
- Increase in eye diseases (2)
- Feeling of discomfort and lethargy (2)
- Increased cost for medical care (2)
- Negative impact on small-scale farmers (2)
- Acid rain (2)
- High maintenance costs due to acid rain (2)
- Water will be contaminated/polluted for livestock (2)
[ANY TWO] (2 x 2) (4)
4.4.5
- Tall smoke stacks/chimneys to distribute the pollution at a higher level so that upper winds can disperse the air pollution (2)
- Filters/scrubbers installed in chimneys to clean the air (2)
- Legislation to protect people's environmental rights (2)
- Assistance in legal claims against polluters (2)
- Frequent testing and monitoring of air quality (2)
- Policing and implementing the 'polluter pay' principle, imposing fines (2)
- Compensation to the community for health care (2)
- Relocate poor communities away from the power stations (2)
- Improve housing conditions of the poor (2)
- Create awareness campaigns educating people on their environmental rights (2)
- Promote clean energy resources (2)
- Create greenbelts to assist with cleaning of air (2)
[ANY TWO] (2 x 2) (4)
4.4.6
- Less water for irrigation of crops (2)
- Pollutants from power stations impacts on quality of soil leading to a decrease in farming (2)
- Reduction in production of crops/scale of farming is reduced (2)
- Production costs of farming increases (2)
- Prices of produce will increase (2)
- Profits for farming communities will diminish (2)
- Shortage of water for domestic water usage on farms (2)
- Some farms become abandoned due to lower yield (2)
- Acid rain stunts the growth of crops (2)
- Increase in food insecurity (2)
[ANY TWO] (2 x 2) (4)
4.5
4.5.1 Negative (1) (1 x 1) (1)
4.5.2 Non-metallic mineral products (1) (1 x 1) (1)
4.5.3 Clothing (1) (1 x 1) (1)
4.5.4
- Increased costs of raw materials (2)
- Increased imports (2)
- Illegal imports/Informal trading of illegally imported goods (2)
- Cheap imports from other countries e.g. China (2)
- Clothing industry cannot compete with the imitations and fake/cheap brand names (2)
- South African labour laws and the minimum wage increases production costs (2)
- No pride in producing locally made products (2)
- Decreased support for locally made products (2)
[ANY ONE] (1 x 2) (2)
4.5.5
- Labour disputes and strikes reduce productivity (2)
- Demand for higher wages increases production costs (2)
- Lack of specialist skills (late arrival/absenteeism) (2)
- Perceived poor work ethic (2)
- Constant absenteeism due to chronic illnesses (or examples) (2)
[ANY ONE] (1 x 2) (2)
4.5.6
- Acts as economic stimulus (2)
- Creates more employment opportunities/jobs (2)
- Develops a broader skills based labour force (2)
- Higher wages/salaries in manufacturing sector (2)
- People would be able to enjoy a better standard of living (2)
- People would have higher purchasing power which improves the manufacturing sector (2)
- Broadens/Increases the tax base of the country (2)
- Higher quality products from manufactured goods (2)
- Assists with import replacements (2)
- Encourages the multiplier effect that will strengthen other industries (2)
- Stimulates beneficiation that promotes industrial development (2)
- Attracts more foreign investment (2)
- Export more manufactured goods, will earn higher foreign revenues (2)
- Higher profits gained from manufactured goods (2)
- Stimulates the development of infrastructure (2)
- Stimulated the development of transport networks (2)
- Makes a contribution to the GDP (2)
[ANY TWO] (2 x 2) (4)
4.5.7
- Protect local manufacturers (2)
- Liberalisation of trade/free trade (2)
- Focus on the export market (2)
- Encourage import substitution (2)
- Encourage more foreign investment (2)
- Up skilling of labour (2)
- More stable government (2)
- Introduce government policies (2)
- Subsidise locally manufactured goods (2)
- Get rid of the stigma of corruption (2)
- Increase labour wages (2)
- Greater government investments in the manufacturing sector (2)
- Attend/host trade fairs (2)
- Establish trade agreements/blocs (2)
[ANY TWO] (2 x 2) (4)
4.6
4.6.1 Informal trading refers to business activities which are unregistered and do not pay tax (1) [CONCEPT] (1 x 1) (1)
4.6.2 R485 Billion (1) (1 x 1) (1)
4.6.3 66% (1) (1 x 1) (1)
4.6.4
- It is conveniently located close to customers (2)
- Many people can walk to the informal trader (2)
- Most people lack private transport to travel to formal stores (2)
- Goods are much cheaper than in a formal store (2)
- Mainly sells low order/convenience goods (2)
- Offers them an account (2)
- No set opening and closing times/open 7 days a week (2)
- Group purchasing by foreigners secure discounts (2)
- Small range serviced by a low threshold population/Locals buy often (2)
[ANY TWO] (2 x 2) (4)
4.6.5
- Foreign nationals that come to South Africa struggle to find jobs (2)
- Many Foreign nationals cannot apply for formal jobs (2)
- It is easier to start their own informal business (2)
- Foreign nationals are entrepreneurial (2)
- Prepared to take a minimal profit (2)
- Foreign nationals have access to a lot of cheaper goods (2)
- Foreign nationals have formal education but are prepared to do any job (2)
- No restriction on business hours therefore shops can trade longer hours (2)
- Strong work ethic to survive in a foreign country (2)
[ANY FOUR] (4 x 2) (8) [75]
TOTAL: 225
GEOGRAPHY PAPER 2 GRADE 12 MEMORANDUM - AMENDED SENIOR CERTIFICATE EXAMS PAST PAPERS AND MEMOS MAY/JUNE 2018
GEOGRAPHY
PAPER 2
GRADE 12
AMENDED SENIOR CERTIFICATE EXAMS
PAST PAPERS AND MEMOS
MAY/JUNE 2018
RESOURCE MATERIAL
- An extract from topographic map 3318BC MALMESBURY.
- Orthophoto map 3318 BC 25 MALMESBURY.
- NOTE: The resource material must be collected by schools for their own use.
INSTRUCTIONS AND INFORMATION
- Write your EXAMINATION NUMBER and CENTRE NUMBER in the spaces provided on the cover page.
- Answer ALL the questions in the spaces provided in this question paper. You are provided with a 1 : 50 000 topographical map (3318BC
- MALMESBURY) and an orthophoto map (3318 BC 25 MALMESBURY) of a part of the mapped area.
- You must hand the topographic map and the orthophoto map to the invigilator at the end of this examination session.
- You may use the blank page at the end of this question paper for all rough work and calculations. Do NOT detach this page from the question paper.
- Show ALL calculations and formulae, where applicable. Marks will be allocated for these.
- Indicate the correct unit of measurement in the final answer for all calculations. No marks will be awarded for answers with no/incorrect units of measurement.
- You may use a non-programmable calculator and a magnifying glass.
- The area demarcated in RED on the topographic map represents the area covered by the orthophoto map.
- The following English terms and their Afrikaans translations are shown on the topographic map:
ENGLISH
Canal
Furrow
Golf Course
Prison
Refuse Dump
River
Sewerage Works
GENERAL INFORMATION ON MALMESBURY Malmesbury is a town of approximately 36 000 inhabitants, about 65 km north of Cape Town. The town has a moderate climate due to the influence of the Atlantic Ocean. Rainfall is seasonal, with the highest average rainfall being in winter. The area is especially known for its wheat farming and wine production.
[Source: http://en.wikipedia.org/wiki/malmesbury] |
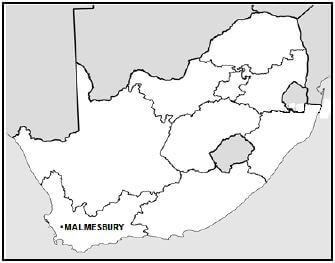

MEMORANDUM
QUESTION 1: MULTIPLE-CHOICE QUESTIONS
The questions below are based on the 1 : 50 000 topographic map (3318BC MALMESBURY) as well as the orthophoto map of a part of the mapped area. Various options are provided as possible answers to the following questions. Choose the answer and write only the letter (A–D) in the block next to each question.
1.1 B
1.2 D
1.3 C
1.4 A
1.5 B
1.6 B
1.7 A
1.8 C
1.9 C
1.10 B
1.11 A
1.12 D
1.13 B
1.14 D
1.15 A (15 × 1) [15]
QUESTION 2: MAP CALCULATIONS AND TECHNIQUES
2.1 Products from Malmesbury are transported along the N7 national road to Cape Town.
2.1.1 Determine if vehicles travelling from Malmesbury to N in block I8 on the topographic map, will drive uphill or downhill.
- Downhill ✓ (1 x 1) (1)
LINK 2.1.2 Give a reason for your answer to QUESTION 2.1.1.
- The height of bench marks (132.3 to 113.3) is decreasing from Malmesbury to N ✓
Contour lines are decreasing in height towards N ✓
[Any ONE] (1 x 1) (1)
2.1.3 Calculate the distance, in km, from N in block I8 on the topographic map to Cape Town. Show ALL calculations. Marks will be awarded for calculations. Clearly indicate the unit of measurement in your final answer.
Formula: ActualDistance = Map Distance x Scale
- 3.1 cm✓ [Range: 3.0 cm – 3.2 cm]
3.1 cm x 0.5 ✓
= 1.55 (km) ✓ [Range: 1.5 km – 1.6 km] OR
OR - 3.1cm ✓
3.1 cm x 50 000
100 000
15.5
10
1.55 (km) ✓ - Distance to Cape Town = 1.55 + 52 km = 53.55 km✓
[Range: 53.5 km – 53.6km] (4 x 1) (4)
2.2 Refer to line O-P that connects contour line 120 at O and spot height 162 at P in blocks I9 and I11 on the topographical map.
Draw a freehand cross-profile from O to P.
- Use the block below to draw the cross-profile.
- Use an arrow to indicate the accurate position of the other road on the cross profile.
 (2 x 1) (2)
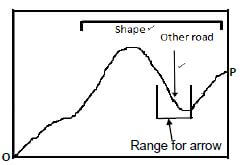 (2 x 1) (2)
 2.2.2 Give ONE reason why there is no intervisibility between O and P.
- There is an obstruction between O and P ✓
There is a high lying area/hill between O and P ✓
[Any ONE] (1 x 1) (1)
2.2.3 If you use a vertical scale of 1 cm represents 25 m to draw the cross-profile, determine the vertical exaggeration of the cross profile. Show ALL calculations. Marks will be awarded for calculations. Clearly indicate the unit of measurement in your answer.
Formula: Vertical exaggeration = vertical scale
horizontal scale
- 1
2 500
1
50 000
1 × 50 000
2 500 1
= 20 times
OR - 1 : 2 500 ✓
1 : 50 000 ✓
1 × 50 000
2 500 1
[Give mark if substitution is not shown in first step]
= 20 times ✓ (4 x 1) (4)
2.3 Calculate the magnetic bearing on the topographic map, from the reservoir (Q) in block B5 to spot height 317 (R) in block D8 for the current year.
- True bearing: 128º ✓ (Range: 127º - 129º)
- Difference in years: 2018 – 2002 = 16 ✓years
- Mean annual change: 6'✓ W
- Total change: 16 x 6 = 1º36' (96')✓ W
- Magnetic declination for 2018: 23º21' +✓ 1º36' = 24º57'W ✓
- Magnetic bearing for 2018: 128º + 24º57' = 152º57'W ✓
(Range: 151º57'W - 153 º57'W) (7 x 1) (7) [20]
QUESTION 3: APPLICATION AND INTERPRETATION
3.1 Malmesbury receives seasonal rainfall.
3.1.1 Name the season in which Malmesbury receives its highest rainfall.
- Winter ✓ (1 x 1) (1)
3.1.2 Which weather system is responsible for Malmesbury receiving its highest rainfall in the season named in QUESTION 3.1.1.
- Mid-latitude cyclone/Extra tropical cyclone/
Frontal depression/Temperate cyclone ✓
(Cold front) ✓
[Any ONE] (1 x 1) (1)
3.1.3 Give ONE point of evidence from the topographic map which indicates that Malmesbury receives seasonal rainfall.
- There are many non-perennial rivers/water ✓
- There are many dams ✓
- Many windpumps/reservoirs ✓
- There are canals/furrows ✓
- The index to sheet/map index indicates that Malmesbury is in the Western Cape ✓
- It experiences a Mediterranean climate ✓
[Any ONE] (1 x 1) (1)
3.2 Refer to Abbotsdale, situated in blocks I7 and I8 on the valley floor, on the topographic map.
3.2.1 Is the local wind responsible for the cool conditions experienced in Abbotsdale at night time, an anabatic or katabatic wind?
- Katabatic ✓ (1 x 1) (1)
3.2.2 Why does this local wind, named in QUESTION 3.2.1, result in a high concentration of pollution in Abbotsdale at night?
- There is more subsiding air during the night which pushes the inversion layer/thermal belt/pollution dome lower ✓✓
A lower inversion layer/thermal belt/pollution dome will result in a high pollution concentration ✓✓
[Any ONE] (1 x 2) (2)
3.2.3 With specific reference to the topographic map, what can the Abbotsdale local government (municipality) do to reduce the high concentration of pollution?
- They could plant more vegetation/trees in the area/roof gardens/green parks/green belts (increase afforestation)✓✓
Do not remove existing vegetation/trees (decrease deforestation) ✓✓
Relocate the refuse dump further away from Abbotsdale ✓✓
Recycling of waste ✓✓
Reduce waste production ✓✓
Promote the use of eco-friendly products ✓✓
Educate the community about the importance of reducing the pollution concentration (candidates can give examples) ✓✓
Reduce night time activities such as burning, industrial, etc. ✓✓
[Any ONE] (1 x 2) (2)
3.3 Refer to area T on the topographic map. It shows a dendritic drainage pattern.
3.3.1 Give TWO characteristics, visible on the topographic map, which indicates that a dendritic drainage pattern is shown.
- It resembles branches of a tree ✓
The tributaries meet the main stream at acute angles/angles less than 90º ✓ (2 x 1) (2)
3.3.2 State a characteristic of the underlying rock structure associated with a dendritic drainage pattern.
- Rocks with uniform resistance to erosion✓
- Horizontal rock structure ✓
- Massive resistant rocks ✓
[Any ONE] (1 x 1) (1)
3.3.3 With reference to area T, give the advantage of a dendritic drainage pattern for cultivation.
- River channels are spread out evenly resulting in all parts of the cultivated land receiving water. ✓✓
- Water from the tributaries and the river equally available ✓✓
[Any ONE] (1 x 2) (2)
3.4 Malmesbury is a central place town according to its main function.
3.4.1 Give ONE reason visible on the topographic map to support the statement that Malmesbury is a central place.
- Transport networks lead from all directions to Malmesbury making it accessible to the surrounding areas ✓✓
- Malmesbury has urban services (candidates may give examples of urban services) ✓✓
- Malmesbury is surrounded by farms which require urban services ✓✓
[Any ONE] (1 x 2) (2)
3.4.2 Malmesbury experienced urban expansion, resulting in a change in the towns' original shape.
- State the shape of Malmesbury visible on the topographic map.
- Stellar/Star shaped ✓ (1 x (1) (1)
- Give the main factor responsible for the current shape of Malmesbury?
- Transport networks/Roads/Railway lines ✓ (1 x 1) (1)
3.4.3 Which physical (natural) factor may limit the expansion of Malmesbury in a south-easterly direction into block H12?
- Steep gradient ✓✓
- Hilly area ✓✓
[Any ONE] (1 x 2) (2)
3.5 Refer to area 4 on the orthophoto map.
3.5.1 Area 4 is being prepared for the planting of an agricultural product. Name the agricultural product that will be planted in area 4.
- Grapes ✓ (1 x 1) (1)
3.5.2 State the main secondary activity in Malmesbury associated with the agricultural product named in QUESTION 3.5.1.
- Wine production ✓
- Grape juice production ✓
- Raisins processing ✓
- Grape seed oil processing ✓
[Any ONE] (1 x 1) (1)
3.5.3 Suggest how the secondary activity stated in QUESTION 3.5.2 can improve the local economy of Malmesbury.
- Malmesbury can have a wine festival ✓✓
- Tours can be organised through the vineyards and wineries ✓✓
- They could have wine tasting tours ✓✓
- Tourists bring money into the town ✓✓
- Jobs are created (in manufacturing of grape products/processing) ✓✓
- Export of grape products will boost the local economy ✓✓
- Improved infrastructure attracts business (can give examples) ✓✓
- Multiplier effect will result in more economic development ✓✓
- Selling grape products (can give examples) to the locals/tourists ✓✓
[Any TWO] (2 x 2) (4) [25]
QUESTION 4: GEOGRAPHICAL INFORMATION SYSTEMS (GIS)
4.1 Refer to the orthophoto map.
4.1.1 State the difference between spatial and attribute data.
- Spatial Data: The location (and shape) of a feature✓
[Concept] - Attribute Data: Refers to the description/characteristics (further information) of the location (and shape) of a feature (spatial data)✓
[Concept] (2 x 1) (2)
4.1.2 The N7 national road is a tarred road. Would you consider this information to be spatial or attribute data?
- Attribute data ✓ (1 x 1) (1)
LINK 4.1.3 Give a reason for your answer to QUESTION 4.1.2
- It gives descriptions/characteristics (further information) regarding the type of road ✓✓
- It gives the description/characteristic (further information) about the road being tarred ✓✓
[Any ONE] (1 x 2) (2)
4.2 Refer to blocks C4, D3, D4 and D5 on the topographic map showing an example of buffering. (S points to areas of buffering.)
4.2.1 What is buffering?
- It is the demarcation of an area around/along a feature ✓
[Concept] (1 x 1) (1)
4.2.2 Explain the positive impact that buffering will have on environmental sustainability in the area.
- By avoiding human activities along the river it will assist in maintaining the biodiversity of the river ✓✓
- It will reduce amount of chemicals/fertilizers/pollutants entering into the river maintaining its water quality ✓✓
- River banks protected/stabilised preventing flooding ✓✓
- Flood prevention will limit soil erosion ✓✓
- It will allow the river to maintain its natural course ✓✓
- Limit the effect on the natural capacity of the river ✓✓
(Any TWO) (2 x 2) (4)
4.3 Refer to block C11 on the topographic map.
4.3.1 Define the term data integration.
- Taking data from different sources and combining it ✓
[Concept] (1 x 1) (1)
4.3.2 Give examples of the following data layers found in block C11.
- An infrastructure layer:
- Track/Hiking trail✓
- Dam wall ✓
- Power line ✓
- Furrow ✓
- Farm boundaries ✓
[Any ONE] (1 x 1) (1)
- A drainage layer:
- (Non-perennial) River ✓
- Dam/perennial water ✓
[Any ONE] (1 x 1) (1)
4.3.3 State the relationship between agricultural activities and the features of drainage layers in block C11.
- The dams are situated close to the agricultural activities ✓✓
- River/dam provides water for irrigation of crops ✓✓
[Any ONE] (1 x 2) (2) [15]
GRAND TOTAL: 75
GEOGRAPHY PAPER 2 GRADE 12 QUESTIONS - AMENDED SENIOR CERTIFICATE EXAMS PAST PAPERS AND MEMOS MAY/JUNE 2018
GEOGRAPHY
PAPER 2
GRADE 12
AMENDED SENIOR CERTIFICATE EXAMS
PAST PAPERS AND MEMOS
MAY/JUNE 2018
RESOURCE MATERIAL
- An extract from topographic map 3318BC MALMESBURY.
- Orthophoto map 3318 BC 25 MALMESBURY.
- NOTE: The resource material must be collected by schools for their own use.
INSTRUCTIONS AND INFORMATION
- Write your EXAMINATION NUMBER and CENTRE NUMBER in the spaces provided on the cover page.
- Answer ALL the questions in the spaces provided in this question paper. You are provided with a 1 : 50 000 topographical map (3318BC
- MALMESBURY) and an orthophoto map (3318 BC 25 MALMESBURY) of a part of the mapped area.
- You must hand the topographic map and the orthophoto map to the invigilator at the end of this examination session.
- You may use the blank page at the end of this question paper for all rough work and calculations. Do NOT detach this page from the question paper.
- Show ALL calculations and formulae, where applicable. Marks will be allocated for these.
- Indicate the correct unit of measurement in the final answer for all calculations. No marks will be awarded for answers with no/incorrect units of measurement.
- You may use a non-programmable calculator and a magnifying glass.
- The area demarcated in RED on the topographic map represents the area covered by the orthophoto map.
- The following English terms and their Afrikaans translations are shown on the topographic map:
ENGLISH
Canal
Furrow
Golf Course
Prison
Refuse Dump
River
Sewerage Works
GENERAL INFORMATION ON MALMESBURY Malmesbury is a town of approximately 36 000 inhabitants, about 65 km north of Cape Town. The town has a moderate climate due to the influence of the Atlantic Ocean. Rainfall is seasonal, with the highest average rainfall being in winter. The area is especially known for its wheat farming and wine production.
[Source: http://en.wikipedia.org/wiki/malmesbury] |
QUESTIONS
QUESTION 1: MULTIPLE-CHOICE QUESTIONS
The questions below are based on the 1 : 50 000 topographic map (3318BC MALMESBURY) as well as the orthophoto map of a part of the mapped area. Various options are provided as possible answers to the following questions. Choose the answer and write only the letter (A–D) in the block next to each question.
1.1 The city situated approximately 65 km south of Malmesbury is …
- Paarl.
- Cape Town.
- Port Elizabeth.
- Klipheuwel.
1.2 In the map index of 3318BC, the 18 represents …
- 18° south of the equator.
- 18° west of the Greenwich Meridian.
- 18° north of the equator.
- 18° east of the Greenwich Meridian.
1.3 … aerial photographs are used to create the orthophoto map.
- Horizontal
- Satellite
- Vertical
- Oblique
1.4 The contour interval of the orthophoto map is … metres.
- 5
- 10
- 15
- 20
1.5 When you use the main road in block I11 on the topographic map to travel to Klipheuwel, you will be travelling in a … direction.
- east-south-easterly
- south-south-easterly
- west-north-westerly
- north-north-westerly
1.6 The source of water available for farming in block A1 on the topographic map is a …
- canal.
- windpump.
- river.
- dam.
1.7 The grid reference/co-ordinates for spot height 167 in block C6 on the topographic map is …
- 33°23'30''S 18°38'30''E/33°23,5'S 18°38,5'E.
- 18°38'30''E 33°23'30''S/18°38,5'E 33°23,5'S.
- 18°38'30''S 33°23'30''E/18°38,5'S 33°23,5'E.
- 33°23'30''E 18°38'30''S/33°23,5'S 18°38,5'S.
1.8 The land-use zone in which 5 on the orthophoto map is situated is the …
- commercial zone.
- residential zone.
- rural urban fringe.
- industrial zone.
1.9 The general flow direction of stream J in block D11 on the topographic map is …
- north.
- south.
- east.
- west.
1.10 The buildings at 1 on the orthophoto map is a …
- shop.
- prison.
- school.
- factory.
1.11 The recreational area 2 on the orthophoto map is a …
- caravan park.
- game reserve.
- golf course.
- botanical gardens.
1.12 The natural feature at line 3 on the orthophoto map is a …
- spur.
- gap.
- saddle.
- valley.
1.13 The street pattern at K in block G12 on the topographic map is …
- planned irregular.
- grid iron.
- unplanned irregular.
- radial.
1.14 The settlement demarcated at area L in blocks H8 and I8 on the topographic map is a …
- hamlet.
- city.
- town.
- village.
1.15 The main factor evident on the topographic map, that influenced the site of the settlement at M in block C2, is the …
- slope aspect.
- perennial water.
- fertile soil.
- pasturage.
(15 x 1) [15]
QUESTION 2: MAP CALCULATIONS AND TECHNIQUES
2.1 Products from Malmesbury are transported along the N7 national road to Cape Town.
2.1.1 Determine if vehicles travelling from Malmesbury to N in block I8 on the topographic map, will drive uphill or downhill. (1 x 1) (1)
2.1.2 Give a reason for your answer to QUESTION 2.1.1. (1 x 1) (1)
2.1.3 Calculate the distance, in km, from N in block I8 on the topographic map to Cape Town. Show ALL calculations. Marks will be awarded for calculations. Clearly indicate the unit of measurement in your final answer.
Formula: ActualDistance = Map Distance x Scale (4 x 1) (4)
2.2 Refer to line O-P that connects contour line 120 at O and spot height 162 at P in blocks I9 and I11 on the topographical map.
2.2.1 Draw a freehand cross-profile from O to P.
- Use the block below to draw the cross-profile.
- Use an arrow and indicate the accurate position of the other road on the cross-profile.
 (2 x 1) (2)
 (2 x 1) (2)
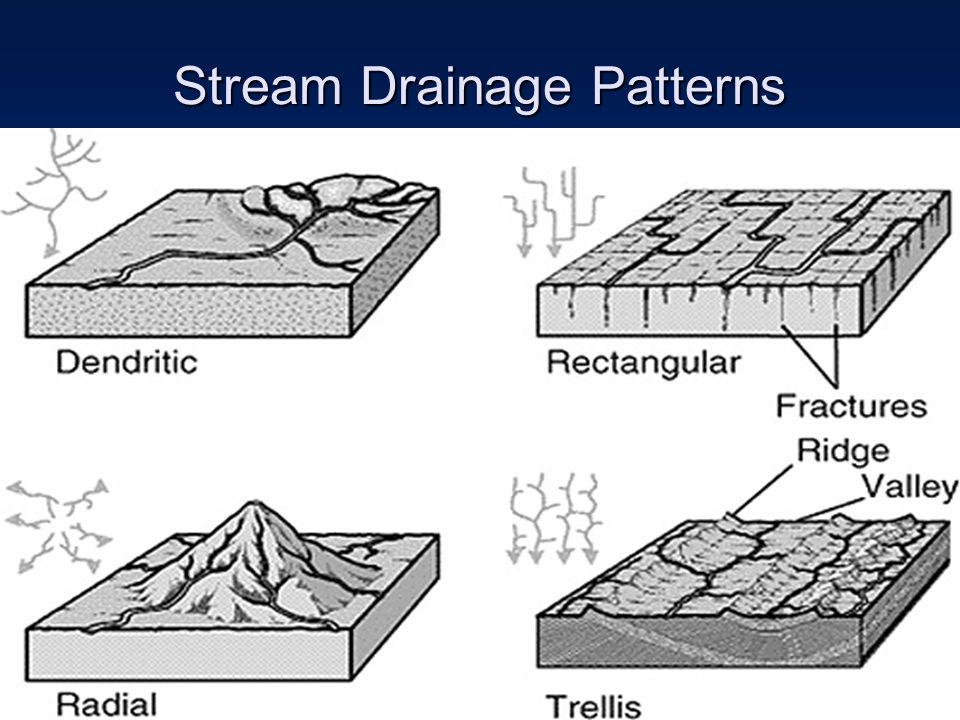
2.2.2 Give ONE reason why there is no intervisibility between O and P (1 x 1) (1)
2.2.3 If you use a vertical scale of 1 cm represents 25 m to draw the cross-profile, determine the vertical exaggeration of the cross profile. Show ALL calculations. Marks will be awarded for calculations. Clearly indicate the unit of measurement in your answer. (4 x 1) (4)
Formula: Vertical exaggeration = vertical scale
horizontal scale
2.3 Calculate the magnetic bearing on the topographic map, from the reservoir (Q) in block B5 to spot height 317 (R) in block D8 for the current year.
True bearing: __________________________________________________
Difference in years: _____________________________________________
Mean annual change: ___________________________________________
Total change: __________________________________________________
Magnetic declination for 2018: _____________________________________
Magnetic bearing for 2018: ________________________________________ (7 x 1) (7) [20]
QUESTION 3: APPLICATION AND INTERPRETATION
3.1 Malmesbury receives seasonal rainfall.
3.1.1 Name the season in which Malmesbury receives its highest rainfall. (1 x 1) (1)
3.1.2 Which weather system is responsible for Malmesbury receiving its highest rainfall in the season named in QUESTION 3.1.1? (1 x 1) (1)
3.1.3 Give ONE point of evidence from the topographic map which indicates that Malmesbury receives seasonal rainfall. (1 x 1) (1)
3.2 Refer to Abbotsdale, situated in blocks I7 and I8 on the valley floor, on the topographic map.
3.2.1 Is the local wind responsible for the cool conditions experienced in Abbotsdale at night time, an anabatic or katabatic wind? (1 x 1) (1)
3.2.2 Why does this local wind, named in QUESTION 3.2.1, result in a high concentration of pollution in Abbotsdale at night? (1 x 2) (2)
3.2.3 With specific reference to the topographic map, what can the Abbotsdale local government (municipality) do to reduce the high concentration of pollution? (1 x 2) (2)
3.3 Refer to area T on the topographic map. It shows a dendritic drainage pattern.
3.3.1 Give TWO characteristics, visible on the topographic map, which indicates that a dendritic drainage pattern is shown. (2 x 1) (2)
3.3.2 State a characteristic of the underlying rock structure associated with a dendritic drainage pattern. (1 x 1) (1)
3.3.3 With reference to area T, give the advantage of a dendritic drainage pattern for cultivation. (1 x 2) (2)
3.4 Malmesbury is a central place town according to its main function.
3.4.1 Give ONE reason visible on the topographic map to support the statement that Malmesbury is a central place. (1 x 2) (2)
3.4.2 Malmesbury experienced urban expansion, resulting in a change in the town's original shape.
- What is Malmesbury's visible shape on the topographic map. (1 x 1) (1)
- Give the main factor responsible for Malmesbury's current shape. (1 x 1) (1)
3.4.3 Which physical (natural) factor may limit the expansion of Malmesbury in a south-easterly direction into block H12? (1 x 2) (2)
3.5 Refer to area 4 on the orthophoto map.
3.5.1 Area 4 is being prepared for the planting of an agricultural product. Name the agricultural product that will be planted in area 4. (1 x 1) (1)
3.5.2 State the main secondary activity in Malmesbury associated with the agricultural product named in QUESTION 3.5.1. (1 x 1) (1)
3.5.3 Suggest how the secondary activity stated in QUESTION 3.5.2 can improve the local economy of Malmesbury. (2 x 2) (4) [25]
QUESTION 4: GEOGRAPHICAL INFORMATION SYSTEMS (GIS)
4.1 Refer to the orthophoto map.
4.1.1 State the difference between spatial and attribute data.
Spatial data: __________________________________________
Attribute data: _________________________________________ (2 x 1) (2)
4.1.2 The N7 national road is a tarred road. Would you consider this information to be spatial or attribute data? (1 x 1) (1)
4.1.3 Give a reason for your answer to QUESTION 4.1.2. (1 x 2) (2)
4.2 Refer to blocks C4, D3, D4 and D5 on the topographic map showing an example of buffering. (S points to areas of buffering.)
4.2.1 What is buffering? (1 x 1) (1)
4.2.2 Explain the positive impact that buffering will have on environmental sustainability in the area. (2 x 2) (4)
4.3 Refer to block C11 on the topographic map.
4.3.1 Define the term data integration. (1 x 1) (1)
4.3.2 Give examples of the following data layers found in block C11.
- An infrastructure layer: _____________________________ (1 x 1) (1)
- A drainage layer: _________________________________ (1 x 1) (1)
4.3.3 State the relationship between agricultural activities and the features of drainage layers in block C11. (1 x 2) (2)
[15]
GRAND TOTAL: 75
GEOGRAPHY PAPER 1 GRADE 12 QUESTIONS - AMENDED SENIOR CERTIFICATE EXAMS PAST PAPERS AND MEMOS MAY/JUNE 2018
GEOGRAPHY
PAPER 1
GRADE 12
AMENDED SENIOR CERTIFICATE EXAMS
PAST PAPERS AND MEMOS
MAY/JUNE 2018
INSTRUCTIONS AND INFORMATION
- This question paper consists of FOUR questions.
- Answer ANY THREE questions of 75 marks each.
- All diagrams are included in the ANNEXURE.
- Leave a line between subsections of questions answered.
- Start EACH question at the top of a NEW page.
- Number the answers correctly according to the numbering system used in this question paper.
- Number the answers in the centre of the line.
- Do NOT write in the margins of the ANSWER BOOK.
- Draw fully labelled diagrams when instructed to do so.
- Answer in FULL SENTENCES, except where you have to state, name, identify or list.
- Units of measurement MUST be indicated in your final answers, e.g. 1 020 hPa, 14 °C and 45 m.
- Write neatly and legibly.
QUESTIONS
SECTION A: CLIMATE, WEATHER AND GEOMORPHOLOGY
Answer at least ONE question in this section. If you answer ONE question in SECTION A, you must answer TWO questions in SECTION B.
QUESTION 1
1.1 Refer to FIGURE 1.1 showing stages in the development of a mid-latitude cyclone.
1.1.1 Name the front at 60° S, in diagram X, where mid-latitude cyclones develop.
1.1.2 Name the stage of development of the mid-latitude cyclone at X.
1.1.3 Give the lowest air pressure recorded in stage Y.
1.1.4 Which mid-latitude cyclone, Y or Z, is older?
1.1.5 Name the stage of development of the mid-latitude cyclone at Z.
1.1.6 What evidence suggests that the illustrated mid-latitude cyclone is in the Southern Hemisphere?
1.1.7 What is the term used to describe mid-latitude cyclones that are linked to one another? (7 x 1) (7)
1.2 Choose the correct word from those given in brackets which will make the sentence TRUE. Write down only the word next to the question numbers (1.2.1 to 1.2.8).
1.2.1 Rivers that flow all year round are (permanent/periodic) rivers.
1.2.2 (Exotic/Periodic) rivers flow during the rainy season only.
1.2.3 Rivers that only flow after heavy rainfall are known as (episodic/exotic) rivers.
1.2.4 The majority of rivers in South Africa are (periodic/permanent).
1.2.5 In (permanent/episodic) rivers the river bed is always below the water table.
1.2.6 The water table is always below the river bed in (exotic/episodic) rivers.
1.2.7 (Periodic/Exotic) rivers flow all year round because they are fed by tributaries in high rainfall areas.
1.2.8 (Permanent/Periodic) rivers are characteristic of interchanging seasons of high and low rainfall. (8 x 1) (8)
1.3 FIGURE 1.3 is a diagram showing the influence of the plateau on South Africa's climate.
1.3.1 Does sketch A or sketch B indicate a winter condition? (1 x 1) (1)
1.3.2 Give evidence from the sketch to support your answer to QUESTION 1.3.1. (1 x 1) (1)
1.3.3 How does the inversion layer form in sketch A? (1 x 2) (2)
1.3.4 Account for the change in the position of the height of the inversion layer in sketch B. (2 x 2) (4)
1.3.5 Write a paragraph of approximately EIGHT lines explaining how the changing position of the height of the inversion layer over the plateau influences the climate in the interior of South Africa during summer and winter. (4 x 2) (8)
1.4 Study FIGURE 1.4 which is based on valley climates.
1.4.1 Why was the site of Pietermaritzburg a poor choice for the development of a city? (1 x 1) (1)
1.4.2 Give evidence from the article why pollution levels are much higher in winter. (2 x 1) (2)
1.4.3 Refer to the 'brown haze' (mixture of fog and pollutants) and answer the questions that follow.
- Name the local wind that causes the 'brown haze' to disappear after 11:00. (1 x 1) (1)
- Give ONE characteristic of the local wind, named in QUESTION 1.4.3(a), which assists with the dispersal (removal) of the 'brown haze'. (1 x 2) (2)
- Draw a labelled sketch to illustrate the development of the local wind that causes the 'brown haze' to disappear. The sketch must show the wind direction and ONE descriptive label. (2 x 2) (4)
1.4.4 Why is the 'brown haze' a safety hazard for motor vehicle users? (2 x 2) (4)
1.5 Study FIGURE 1.5 which shows two types of drainage patterns (A and B).
1.5.1 Name the drainage patterns labelled A and B. (2 x 1) (2)
1.5.2 Name the underlying rock structure that gives rise to drainage patterns A and B. (2 x 1) (2)
1.5.3 State ONE of the following:
- Similarity between drainage patterns A and B (1 x 2) (2)
- Difference between drainage patterns A and B (1 x 2) (2)
1.5.4 Why are the tributaries in drainage pattern A short in comparison to the length of the main river? (1 x 2) (2)
1.5.5 Account for the main streams in drainage pattern B having 90° bends. (2 x 2) (4)
1.6 Study FIGURE 1.6 which is an aerial photograph of a delta.
1.6.1 What is a delta? (1 x 1) (1)
1.6.2 Give TWO pieces of evidence from the photograph to support the statement that a delta is shown. (2 x 1) (2)
1.6.3 Name the feature labelled A. (1 x 1) (1)
1.6.4 Briefly describe the formation of feature A. (1 x 2) (2)
1.6.5 Why are some coastlines not suitable for the development of deltas? (1 x 2) (2)
1.6.6 Write a paragraph of approximately EIGHT lines and explain why deltas are ideal for farming. (4 x 2) (8) [75]
QUESTION 2
2.1 Refer to FIGURE 2.1 which indicate pressure cells and match EACH of the descriptions below with one of the pressure cells, A or B.
2.1.1 Pressure cell that gives rise to unstable weather conditions
2.1.2 Air movement is anticlockwise in the Southern Hemisphere
2.1.3 Associated with cold, subsiding air
2.1.4 Surface air converges into this pressure cell
2.1.5 The lowest pressure is found in the centre of the pressure cell
2.1.6 Upper air converges into this pressure cell
2.1.7 Contributes to the dry conditions over the western half of South Africa
2.1.8 Draws moisture over South Africa in summer (8 x 1) (8)
2.2 Choose a term from COLUMN B that matches the geomorphologic description in COLUMN A. Write only the letter (A–H) next to the question numbers (2.2.1 to 2.2.8) in the ANSWER BOOK, e.g. 2.2.9 J.
COLUMN A | COLUMN B |
2.2.1 Water flowing downslope over the land |
|
2.3 Study FIGURE 2.3, a media report, with the title 'Is South Africa due for a tropical cyclone?'.
2.3.1 Which coastline of South Africa is affected by tropical cyclones? (1 x 1) (1)
2.3.2 What are the 'current conditions' referred to in the extract that will result in a low pressure forming in the central Mozambique Channel? (2 x 1) (2)
2.3.3 Describe TWO reasons why people in certain parts of South Africa have been warned to be careful. (2 x 2) (4)
2.3.4 Write a paragraph of approximately EIGHT lines explaining why South Africa does not usually experience the expected full impact of tropical cyclones? (4 x 2) (8)
2.4 FIGURE 2.4 shows a coastal low pressure.
2.4.1 What is a coastal low pressure? (1 x 1) (1)
2.4.2 Describe the path that the coastal low pressure follows. (2 x 1) (2)
2.4.3 Why is the air ahead of the coastal low (B) drier than the air behind the coastal low (A)? (2 x 2) (4)
2.4.4 Explain why different types of precipitation are expected along the west and east coast as the coastal low passes by. (2 x 2) (4)
2.4.5 Why are these low pressure systems usually associated with high temperatures along the coast in winter? (2 x 2) (4)
2.5 Study FIGURE 2.5, photograph that shows the course of a river. 2.5.1 Which course of the river is represented in FIGURE 2.5? (1 x 1) (1)
2.5.2 Draw a labelled cross-section showing the difference in the shapes of the slopes associated with river banks A and B. (3 x 1) (3)
2.5.3 Answer the following questions with reference to river bank A.
- Name the slope associated with river bank A. (1 x 1) (1)
- Explain the steepness of the slope along river bank A. (1 x 2) (2)
2.5.4 Give reasons for the sand deposits along river bank B. (2 x 2) (4)
2.5.5 Explain why a canoeist (someone who rows a small boat) would prefer to row along river bank A than river bank B. (2 x 2) (4)
2.6 FIGURE 2.6 is a case study from the Mail & Guardian, about the human impact on the Vaal Dam.
2.6.1 How much water does the Vaal Dam hold? (1 x 1) (1)
2.6.2 Excluding Gauteng, name TWO other provinces dependent on water from the Vaal Dam, as shown on the map. (2 x 1) (2)
2.6.3 From which neighbouring country does South Africa import fresh water? (1 x 1) (1)
2.6.4 Why has it become necessary to treat the above-mentioned water? (1 x 1) (1)
2.6.5 Briefly explain the consequences of unsafe levels of bacteria, like E. coli, for people that drink the river water. (1 x 2) (2)
2.6.6 Write a paragraph of approximately EIGHT lines suggesting sustainable strategies that the government should implement (put in place) to solve the problem of water pollution in the Vaal Dam. (4 x 2) (8) [75]
SECTION B: RURAL AND URBAN SETTLEMENTS AND SOUTH AFRICAN ECONOMIC GEOGRAPHY
Answer at least ONE question in this section. If you answer ONE question in SECTION B, you must answer TWO questions in SECTION A.
QUESTION 3
3.1 Choose a term in COLUMN B that matches the description in COLUMN A. Write only the letter (A–I) next to the question numbers (3.1.1 to 3.1.8) in the ANSWER BOOK, e.g. 3.1.9 J.
COLUMN A | COLUMN B |
3.1.1 Place where goods are transferred from one form of transport to another |
|
3.2 FIGURE 3.2 is a table of data relating to the economic activities of South Africa.
3.2.1 Name the economic sector into which agriculture, forestry and fishing is categorised.
3.2.2 Which primary economic activity has shown the lowest growth rate during the period 2010 to 2015?
3.2.3 Which economic activity is projected to show the lowest growth rate in 2018?
3.2.4 Name the tertiary activity that has the highest growth rate projected for 2018.
3.2.5 Into which economic sector would 'general government' be classified?
3.2.6 Which year shows the highest total GDP growth of all economic activities?
3.2.7 Calculate the GDP growth rate of finance, insurance and business services from 2016 to 2018. (7 x 1) (7)
3.3 The increasing rate of rural-urban migration causes many problems for rural and urban settlements.
3.3.1 Define the term rural-urban migration. (1 x 1) (1)
3.3.2 Name TWO environmental push factors responsible for rural-urban migration. (2 x 1) (2)
3.3.3 How will rural-urban migration cause the economy of rural areas to stagnate (stop growing)? (2 x 2) (4)
3.3.4 Write a paragraph of approximately EIGHT lines and explain why pull factors are a burden on urban municipalities (local governments). (4 x 2) (8) 3.4 FIGURE 3.4 shows a simple sketch of urban land-use zones.
3.4.1 Identify land-use zone A. (1 x 1) (1)
3.4.2 What evidence suggests that land-use zone A has a high degree of accessibility? (1 x 1) (1)
3.4.3 Indicate how the accessibility of land-use zone A impacts on the morphology of the buildings. (1 x 1) (1)
3.4.4 Draw a labelled urban profile from B to C. (4 x 1) (4)
3.4.5 Answer the following questions with reference to the transition zone.
- Why are the buildings in the transition zone poorly maintained? (1 x 2) (2)
- Give a reason for the high land values in the transition zone. (1 x 2) (2)
3.4.6 Give TWO reasons for the location of the heavy industrial zone. (2 x 2) (4)
3.5 FIGURE 3.5 gives details about agricultural trade in South Africa.
3.5.1 Name an agricultural product that is exported in an unprocessed form from South Africa. (1 x 1) (1)
3.5.2 State the difference between an unprocessed and a processed agricultural product. (2 x 1) (2)
3.5.3 What is the disadvantage of exporting unprocessed agricultural goods? (1 x 2) (2)
3.5.4 Give a physical factor that does not favour agriculture as a future development path for South Africa. (1 x 2) (2)
3.5.5 Write a paragraph of approximately EIGHT lines and give reasons for the huge decline in the number of people employed in the agricultural sector and the likely impact thereof on these people. (4 x 2) (8)
3.6 FIGURE 3.6 shows the West Coast Spatial Development Initiative.
3.6.1 In which province is the West Coast SDI located? (1 x 1) (1)
3.6.2 Name any ONE economic activity in the extract that contributes to the growth of the West Coast economy. (1 x 1) (1)
3.6.3 Give a reason for the growth of the economic activity named in QUESTION 3.6.2. (1 x 1) (1)
3.6.4 Explain why energy (power/electricity) and water security are threats to industrial growth in the West Coast SDI. (2 x 2) (4)
3.6.5 Why are well-developed transport links important to support the growth of the West Coast SDI? (2 x 2) (4)
3.6.6 How will the West Coast SDI contribute to the economic growth of in this area? (2 x 2) (4) [75]
QUESTION 4
4.1 Refer to FIGURE 4.1 on rural settlements. Match EACH of the descriptions below with ONE of diagrams A, B or C. You may choose the same settlement more than once. Write only the letter (A–C) next to the question numbers (4.1.1 to 4.1.7) in the ANSWER BOOK, e.g. 4.1.8 A.
4.1.1 Farm houses are found in a linear shape.
4.1.2 Farm houses are far apart or scattered.
4.1.3 Less safe and secure in this type of settlement.
4.1.4 This shape is influenced by a single road.
4.1.5 Settlement pattern associated with large commercial farms.
4.1.6 The shape of the settlement is stellar.
4.1.7 Individual farmlands tend to be elongated (long and narrow). (7 x 1) (7)
4.2 Choose the correct word from those given in brackets which will make the sentence TRUE. Write down only the word next to the question numbers (4.2.1 to 4.2.8).
4.2.1 Industries that produce perishable goods are mainly (market/ raw material) orientated.
4.2.2 Food processing industries, like bakeries, are generally (heavy/light) industries.
4.2.3 Industries that are located between the source of the raw materials and the customer are called (bridge/footloose) industries.
4.2.4 (Ubiquitous/Bridge) industries can locate in any geographic area.
4.2.5 (Heavy/Light) industry works with large quantities of raw materials and large-scale machinery.
4.2.6 An industry that is located close to where its customers live is known as a (raw material/market) industry.
4.2.7 A (footloose/ubiquitous) industry can be located near either the market or the source of the raw material.
4.2.8 (Heavy/Light) industries are usually located close to the rural-urban fringe. (8 x 1) (8)
4.3 FIGURE 4.3 is an extract on informal settlements.
4.3.1 What percentage of residents in South African cities live in shacks? (1 x 1) (1)
4.3.2 Give a reason for the dense clustering of shacks in informal settlements. (1 x 2) (2)
4.3.3 Outline TWO ways in which shack dwellers often show their growing discontent (unhappiness) in South Africa. (2 x 2) (4)
4.3.4 Write a paragraph of approximately EIGHT lines and suggest why people that live in informal settlements find it difficult to improve their standard of living. (4 x 2) (8)
4.4 Refer to FIGURE 4.4, an extract on environmental injustice.
4.4.1 What is an environmental injustice? (1 x 1) (1)
4.4.2 Name the environmental injustice caused by the coal-powered power station. (1 x 1) (1)
4.4.3 Why are the poor mainly affected by the environmental injustice named in QUESTION 4.4.2? (1 x 1) (1)
4.4.4 Discuss TWO negative effects of the environmental injustice mentioned in QUESTION 4.4.2 on the community. (2 x 2) (4)
4.4.5 Suggest TWO measures that can be put in place to protect this community from the environmental injustice named in QUESTION 4.4.2. (2 x 2) (4)
4.4.6 Discuss the negative impact of the location of the Medupi Power Station on the surrounding farming community. (2 x 2) (4)
4.5 Study FIGURE 4.5 which shows manufacturing activities in South Africa.
4.5.1 Does the bar graph show a positive or a negative trend for manufacturing in 2017? (1 x 1) (1)
4.5.2 Which sector of the manufacturing industry improved in 2017? (1 x 1) (1)
4.5.3 Identify the manufacturing activity that had the least growth in 2017. (1 x 1) (1)
4.5.4 Give ONE possible reason for the lack of growth of the manufacturing activity identified in QUESTION 4.5.3. (1 x 2) (2)
4.5.5 State ONE way in which labour contributes to the negative growth of manufacturing activities in South Africa. (1 x 2) (2)
4.5.6 Why is it important to strengthen the position of manufacturing activities in South Africa? (2 x 2) (4)
4.5.7 State TWO measures that can be put in place to improve manufacturing activities in the future. (2 x 2) (4)
4.6 FIGURE 4.6 is based on informal trading.
4.6.1 Define the term informal trading. (1 x 1) (1)
4.6.2 What is the total worth of the South African food market? (1 x 1) (1)
4.6.3 What percentage of the figure stated in QUESTION 4.6.2 is accounted for by the formal trade market? (1 x 1) (1)
4.6.4 Give TWO reasons for the high turnover (amount of goods sold) that spaza outlets in townships experience. (2 x 2) (4)
4.6.5 Write a paragraph of approximately EIGHT lines and explain why 85% of informal traders are foreigners. (4 x 2) (8) [75]
GRAND TOTAL: 225
PHYSICAL SCIENCES: CHEMISTRY PAPER 2 GRADE 12 QUESTIONS - AMENDED SENIOR CERTIFICATE EXAMS PAST PAPERS AND MEMOS MAY/JUNE 2018
PHYSICAL SCIENCES: CHEMISTRY
PAPER 2
GRADE 12
AMENDED SENIOR CERTIFICATE EXAMS
PAST PAPERS AND MEMOS
MAY/JUNE 2018
INSTRUCTIONS AND INFORMATION
- Write your centre number and examination number in the appropriate spaces on the ANSWER BOOK.
- This question paper consists of TEN questions. Answer ALL the questions in the ANSWER BOOK.
- Start EACH question on a NEW page in the ANSWER BOOK.
- Number the answers correctly according to the numbering system used in this question paper.
- Leave ONE line between two subquestions, for example between QUESTION 2.1 and QUESTION 2.2.
- You may use a non-programmable calculator.
- You may use appropriate mathematical instruments.
- You are advised to use the attached DATA SHEETS.
- Show ALL formulae and substitutions in ALL calculations.
- Round off your final numerical answers to a minimum of TWO decimal places.
- Give brief motivations, discussions, et cetera where required.
- Write neatly and legibly.
QUESTIONS
QUESTION 1: MULTIPLE-CHOICE QUESTIONS
Various options are provided as possible answers to the following questions. Choose the answer and write down only the letter (A-D) next to the question numbers (1.1 to 1.10) in the ANSWER BOOK, e.g. 1.11 D.
1.1 An example of a saturated organic compound is …
- ethyne.
- propene.
- but-2-ene.
- 2-chloropropane. (2)
1.2 When ethene reacts with hydrogen gas in the presence of a catalyst, the product is …
- ethane.
- ethyne.
- ethanol.
- ethanal. (2)
1.3 Study the structural formula of the functional group below.
The structure above is the functional group of …
- esters.
- ketones.
- aldehydes.
- carboxylic acids. (2)
1.4 The potential energy graph for a hypothetical chemical reaction is shown below.
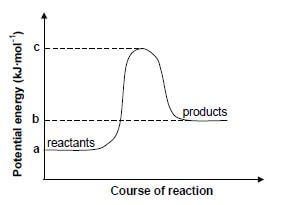
What type of reaction is taking place and what are the correct methods to calculate ΔH and Ea? (2)
| ΔH | Ea | ||
| A | Exothermic | b − a | c − b |
| B | Endothermic | b − a | c − a |
| C | Endothermic | a − b | a − c |
| D | Exothermic | a − b | b − c |
1.5 Study the hypothetical reaction below:
2P(g) + 3Q(g) → 4R(g) + 2Z(g)
The rate of the reaction in terms of the number of moles of substance P used up, is 1 x 10⁻³ mol∙dm-3∙s-1. What is the rate (in mol∙dm-3∙s-1) at which product R is formed?
- 1×10⁻³
- 4(1×10⁻³)
- 1×10⁻³
2 - 2(1 × 10⁻³) (2)
1.6 Study the following reaction at equilibrium at a certain temperature.
2SO3(g) ⇌ O2(g) + 2SO2(g) ΔH > 0
Which ONE of the following factors will change the Kc value?
- Adding more SO2(g).
- Adding a catalyst.
- Increasing the temperature.
- Increasing the pressure by decreasing the volume. (2)
1.7 Which ONE of the following represents the products formed during the hydrolysis of NH+4 (aq)?
- NH3(aq) + H2O(ℓ)
- NH3(aq) + H3O+(aq)
- NH3(aq) + OH-(aq)
- NH3(aq) + OH-(aq) + H2O(ℓ) (2)
1.8 Potassium nitrate is used as an electrolyte in the salt bridge of a copper-zinc cell. Which ONE of the following CORRECTLY shows the direction of migration of potassium and nitrate ions in the cell? (2)
| POTASSIUM IONS TO THE: | NITRATE IONS TO THE: | |
| A | Anode | Cathode |
| B | Negative electrode | Positive electrode |
| C | Zinc electrode | Copper electrode |
| D | Copper electrode | Zinc electrode |
1.9 Which ONE of the following shows the electrode where the electrons are gained in an electrolytic cell and the chemical change that occurs at this electrode? (2)
| ELECTRODE WHERE ELECTRONS ARE GAINED | CHEMICAL CHANGE | |
| A | Anode | Oxidation |
| B | Anode | Reduction |
| C | Cathode | Oxidation |
| D | Cathode | Reduction |
1.10 The industrial preparation of nitric acid is known as the …
- Haber process.
- contact process.
- Ostwald process.
- catalytic oxidation of ammonia. (2) [20]
QUESTION 2 (Start on a new page.)
Next to each letter, A to F, in the table below is the molecular formula of an organic compound.
A | C2H5Br | B | C2H4 |
C | C4H10 | D | C2H6O |
E | C3H6O | F | C3H6O2 |
2.1 Choose a molecular formula above that represents an organic compound below. Write down only the letter (A to F) next to the question numbers (2.1.1 to 2.1.5), e.g. 2.1.6 G.
2.1.1 A haloalkane (1)
2.1.2 An alcohol (1)
2.1.3 An unsaturated hydrocarbon (1)
2.1.4 An aldehyde (1)
2.1.5A product of thermal cracking of compound C (1)
2.2 If compound F is a carboxylic acid, write down the following:
2.2.1 The structural formula of a FUNCTIONAL isomer of F (2)
2.2.2 The IUPAC name of a FUNCTIONAL isomer of F (2)
2.3 Compound B is a monomer used to make a polymer. Write down the:
2.3.1 Definition of a polymer (2)
2.3.2 IUPAC name of the polymer (1)
2.3.3 Balanced equation for the polymerisation reaction (3)
2.4 Compound A is used as a reactant in the production of compound D.Name the type of reaction that takes place. (1)
2.5 State TWO changes that can be made to the reaction conditions in QUESTION 2.4 to obtain compound B, instead of D, as product. (2) [18]
QUESTION 3 (Start on a new page.)
The boiling points of straight-chain alkanes and straight-chain alcohols are compared in the table below.
NUMBER OF CARBON ATOMS | BOILING POINTS OF ALKANES (°C) | BOILING POINTS OF ALCOHOLS (°C) |
1 | - 162 | 64 |
2 | - 89 | 78 |
3 | - 42 | 98 |
4 | - 0,5 | 118 |
3.1 Explain the increase in boiling points of the alkanes, as indicated in the table. (3)
3.2 Explain the difference between the boiling points of an alkane and an alcohol, each having THREE carbon atoms per molecule, by referring to the TYPE of intermolecular forces. (4)
3.3 Does the vapour pressure of the alcohols INCREASE or DECREASE with an increase in the number of carbon atoms? (1)
3.4 How will the boiling point of 2-methylpropane compare to that of its chain isomer? Write down HIGHER THAN, LOWER THAN or EQUAL TO. Give a reason for the answer by referring to the structural differences between the two compounds. (2) [10]
QUESTION 4 (Start on a new page.)
Propan-1-ol can undergo a number of organic reactions, as indicated by the letters A to D in the diagram below.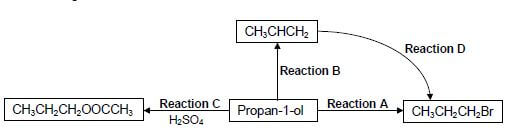
4.1 Write down the type of reaction represented by:
4.1.1 A (1)
4.1.2 B (1)
4.1.3 C (1)
4.1.4 D (1)
4.2 For reaction C, write down the:
4.2.1 Function of H2SO4 (1)
4.2.2 IUPAC name of the organic product (2)
4.2.3 Structural formula of the other organic reactant (2)
4.3 Use STRUCTURAL FORMULAE for all organic reactants and products to write a balanced equation for reaction A. (5) [14]
QUESTION 5 (Start on a new page.)
Two experiments are carried out to investigate one of the factors that affects the reaction rate between magnesium and dilute hydrochloric acid. The balanced equation below represents the reaction that takes place.
Mg(s) + 2HCℓ(aq) → MgCℓ2(aq) + H2(g)
In experiment 1 a certain mass of magnesium ribbon reacts with excess dilute hydrochloric acid. In experiment 2 magnesium powder of the same mass as the magnesium ribbon, reacts with the same volume of excess dilute hydrochloric acid. The concentration of the acid is the same in both experiments.
The apparatus below is used for the investigation.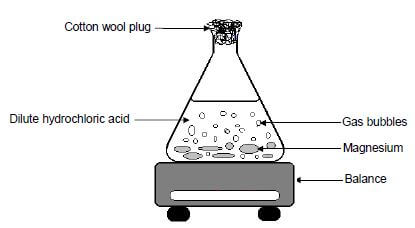
5.1 Define reaction rate. (2)
5.2 For this investigation, write down the:
5.2.1 Independent variable (1)
5.2.2 Control variable (1)
The change in mass of magnesium is calculated and recorded in 2-minute intervals for both experiments. The results obtained are shown in the graph below (NOT drawn
to scale).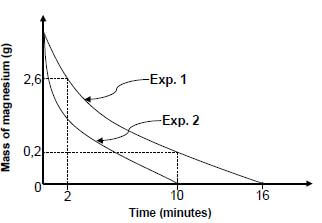
5.3 Use the information on the graph to:
5.3.1 Calculate the volume of hydrogen gas produced in experiment 1 from t = 2 minutes to t = 10 minutes Take the molar gas volume as 25 dm3∙mol-1. (5)
5.3.2 Calculate the initial mass of magnesium used if the average rate of formation of hydrogen gas in experiment 2 was 2,08 x 10⁻⁴ mol∙s-1 (5)
5.4 Use the collision theory to explain why the curve of experiment 2 is steeper than that of experiment 1. (3) [17]
QUESTION 6 (Start on a new page.)
The equation below represents a hypothetical reaction that reaches equilibrium in a closed container after 2 minutes at room temperature. The letters x, y and z represent the number of moles in the balanced equation.
xA(aq) + yB(aq) ⇌ zC(aq)
The graph below shows the change in the number of moles of reactants and products versus time during the reaction.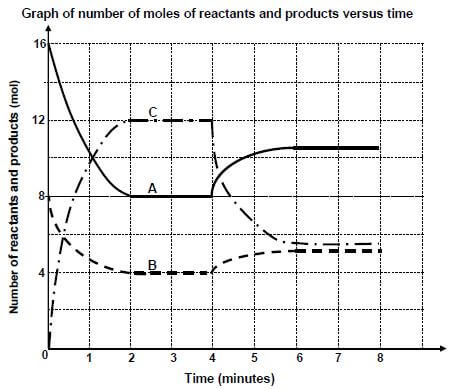
6.1Define a dynamic equilibrium. (2)
6.2 Use the information in the graph and write down the value of:
6.2.1 x (1)
6.2.2 y (1)
6.2.3 z (1)
6.3 Calculate the equilibrium constant, Kc, for this hypothetical reaction at room temperature if the volume of the closed container is 3 dm3. (7)
6.4 At t = 4 minutes, the temperature of the system was increased to 60 °C. Is the REVERSE reaction EXOTHERMIC or ENDOTHERMIC? Explain how you arrived at the answer. (3) [15]
QUESTION 7 (Start on a new page.)
The reaction between a sulphuric acid (H2SO4) solution and a sodium hydroxide (NaOH) solution is investigated using the apparatus illustrated below.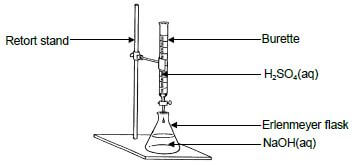
7.1 Write down the name of the experimental procedure illustrated above. (1)
7.2 What is the function of the burette? (1)
7.3 Define an acid in terms of the Arrhenius theory. (2)
7.4 Give a reason why sulphuric acid is regarded as a strong acid. (1)
7.5 Bromothymol blue is used as indicator. Write down the colour change that will take place in the Erlenmeyer flask on reaching the endpoint of the titration.
Choose from the following:
BLUE TO YELLOW YELLOW TO BLUE GREEN TO YELLOW (1)
During the titration a learner adds 25 cm3 of NaOH(aq) of concentration 0,1 mol·dm-3 to an Erlenmeyer flask and titrates this solution with H2SO4(aq) of concentration 0,1 mol·dm-3. The balanced equation for the reaction that takes place is:
2NaOH(aq) + H2SO4(aq) → Na2SO4(aq) + 2H2O(ℓ)
7.6 Determine the volume of H2SO4(aq) which must be added to neutralise the NaOH(aq) in the Erlenmeyer flask completely. (4)
7.7 If the learner passes the endpoint by adding 5 cm3 of the same H2SO4(aq) in excess, calculate the pH of the solution in the flask. (7) [17]
QUESTION 8 (Start on a new page.)
8.1 Consider the electrochemical cell represented by the cell notation below,
where X is an unknown metal:
Pt(s) | Fe2+(aq), Fe3+(aq) || X+(aq) | X(s)
The cell potential of this cell was found to be 0,03 V.
8.1.1 Write down the type of electrochemical cell illustrated above. (1)
8.1.2 What does the single line (|) in the above cell notation represent? (1)
8.1.3 Write down the half-reaction that takes place at the anode in the above cell. (2)
8.1.4 Identify X with the aid of a calculation. (5)
8.2 A Pt(s) | Fe2+(aq), Fe3+(aq) half-cell is connected to a Cu(s) | Cu2+(aq) half- cell.
Write down the:
8.2.1 Chemical symbol for the electrode in the cathode half-cell (1)
8.2.2 NAME of the oxidising agent (1)
8.2.3 Overall balanced cell reaction that takes place in this cell (3) [14]
QUESTION 9 (Start on a new page.)
The diagram below shows an electrolytic cell used to electroplate an iron rod with COPPER. Solution X is made up of an unknown NITRATE.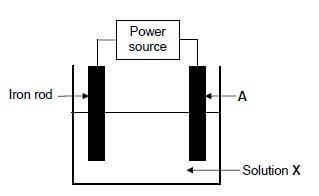
9.1 Solutions, such as solution X, are always used in electrochemical cells.
9.1.1 Write down the general term used to describe these solutions. (1)
9.1.2 What is the function of these solutions in electrochemical cells? (1)
9.2 Write down the FORMULA of solution X. (1)
9.3 Which electrode (A or IRON ROD) is the negative electrode? Give a reason for the answer. (2)
9.4 Write down the half-reaction that takes place at electrode A. (2)
9.5 Electrode A is now replaced by a silver rod without making any other changes to the cell. After a while, TWO metallic ions are found to be present in the solution.
9.5.1 Name the TWO metallic ions present in the solution. (2)
9.5.2 Refer to the relative strengths of oxidising agents to explain which ONE of the two ions will preferably be involved in the plating process. (2) [11]
QUESTION 10 (Start on a new page.)
The flow diagram below shows the steps used to prepare fertilisers X and Y. Labels I and II represent types of chemical reactions and P is a compound.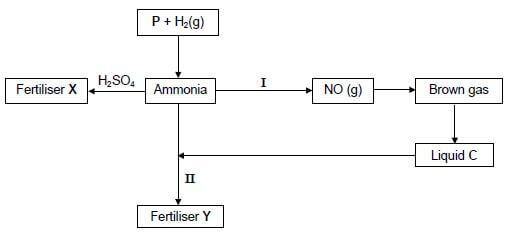
10.1 Write down the NAME of the reaction labelled:
10.1.1 I (1)
10.1.2 II (1)
10.2 Write down the NAME or FORMULA of:
10.2.1 Compound P (1)
10.2.2 The brown gas (1)
10.2.3 Liquid C (1)
10.3 Write down a balanced equation for:
10.3.1 The preparation of fertiliser X (3)
10.3.2 Reaction I (3)
10.4 Fertiliser Y is ammonium nitrate. Calculate the mass percentage of nitrogen in fertiliser Y. (3) [14]
TOTAL: 150
NATIONAL SENIOR CERTIFICATE
DATA FOR PHYSICAL SCIENCES GRADE 12 PAPER 2 (CHEMISTRY)
TABLE 1: PHYSICAL CONSTANTS
| NAME | SYMBOL | VALUE |
| Standard pressure | pθ | 1,013 x 105 Pa |
| Molar gas volume at STP | Vm | 22,4 dm3∙mol-1 |
| Standard temperature | Tθ | Tθ 273 K |
| Charge on electron | e | e -1,6 x 10⁻¹⁹ C |
| Avogadro’s constant | NA | NA 6,02 x 10²³ mol-1 |
TABLE 2: FORMULAE
n = m | n = N NA |
| c = n V or c = m MV | n = V Vm |
| caVa= na cbVb nb | pH= -log[H3O+] |
| Kw = [H3O+][OH-] = 1x10-14 at 298K | |
| Eθ cell = Eθ cathode – Eθ anode Eθ cell = Eθ reduction – Eθ oxidation Eθ cell = Eθ oxidising agent – Eθ reducing agent |
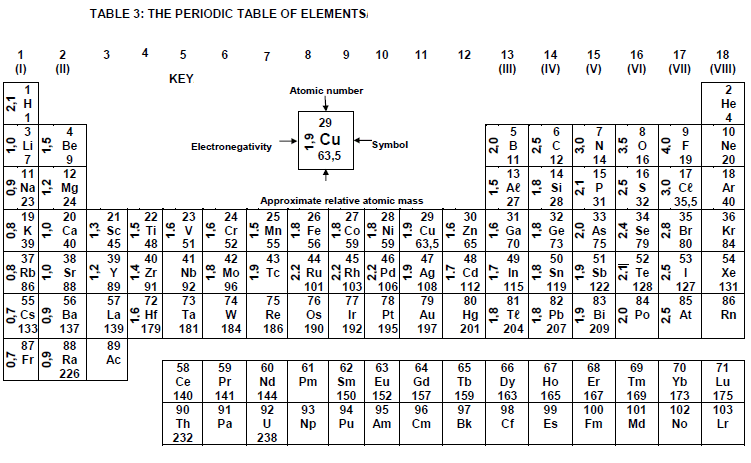
TABLE 4A: STANDARD REDUCTION POTENTIALS
TABLE 4B: STANDARD REDUCTION POTENTIALS