LIFE SCIENCES PAPER 1 GRADE 12 QUESTIONS - NSC PAST PAPERS AND MEMOS FEBRUARY/MARCH 2018
Share via Whatsapp Join our WhatsApp Group Join our Telegram GroupLIFE SCIENCES
PAPER 1
GRADE 12
NSC PAST PAPERS AND MEMOS
FEBRUARY/MARCH 2018
INSTRUCTIONS AND INFORMATION
Read the following instructions carefully before answering the questions.
- Answer ALL the questions.
- Write ALL the answers in the ANSWER BOOK.
- Start the answers to EACH question at the top of a NEW page.
- Number the answers correctly according to the numbering system used in this question paper.
- Present your answers according to the instructions of each question.
- Do ALL drawings in pencil and label them in blue or black ink.
- Draw diagrams, tables or flow charts only when asked to do so.
- The diagrams in this question paper are NOT necessarily drawn to scale.
- Do NOT use graph paper.
- You must use a non-programmable calculator, protractor and a compass, where necessary.
- Write neatly and legibly.
QUESTIONS
SECTION A
QUESTION 1
1.1 Various options are given as possible answers to the following questions. Choose the answer and write only the letter (A to D) next to the question number (1.1.1 to 1.1.10) in the ANSWER BOOK, for example 1.1.11 D.
1.1.1 The part of the female reproductive system where fertilisation takes place is called the …
- vagina.
- ovary.
- Fallopian tube.
- cervix.
1.1.2 The vibrations on the tympanic membrane are transferred to the …
- ossicles and then the oval window.
- oval window and then the ossicles.
- ossicles and then the round window.
- cochlea and then the ossicles.
1.1.3 The nerve impulse in the axon of a sensory neuron is transmitted …
- towards the dendrite of the sensory neuron.
- towards the cell body of the sensory neuron.
- away from the effector organ.
- away from the cell body.
1.1.4 Which part of the ear converts pressure waves into nerve impulses?
- Auditory nerve
- Organ of Corti
- Eustachian tube
- Auditory canal
1.1.5 During periods when the temperature is low, …
- the thyroxin levels are expected to be low.
- sweating increases.
- the blood vessels to the skin dilate.
- the ADH levels are expected to be low.
1.1.6 The level of aldosterone will most likely increase after …
- consuming food with a high salt content.
- sweating excessively.
- consuming food with a high glucose content.
- the constriction of blood vessels to the skin.
1.1.7 A person can feel pain in his legs but cannot move his legs. This is a result of damage to the …
- sensory neuron.
- sensory and motor neuron.
- motor neuron.
- sensory and interneuron.
1.1.8 Colour vision is difficult at night, because under dim light conditions ...
- rods are not stimulated.
- the pupil dilates.
- cones are not stimulated.
- the lens cannot change shape.
1.1.9 The table below indicates the effect of drinking different amounts of alcohol on the reaction times of a group of people.
The reaction time was determined by using the catch distance on a ruler that was dropped from a certain height.
The longer the catch distance on the ruler, the longer the reaction time.
Units of alcohol (5% per volume) | 0 | 1 | 2 | 3 | 4 | 5 | 6 |
Catch distance on the ruler (cm) | 14 | 12 | 10 | 18 | 22 | 25 | 29 |
The conclusion that can be drawn from the investigation is that drinking alcohol …
- increases the reaction time.
- initially increases the reaction time, after which further intake of alcohol decreases the reaction time.
- does not have any effect on the reaction time.
- initially decreases the reaction time, after which further intake of alcohol increases the reaction time.
1.1.10 The table below shows the speed at which impulses are transmitted through different types of nerve fibres, A, B, C and D.
NERVE FIBRE | DIAMETER (μm) | AVERAGE SPEED OF TRANSMISSION (m/s) |
A | 15 | 100 |
B | 7 | 19 |
C | 3 | 13 |
D | 1 | 1 |
Which ONE of the following is the best interpretation of the information in the table above?
- Nerve fibre A is found in patients suffering from multiple sclerosis.
- The speed of transmission of impulses is not important for the survival of an individual.
- The greater the diameter of the nerve fibre, the greater the speed of transmission.
- Nerve fibre D is found in patients suffering from Alzheimer's disease. (10 x 2) (20)
1.2 Give the correct biological term for each of the following descriptions. Write only the term next to the question number (1.2.1 to 1.2.8) in the ANSWER BOOK.
1.2.1 Growing the same species of crop on a farm year after year
1.2.2 The killing of pests by using their natural predators or parasites
1.2.3 A hollow ball of cells formed from the zygote
1.2.4 The hormone responsible for osmoregulation
1.2.5 The illegal killing or removal of organisms from their environments
1.2.6 The vesicle which contains enzymes found in the head of a sperm cell
1.2.7 The hormone that stimulates milk production for breastfeeding in humans
1.2.8 The part of the nervous system made up of cranial and spinal nerves (8 x 1) (8)
1.3 Indicate whether each of the descriptions in COLUMN I applies to A ONLY, B ONLY, BOTH A AND B or NONE of the items in COLUMN II. Write A only, B only, both A and B or none next to the question number (1.3.1 to 1.3.3) in the ANSWER BOOK. (3 x 2) (6)
COLUMN I | COLUMN II |
1.3.1 Reduces biodiversity | A: Alien plant invasion |
1.3.2 Sustainable use of medicinal plants | A: Banning all sales of medicinal plants |
1.3.3 Result of non-disjunction of chromosome pair 21 in humans | A: Gamete with 22 chromosomes |
1.4 The diagram below represents a human brain. 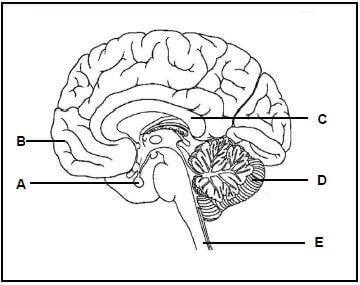
Give the LETTER and NAME of the part of the brain responsible for: 1.4.1 Memorising a cellular phone number (2) 1.4.2 Coordinating all voluntary movements (2) 1.4.3 Secreting hormones (2) 1.4.4 Connecting the two hemispheres of part B (2)
1.4.5 The reflex action that occurs when stepping barefooted on a sharp object (2) (10)
1.5 The diagrams below represent organisms with different reproductive strategies. 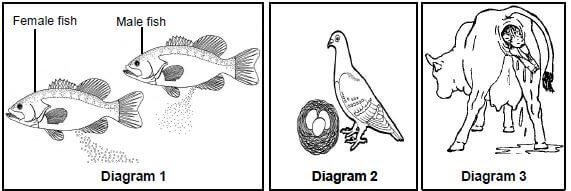
1.5.1 Which diagram(s) (1, 2 or 3) represent(s) organism(s):
- Where external fertilisation takes place (1)
- Where extra-embryonic membranes develop to assist with the protection and nutrition of the embryo (2)
- Which is/are oviparous (2)
1.5.2 Name the type of egg produced by the organism represented in Diagram 2. (1) (6)
TOTAL SECTION A: 50
SECTION B
QUESTION 2
2.1 The diagram below represents the sequence of events that takes place during the ovarian cycle of a female. 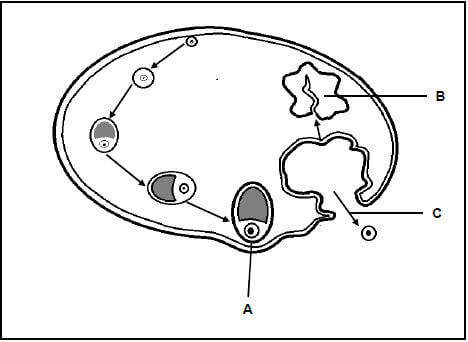
2.1.1 Give the name of the:
- Hormone that controls the development of structure A (1)
- Process taking place at C (1)
2.1.2 Describe the change that takes place in the uterus as the result of the hormone secreted by structure A. (2)
2.1.3 Structure B degenerates if fertilisation does not take place. Explain the implications of this for the:
- Ovarian cycle (3)
- Uterine cycle (3) (10)
2.2 Diagrams I and II below represent gametogenesis in human males and females (not in any particular sequence).
The diagrams are NOT drawn to scale. 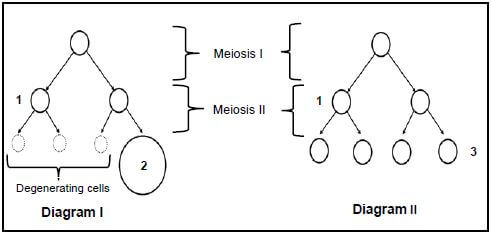
2.2.1 Identify the specific type of gametogenesis in Diagram I. (1)
2.2.2 Explain your answer to QUESTION 2.2.1 by referring to a visible difference between Diagram I and Diagram II. (2)
2.2.3 Where in the human body does the type of gametogenesis shown in Diagram II take place? (1)
2.2.4 Give the chromosome number of:
- The cells at 1 (1)
- Cell 2 (1)
2.2.5 Name TWO processes that take place during Meiosis I that lead to genetic variation in the four cells shown at 3 in Diagram II. (2)
2.2.6 Explain the implication for the human population size if the three cells referred to in Diagram I did not degenerate, but remained as gametes (2) (10)
2.3 The diagram below represents the structure of the human eye. 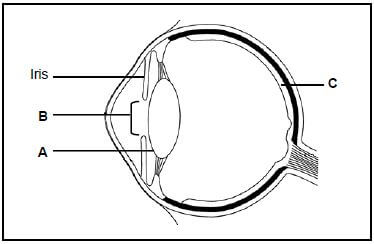
2.3.1 State ONE function of part:
- A (1)
- C (1)
2.3.2 Nocturnal animals sleep during the day and are active at night. Explain how part:
- B of nocturnal animals will differ from that found in animals that are active during the day (2)
- C of nocturnal animals will differ from that found in animals that are active during the day (2)
2.3.3 Describe how the iris controls the amount of light entering the eye when a person is exposed to bright light. (4) (10)
2.4 Describe how balance and equilibrium is maintained by the ear when a person changes his/her speed and direction. (5)
2.5 As the human population in South Africa increases, there is a proportional increase in the amount of solid waste that needs to be disposed of.
2.5.1 State TWO ways (apart from recycling) in which landfill sites can be managed to prevent further pollution. (2)
2.5.2 Explain how the recycling of paper can reduce global warming indirectly. (3) (5) [40]
QUESTION 3
3.1 Study the extract and the table below.
EMISSIONS FROM ELECTRICITY PRODUCTION Most of the electricity in South Africa is produced by burning coal. Coal burning is a very 'dirty' or inefficient way of producing energy because for every unit of electricity produced, more CO2 is released than with other fuels or methods. [Source: Climate change, Ethekweni Municipality Environmental Management Department, 2007, http://www.durban.gov.za/durban/municipality/environment] |
The table below shows the amount of CO2 emitted when producing energy from different sources.
ENERGY SOURCE | CO2 EMISSION (kg CO2/kW) |
Coal | 0,30 |
Petrol | 0,24 |
Diesel | 0,25 |
Paraffin | 0,20 |
Solar, wind, hydro power | 0,0 |
3.1.1 State why coal, petrol, diesel and paraffin are not renewable energy sources. (1)
3.1.2 State why the burning of coal to produce electricity is considered to be 'dirty' compared to using renewable sources or nuclear power. (1)
3.1.3 Name ONE greenhouse gas, other than CO2. (1)
3.1.4 Explain how increasing CO2 emissions could decrease food security. (4)
3.1.5 Draw a bar graph to represent the information in the table above. (6) (13)
3.2 A group of Grade 12 learners investigated the influence of different concentrations of auxins on plumule growth. A plumule is a young stem that grows from a seed.
The procedure was as follows:
- 35 bean seeds were germinated.
- The seedlings were then divided into five groups of seven seedlings each.
- In each group the seven seedlings were attached with Prestik to filter paper on which a 10 mm x 10 mm grid was drawn.
- The filter paper with seedlings was then glued to the inside of a petri dish.
- Each of these five petri dishes was placed in a beaker containing a different concentration of auxins.
The diagram below shows the set-up of a single beaker. 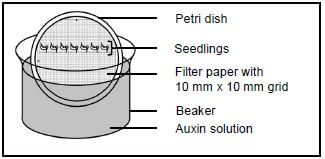
- All five beakers were placed inside a dark cupboard for three days.
- After three days the increase in the length of each plumule was measured.
- The average increase in length of the plumule in each beaker was calculated and recorded in the table below.
The table below shows the results of the investigation after three days.
BEAKER NUMBER | AUXIN CONCENTRATION IN PARTS PER MILLION (ppm) | AVERAGE INCREASE IN PLUMULE LENGTH (mm) |
1 | 0,1 | 1,5 |
2 | 1 | 3,2 |
3 | 10 | 4,8 |
4 | 50 | 2,3 |
5 | 100 | 0 |
3.2.1 For this investigation identify the:
- Independent variable (1)
- Dependent variable (1)
3.2.2 State the purpose of the grid that was placed inside each petri dish. (1)
3.2.3 Explain why the beakers were placed in a dark cupboard. (2)
3.2.4 State ONE way in which the learners ensured the reliability of this investigation. (1)
3.2.5 State THREE factors, not indicated in the procedure, that should be kept constant during this investigation. (3)
3.2.6 State the conclusion that can be made from the results in the table. (2) (11)
3.3 The diagram below represents one of the two cells that formed during Telophase I of meiosis in an organism. 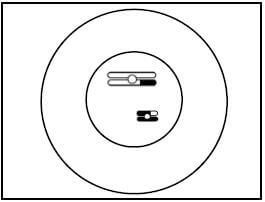
Draw a labelled diagram to show the cell during Anaphase II of meiosis. (5)
3.4 The diagram below represents the relationship between the blood system of the foetus and that of the mother. The arrows indicate the direction of blood flow in the blood vessels. 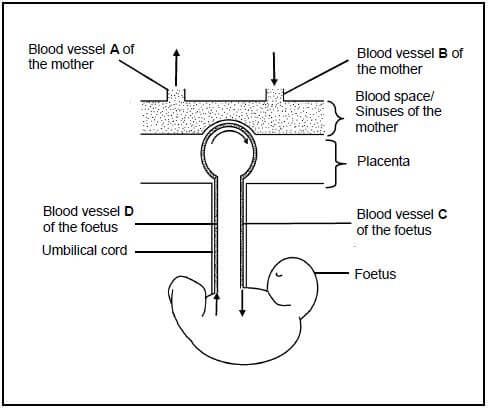
3.4.1 Apart from playing a role in the diffusion of substances from the mother's blood to the foetus' blood, and vice versa, state TWO other functions of the placenta. (2)
3.4.2 Blood vessel D is an artery. Tabulate TWO differences between the composition of blood found in blood vessel C and blood found in blood vessel D. (5)
3.4.3 Explain ONE consequence for the foetus if blood vessel D becomes blocked preventing blood flow. (2)
3.4.4 If the blood of the mother and the blood of the foetus come into contact with each another, it could lead to the death of the foetus. Describe why this would occur. (2) (11) [40]
TOTAL SECTION B: 80
SECTION C
QUESTION 4
An increase in the metabolic rate during strenuous exercise causes a decrease in the glucose level and an increase in the CO2 level in the blood.
Describe the mechanism that leads to an increase in the metabolic rate and the mechanisms involved in increasing the glucose level and decreasing the CO2 level back to normal.
Content: (17)
Synthesis: (3) (20)
NOTE: NO marks will be awarded for answers in the form of tables, flow charts or diagrams.
TOTAL SECTION C: 20
GRAND TOTAL: 150