GEOGRAPHY PAPER 1 GRADE 12 ANNEXURE - NSC PAST PAPERS AND MEMOS FEBRUARY/MARCH 2018
Share via Whatsapp Join our WhatsApp Group Join our Telegram GroupGEOGRAPHY
PAPER 1
GRADE 12
NSC PAST PAPERS AND MEMOS
FEBRUARY/MARCH 2018
ANNEXURE
FIGURE 1.1: A SYNOPTIC WEATHER MAP OF SOUTH AFRICA 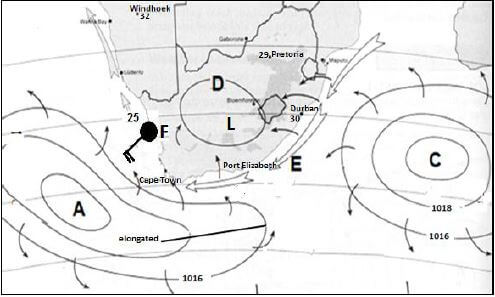
[Source: South African Weather Service]
FIGURE 1.2: A DRAINAGE BASIN 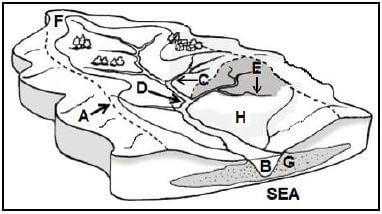
[Adapted from http://www.waterwise.co.za/export/sites/water-wise/images/water/catchment.jpg]
FIGURE 1.3: PATH OF A TROPICAL CYCLONE 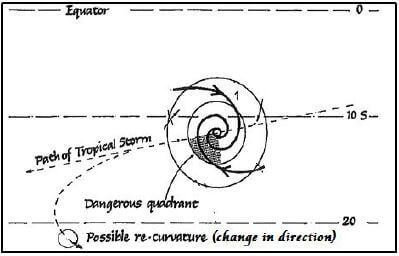
[Source: http://about.metservice.com/assets/Learning-Centre/Mariners-Met-Pack-South West-Pacific-ch5-Tropical-Cyclones.pdf]
FIGURE 1.4: A KATABATIC WIND

[Source: http://fox41blogs.typepad.com/.a/6a0148c78b79ee970c019affe51c3d970c-500wi]
FIGURE 1.5: FLOODPLAIN AFTER REJUVENATION 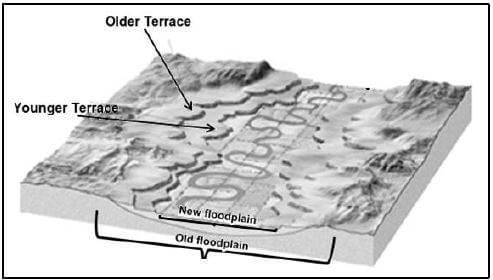
[Adapted from Pearson Education]
FIGURE 1.6: LONGITUDINAL PROFILE OF A GRADED RIVER 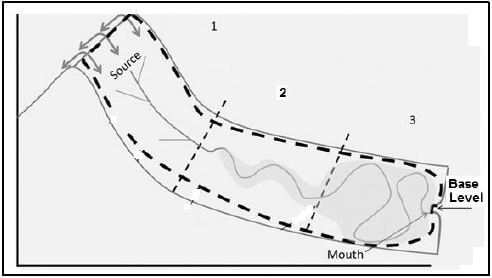
[Adapted from Yorkshiredalesrivertrust.com]
FIGURE 2.1: A COASTAL LOW PRESSURE SYSTEM 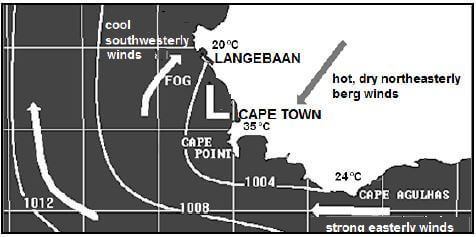
[Source: South African Weather Service]
FIGURE 2.3: A CROSS-SECTION OF A MID-LATITUDE CYCLONE

[Adapted from http://isu.indstate.edu/ebermudez/hlth210/lessoneightc.html]
FIGURE 2.4: INLAND TEMPERATURE INVERSION 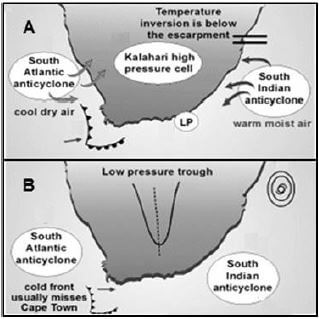
[Source: http://slideplayer.com/slide/10180352/34/images/96/3.+High+Pressure+Systems.jpg]
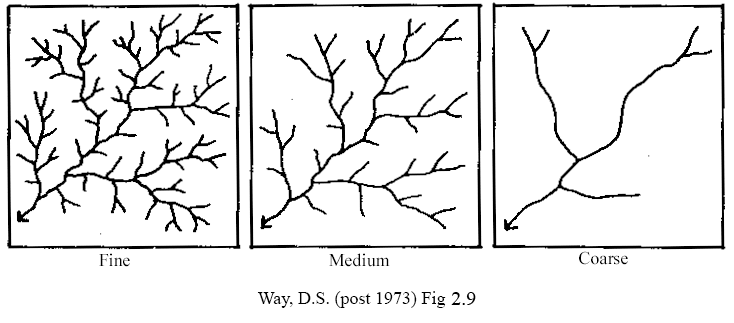
FIGURE 2.5: DRAINAGE DENSITY

[Adapted from http://www.civil.northwestern.edu/people/dowding/airphoto/scan/a2a.gif]
FIGURE 2.6: A RIVER SYSTEM

[Adapted from ecoursesonline.iasri.com]
FIGURE 3.1: URBAN PROFILE 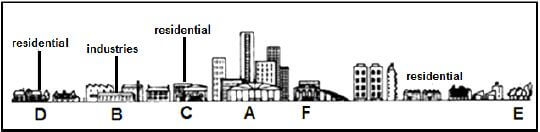
[Adapted from www.learnmindset.co.za]
FIGURE 3.4: RURAL POPULATION (2004–2015) 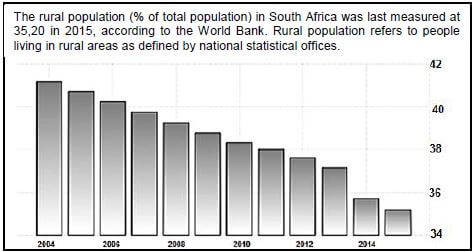
[Source: http://www.tradingeconomics.com/south-africa/rural population-percent-of-total-population-wb-data.html]
FIGURE 3.5: WESTERN CAPE EXPORT PRODUCTS 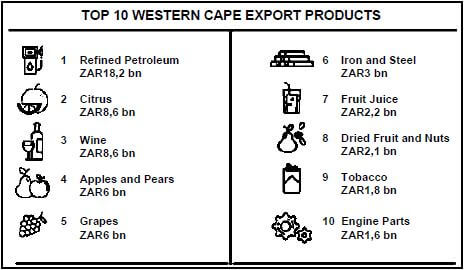
[Source: http://www.wesgro.co.za/pdf_repository/ 0077%20Wesgro_Investment%20Folder_004.1%20SP%20new.pdf]
FIGURE 3.6: SMALL-SCALE FARMING 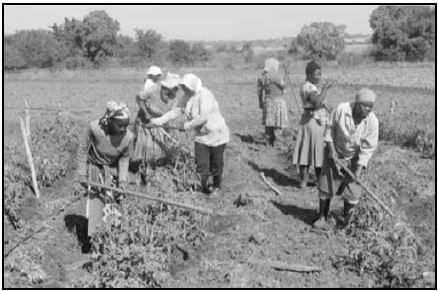
[Source: https://www.google.co.za/search?q=subsistence+farming&source=lnms&]
FIGURE 4.3: LAND REFORM
SOUTH AFRICA'S LAND REFORM EFFORTS LACK A FOCUS ON STRUGGLING FARMERS South Africa's land reform programme has suffered many failures and its beneficiaries have in many cases seen little or no improvements to their livelihoods. Land reform remains an unresolved historical grievance. [Adapted from http://mg.co.za/article/2016-12-06-south-africas-land reform-efforts-lack-a-focus-on-struggling-farmers] |
FIGURE 4.4: INJUSTICES IN URBAN AREAS 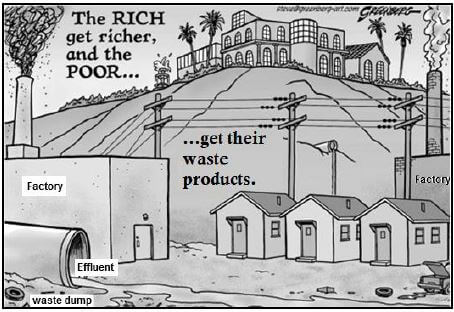
[Source: https://s-media-cache ak0.pinimg.com/originals/ca/ab/c7/caabc75946c2e1260c536d4081908cce.jpg]
FIGURE 4.6: CONTRIBUTION OF SELECTED ECONOMIC ACTIVITIES TO SOUTH AFRICA'S GDP
ECONOMIC ACTIVITY | CONTRIBUTION |
Agriculture, forestry and fishing | 2,2% |
Mining and quarrying | 4,9% |
Manufacturing | 15,2% |
Electricity, gas and water | 1,8% |
Construction | 3% |
Finance, real estate and business services | 21,5% |
General government services | 13,7% |
[Source: https://www.brandsouthafrica.com/investments immigration/economynews/sa-economy-key-sectors]