ECONOMIC GEOGRAPHY OF SOUTH AFRICA GRADE 12 NOTES - GEOGRAPHY STUDY GUIDES
Share via Whatsapp Join our WhatsApp Group Join our Telegram Group- Primary economic activities
- Secondary economic activities
- Tertiary economic activities
- Quaternary economic activities
- Understanding graphs and tables
This chapter covers South Africa’s economic activities,This chapter covers South Africa’s economic activities,as well as food security.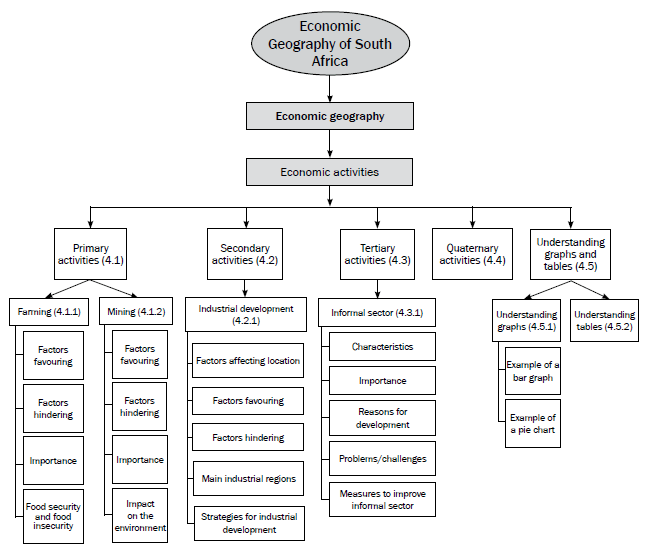 Key concepts
| Concept | Definition |
| Balance of payment | A country’s financial statement showing its transactions with the rest of the world |
| Balance of trade | The value of exports minus the value of imports |
| Bridge industries | Industries that are located between the source of raw materials and the customer, e.g. oil refineries |
| Centralisation | Movement of industries into core areas |
| Decentralisation | Movement of activities away from over-centralised areas |
| Economic activities | Activities that people practise to meet their needs or earn a living |
| Exports | Goods and services that are sold to foreign countries |
| Favourable trade balance | Occurs when the value of exports is greater than the value of imports |
| Food insecurity | When not all the people have enough food to meet their needs for a healthy and productive life |
| Food security | When all the people have enough food to meet their needs for a healthy and productive life |
| Footloose industries | Industries that can be located in any place without being affected by factors such as resources or transport, e.g. diamond processing and computer chip manufacturing |
| Foreign exchange | The money paid to South Africa by other countries, e.g. dollars and pounds, in exchange for goods and services |
| Formal sector | Registered businesses that are licensed to sell goods or provide services |
| Globalisation | The way in which the economic, social, political and cultural activities of countries across the world are interconnected (working together) |
| Gross Domestic Product (GDP) | The total value of goods and services produced within the borders of the country in a year |
| Gross National Product (GNP) | The total value of goods and services produced by the permanent citizens of a country in one year (note that permanent citizens may work out of the country) |
| Hawker | An informal street trader |
| Imports | Goods and services that are bought from foreign countries |
| Industrial Development Zone(IDZ) | Industrial estates or areas aimed at economic growth and new investment; used by developing countries to attract investment, create jobs and boost exports |
| Informal sector | Activities by small, unregistered businesses that sell goods or provide services without being licensed, e.g. petty trade, casual employment, spaza shops and street hawkers or traders |
| Infrastructure | Transport network (roads, railways) and services (electricity, telecommunication, water and sewerage) that are in place |
| Primary activities | Activities that involve taking natural resources from the earth, e.g. farming (livestock, crops), forestry, mining, fishing |
| Quaternary activities | Activities that deal with information and research |
| Secondary activities | Activities that involve the processing of raw materials and manufacturing of goods, e.g. factories and industries |
| Semi-skilled worker | A worker who does routine tasks (simple tasks that are done on a regular basis); someone who is not skilled or trained to do specialised work (difficult tasks that need special training) |
| Skilled worker | A worker who has a specific set of skills or specialised knowledge that has usually been obtained through some kind of formal training |
| Spatial Development Initiatives (SDI) | Programme aimed at improving infrastructure and attracting business investments in rural areas that were neglected and underdeveloped |
| Tertiary activities | Activities that deal with the supply of services, e.g. banking, trade and transport |
| Trade | The flow of goods and services from producers to consumers across the world |
| Trading bloc | A group of countries that have common markets or trade agreements |
| Unskilled worker | A worker who performs simple duties that do not require any specific skills, training or previous experience; usually involves hard physical labour |
If you know and understand all the definitions of economic geography, you will be able to answer most of the questions in the economic geography section of the final exam. Use mobile notes to help you memorise these key concepts. Instructions for making them are on page x in this guide.
In an exam you may be asked to test your understanding of terms by matching the key concept with the definitions provided. An example of this kind of question is provided in activity 4.1 on page 80. Practise this by completing the activity.
Take care not to confuse the terms gross domestic product (GDP) and gross national product (GNP) with one another. GDP refers to the total value of goods and services produced in one year within the borders of South Africa. GNP refers to the total value of goods and services produced in one year by the permanent citizens of a country (even if they live and work in another country). |
Activity 4.1
Choose a term from Column B that matches a statement in Column A. Write only the letter (A to F) next to the question number (1 to 5), for example 6 – G.
| Column A | Column B |
|
|
Answers to activity 4.1
|
In the next section we focus on primary, secondary and tertiary economic activities. These economic activities are important to the economy and the country’s development, and are interdependent. Primary activities stimulate secondary activities which, in turn, stimulate job creation in the tertiary sector.
4.1 Primary economic activities
Primary activities involve extracting (removing) raw materials from the earth, for example farming, fishing, forestry and mining. We focus on farming and mining as they are the two primary activities that contribute the most to South Africa’s economy.
4.1.1 Farming in South Africa
In this section we focus on factors that favour and hinder farming. There are different types of farming: crop farming, stock farming and mixed farming (both crop and stock). The word ‘agriculture’ is used to refer to all types of farming. Firstly, pay attention to Table 4.1, where the differences between a large scale farmer and small scale farmer are explained.
Table 4.1 The differences between a large scale farmer and a small scale farmer
| Small scale farmer | Large scale farmer |
| The modern trend to enlarge farms to reach optimal size as a business enterprise rather than as a unit size suited to single family management. |
Factors favouring (promoting) farming
These factors make farming more productive and profitable:
- There is a high demand (market) for farming products so farmers sell their crops more easily. Farmers’ profits rise when they can sell for a higher price to overseas markets with a demand for their crops or stock.
- The fertile floodplains of rivers allow farmers to produce more crops or grazing land (pastures) in these areas. This supports farming and increases profits.
- The eastern half of the country gets more than 500 mm of rain a year. This makes it possible to produce more crops and ensures greener pastures for stock farming, therefore increasing profits.
- The relatively high summer temperatures help crops to grow and increase crop production. It also ensures greener pastures for stock farming.
- Availability of labour (workers)
Use the following word mnemonic to help you remember the factors that favour farming in South Africa:
F = Fertility → Farmer
D = Demand → Daniel
R = Rain → Reaps
T = Temperatures → Tomatoes
Factors hindering (restrict/limit) farming
These factors make farming difficult and therefore less productive and less profitable:
- Rainfall is low and unreliable on the plateau, which limits crop production and decreases available pastures for stock farming.
- Soil erosion due to incorrect farming methods increases farming costs and decreases profits.
- Natural hazards such as droughts, floods and hail storms damage crops and stock and decrease production and profits.
- HIV and AIDS have a negative impact on the health and productivity of farm workers.
- Price fluctuations (when prices go up and down) make it difficult for farmers to stay in business and make a profit.
- Pests which affect crops and stock are costly to control and cause a decrease in production and profits.
Use the following word mnemonic to help you remember the factors that hinder farming in South Africa:
H = Hazards → Hungry
P = Price → People
S = Soil →Seek
H = Health → Healthy
R = Rainfall v Round
P = Pests v Potatoes
Importance of farming in South Africa (role of farming in SA)
Farming benefits the economy and people in these ways:
Farming provides jobs to people and so decreases unemployment.
- Farming provides food to the country so less food needs to be imported. Food that is supplied locally is less expensive than imported food.
- Farming equipment is expensive because much of it is imported, but South Africa has reduced these costs by manufacturing some equipment locally, for example irrigation systems.
- Farming involves moving crops to the markets, which in turn leads to improving the country’s infrastructure (roads, railways and communication systems).
- South African farming products are exported to other countries earning us foreign exchange. This improves the country’s economy.
In an exam you may be asked to state the factors that favour or hinder farming. You may also be asked to explain the importance of farming to South Africa.
Food security and insecurity
Food security is when all the people have enough food to meet their needs for a healthy and productive life. Some of the factors (reasons) why people have enough food (food security) are:
- Commercial farms are able to produce enough food due to favourable climatic factors.
- People can afford to buy the food. In other words, farmers have a market.
- The need to import food from other countries at high costs is reduced because food is grown locally.
- Genetically modified crops are more resistant to diseases, pests and viruses so more crops can be produced.
Food insecurity is when not all the people have enough food to meet their needs for a healthy and productive life. Food insecurity affects poor people, many of whom live in rural areas. These people try to survive by growing their own food. This is called subsistence farming. This type of farming provides only enough food for the farmer’s own family.
Some of the factors (reasons) why people do not have enough food (food insecurity) are:
- There is a lack of fertile (arable) land on which to grow food.
- Climate change increases natural disasters (droughts and floods) that damage crops.
- When you are poor it is more difficult to buy the things you need to farm, such as enough land, equipment, seeds and irrigation systems.
- Subsistence farmers are often uneducated about ways to improve crop production so land is often overused for crops or overgrazed by cattle.
Some of the measures (ways) to prevent food insecurity are:
- Prevent soil erosion by practising better farming methods, for example crop rotation or rotational grazing (putting cattle in different fields or camps).
- Use efficient ways of storing food, especially when more crops are produced in high-rainfall seasons.
- Improve ways of storing and using water supplies to reduce water wastage.
In an exam you may be asked to define the terms food security and food insecurity and state the factors that lead to food security and food insecurity. Learn this information to answer this question.
Apply what you have learnt about food security by completing activity 4.2 on page 83.
Activity 4.2
The cartoon in Figure 4.1.1 below shows how environmental problems can affect food security.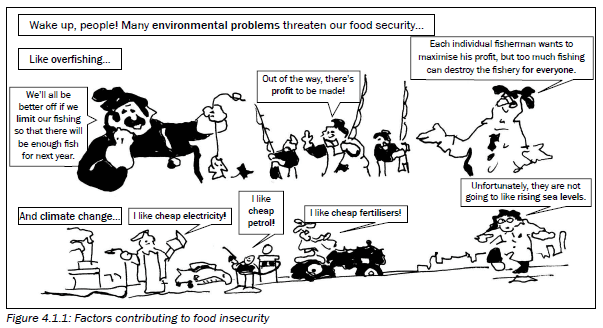
- How has the use of fossil fuels and fertilisers caused climate change? (3 × 2 = 6)
- How does climate change link to rising sea levels? (2 × 2 = 4)
- How would rising sea levels affect food security? (1 × 2 = 2)
- Explain your answer in question 3. (1 × 2 = 2)
- Name another factor in the cartoon that would affect food security. (1 × 2 = 2)
[16]
Answers to activity 4.2
|
4.1.2 Mining in South Africa
In this section we focus on factors favouring and hindering mining. There are different types of mining: open cast and shaft mining.
Factors favouring (promoting) mining
These factors make mining more productive and profitable:
- South Africa has many different minerals which can be mined and used in factories or exported so the country earns foreign exchange.
- South African mines benefit from having lots of local unskilled labour. This results in lower labour costs and therefore higher profits.
- Foreign skilled miners come to work in South African mines and the mines benefit from their knowledge and skills.
- Many countries invested money in our mines, which assisted with further development of the mines and a lowering of costs.
- A well-developed infrastructure (roads and railway lines, water and electricity) assists mines to do business.
Use the following word mnemonic to help you remember the factors that favour mining in South Africa:
M = Minerals →Miners
L = Labour → Love
F = Foreign → Finding
I = Investment → Important
I = Infrastructure → Irons
Factors hindering (restrict/limit) mining
These factors make mining less productive and less profitable:
- The high temperatures in some underground mines create difficult working conditions and this decreases productivity.
- Large distances between the mines and the harbours or towns increase the cost of transporting the minerals to the markets.
- There are high costs involved in training and housing mine workers.
- Mine worker strikes decrease productivity and profits.
- Water shortages and underground flooding of mines are a serious problem. It is expensive to fix the problem and this decreases profits.
- Ensuring safety on the mines is costly, especially when tunnel roofs collapse.
Use the following word mnemonic to help you remember the factors that hinder mining in South Africa:
S = Safety → Sometimes
W = Water → Workers
C = Costs → Can
D = Distances → Dig
T = Temperatures → Too
S = Strikes → Slowly
The importance of mining to the South African economy (role of mining in SA)
Mining benefits the economy and people in these ways:
- The mining sector provides many jobs, which decreases unemployment.
- Mines supply raw materials to secondary activities such as factories and industries. This in turn stimulates industrial development.
- When mines start up, new towns and transport networks develop around the mines.
- Mining stimulates other sectors of the economy, such as farming, building and trade, to meet the needs of the growing number of people who live and work in mining towns.
- Harbours, like those at Saldanha Bay (Western Cape) and Richards Bay (KwaZulu-Natal), expand (grow bigger) to cope with increased mineral exports to other countries. This creates more jobs and also helps other sectors of the economy to grow.
- The export of mining products increases the profits of the mines because they earn foreign exchange.
Impact of mining on the environment
The processes involved in removing minerals from the earth create waste products and have a negative effect on the environment. Some of the negative effects of mining are:
- The natural vegetation is removed to clear the ground for mining activities. This leads to an increase in soil erosion in these areas.
- When vegetation is removed it destroys natural habitats and damages ecosystems, which can lead to the extinction of plants and animals in the area.
- The land is destroyed when mine dumps and slimes dams are built to store waste.
- Chemicals that leach (wash off) from the mine dumps when it rains cause water and land pollution.
- Sinkholes are a danger in areas where mining takes place.
- Coal is a major mining product in South Africa. Power stations burn coal to make electricity. The carbon dioxide that is released during this process contributes to global warming and climate change.
In an exam you may be asked to state the factors that favour or hinder mining. You may also be asked to explain the importance of mining to South Africa and the impact of mining on the environment.
4.2 Secondary economic activities
Secondary activities involve the processing of raw materials and manufacturing of goods. We use the word ‘industries’ for secondary activities. For example, sugar cane is turned into sugar at an industry called a sugar refinery; trees are turned into wood shavings and then paper at an industry called a sawmill; cowhides are turned into leather to make handbags and shoes at an industry called a tannery.
Secondary activities can be divided into heavy and light industries. Learn the information in Table 4.2 below to understand the differences between these two types of industries.
In an exam you may be asked to identify a heavy or light industry from a picture or on a topographic map. You may also be asked to state the characteristics of heavy or light industries. Learn the information in Table 4.2 to help you answer these questions.
| Light industry | Heavy industry | |
| Example | Jewellery making, clothes factory, computer manufacturer, food and beverages | Power stations, iron and steel factory, motor vehicle factory, paper mill |
| Location | In a city in the CBD; in the zone of decay; in an industrial estate | On the outskirts of a city; in rural areas near the raw material source |
| Raw material | Small, may be partially processed | Large, bulk, not processed |
| Land requirements | No specific needs, may be in a multistorey building | Needs a large area of flat land, singlestorey buildings |
| Infrastructure | Uses existing road network and local power supply | Needs access to major roads or railways, water supply and power supply |
| Environmental impact | Has little to no impact on the surrounding area | Utilises a large amount of water and causes air and noise pollution |
Table 4.2: The differences between heavy and light industries
In the next sections we focus on factors that affect the location of industries and the factors that favour or hinder the development of secondary economic activity. We look at the development of the four main industrial regions in South Africa:
- Pretoria–Witwatersrand–Vereeniging complex (PWV) (Gauteng)
- Durban–Pinetown (Ethekwini)
- Port Elizabeth–Uitenhage (Nelson Mandela Bay)
- Southwestern Cape
4.2.1 Industrial development in South Africa
The availability of raw materials in South Africa has led to the development of large industries (factories) that process the raw materials or use semifinished products to manufacture final products.
Factors affecting the location of an industry
When deciding where to site an industry, the following two factors are the most important:
- Raw materials: How close are the natural resources or raw materials the industry needs to make its product?
- Markets: How close is the industry to the market where it sells its product? In other words, how close are the consumers (the people that buy the product)?
An industry will locate itself close to either the raw materials or the market. If the raw material is large and difficult to transport, the industry will locate close to the raw material. This industry would be called raw-material orientated.
If the raw material is smaller and easier to transport, the industry will locate close to the market. The industry would be called market orientated.
The following factors can also affect the location of an industry:
- Transport: Access to major transport routes between the industry, the raw material source and the market.
- Energy: A reliable supply of electricity is needed to be able to process raw materials or manufacture goods.
- Labour: A skilled and unskilled work force must live in the area where the industry is located.
- Link industries: These are industries that you sell your product to. How close the industry is to its link industries will affect its transport costs.
- Government policies: Government may offer subsidies or tax incentives to industries that locate in certain areas, which may help to decrease costs.
Factors favouring (promoting) industrial development in South Africa
These factors make industries more productive and more profitable:
- South Africa has a wide range of industries because there is a wide range of raw materials to support production.
- A well-developed infrastructure (roads and railway lines, water and electricity) assists industries to do business.
- The availability of cheap, level (flat) land makes it cheaper to develop industries in South Africa.
- The availability of a large skilled and unskilled labour force in the areas where industries are located decreases the costs of training and worker accommodation and transport.
Factors hindering (restricting/limiting) industrial development in South Africa
These factors make industries less productive and less profitable:
Related Items
- The large distances between South Africa and its foreign markets increase transport costs and make it more difficult to compete with industries in those countries.
- There is a shortage of skilled labour in South Africa. This increases labour costs because industries have to attract foreign skilled labour and pay high salaries to retain skilled workers.
- Labour strikes decrease the productivity of industries in South Africa and this increases costs and limits further industrial development.
- Water and electricity shortages and price increases limit further industrial development.
Importance of industrial development in South Africa
- When we export processed goods we earn more foreign exchange than if we exported the raw material.
- Industries provide more and higher paid employment to the population, this in turn leads to an increase in the standard of living of the population. This increases their buying power which further stimulates industrial development. It also increases the money made from rates and taxes, so the government has more money to spend on improving infrastructure and other facilities.
- The employment of people in industries leads to the development of more skills and experience; this in turn leads to the development of new technology.
- Industrial growth stimulates the development of all other services and facilities.
Main industrial regions in South Africa
Figure 4.2.1A on page 88 shows the four main industrial regions in SouthFigure 4.2.1A on page 88 shows the four main industrial regions in SouthAfrica.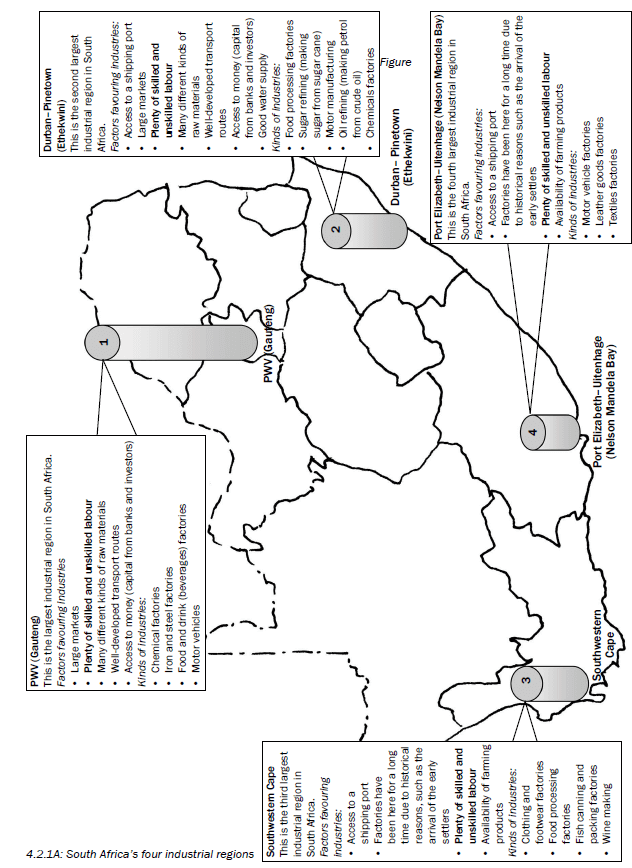 Activity 4.3
Choose a term from the box that matches the descriptions that follow. heavy industries; footloose industries; market-orientated industries; centralisation; decentralisation; Durban–Pinetown; Gauteng/Pretoria–Witwatersrand–Vereeniging
- Over-concentration of industries in a few core areas
- The largest industrial core area in South Africa
- Industries that can locate anywhere due to improved technology
- Industries that must be close to the consumers
- These industries are associated with high noise and air pollution
(5 × 2 = 10)
Answers to activity 4.3
|
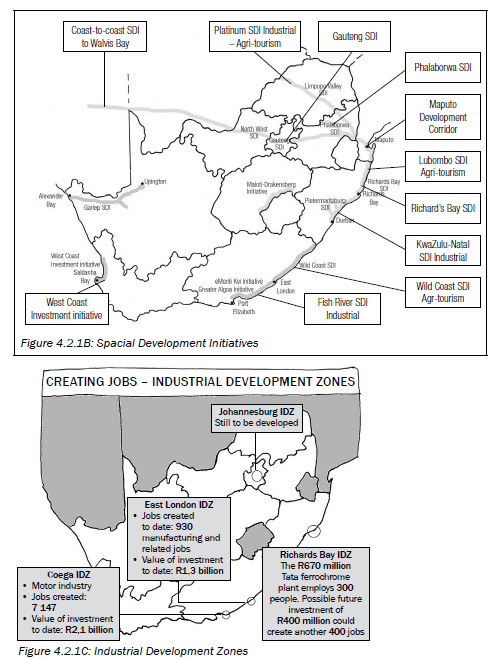
Strategies for industrial development
As part of the development plan for underdeveloped regions, the South African Government (Department of Trade and industry in partnership with the Department of Transport) introduced TWO development plans:
- Spatial Development Initiative (SDI)
- Industrial Development Zones (IDZ)
| Spatial Development Initiative | Industrial Development Zones |
|
|
4.3 Tertiary economic activities
Tertiary economic activities involve the selling of goods and provision of services. For example, the selling of goods would include any supermarket, car dealer or clothes shop. Examples of services are hairdressers, doctors, internet cafes, and repair and maintenance companies.
Tertiary economic activities are divided into the formal sector and informal sector. In this section we will focus on the informal sector in South Africa, its characteristics and the reasons for its development. We will also look at the challenges facing this sector and how the informal sector can be improved.
4.3.1 The informal sector in South Africa
Examples of people who work in the informal sector are hawkers, parking guards and casual labourers (painters, tilers, gardeners, cleaning staff).
- If not registered, then they don’t pay income tax.
Characteristics are the things that members of a group have in common.
Characteristics of the informal sector
The informal sector has the following characteristics:
- Workers are self-employed.
- Women and children are mainly involved in this sector.
- It is associated with casual labour.
- It employs unskilled or semi-skilled workers.
Importance of the informal sector
The informal sector benefits the economy and people in the following ways:
- It provides an income to many people and decreases unemployment.
- Informal traders are more accessible to working class consumers.
- Consumers can buy goods in smaller quantities and at a lower price.
- It provides opportunities for people to grow and apply their entrepreneurial skills.
Reasons for the development of the informal sector
- Large scale job losses in the formal sector increase the number of people who make work for themselves in the informal sector.
- Greater mechanisation (use of machinery) on farms and in industry results in more workers being unemployed and needing to make work for themselves in the informal sector.
- People who lack formal qualifications are less likely to be employed in the formal sector, causing them to make work for themselves in the informal sector.
- Immigrants who are not able to find legal employment in the formal sector turn to the informal sector to make an income.
Do not confuse the terms informal sector and informal settlement with one another:
- Informal sector is the economic term for people not employed in the formal sector.
- Informal settlement refers to ‘squatter’ areas, where people live.
Problems or challenges facing the informal sector
These factors make informal trading less productive and less profitable:
- Traders are frequently harassed by local authorities.
- Traders do not have access to proper trading facilities.
- Traders and their goods are exposed to the weather.
- Banks do not like to give loans to informal traders.
- The sector is unpredictable and the income unreliable.
Measures to improve the informal sector
These are some of the things that can be done to help informal traders:
- Local authorities can provide specific areas for informal trading.
- Local authorities can provide infrastructure, such as hawker stalls.
- Banks can make access to bank loans easier.
- Local authorities can provide training to teach people the necessary skills to develop their businesses.
4.4 Quaternary economic activities
Quaternary economic activities deal with communication, technology and research. Examples of quaternary activities are new product development, medical research, customer surveys and market research, call centres, facebook, Google and other information age businesses.
Activity 4.4
Choose a description from Column B that matches a term in Column A.
Write only the letter (A-L) next to the question number (1-10), e.g. 11.L
| Column A | Column B |
|
|
Answers to activity 4.4
|
The economic geography section will appear in Section B of the theory paper in Questions 3 and 4. Note that you will be asked to answer questions based on information contained in texts, graphs and tables. The answers can be found in the information given, so read the information carefully to find the answer.
The next section will help you to understand graphs and tables in economic geography. Learn this information to prepare for this section of the exam.
4.5 Understanding graphs and tables
In the exam, economic concepts are often tested using tables or graphs. It is important that you understand how to get information from a graph or table to answer such questions.
When a question in the exam refers to a table or graph, it is important that you study the table or graph before you read the questions. This is similar to reading a comprehension text before answering the questions. You will need to UNDERSTAND the table or graph in order to answer the questions.
4.5.1 Understanding graphs
In this section we look at two types of graphs: bar graphs and pie charts.
Follow these steps when you read a graph:
Steps to reading a bar graph Step 1: The heading of a graph will tell you what the graph shows and what is being compared. It will tell you how the two or more factors shown on the graph are connected. In other words, it will tell you what the relationship is between the factors shown. |
Let us apply these steps by looking at specific examples in Figure 4.5.1A (right) and 4.5.1.B on page 95.
Here are some helpful guidelines that show you to how to read and understand graphs.
Example of a bar graph
Carefully study the bar graph in Figure 4.5.1A below which shows the contribution of different economic sectors to South Africa’s GDP (Gross Domestic Product).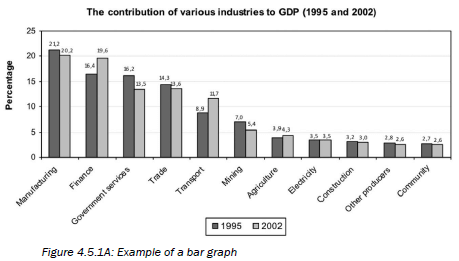
Follow these steps to read the graph
|
Activity 4.5
The following questions refer to the graph in Figure 4.5.1A on page 94.
- What do the letters GDP stand for? (1 × 2 = 2)
- Which industry contributes the most to the GDP? (1 × 2 = 2)
- To what economic activity does mining and agriculture belong to? (1 × 2 = 2)
- Mining and agriculture contribute less to the GDP than manufacturing, which is a secondary activity. Explain the reason for this observation. (2 × 2 = 4)
- The contribution of transport to the GDP increased from 1995 to 2002. Give a possible reason for this. (1 × 2 = 2)
[12]
Answers to activity 4.5
|
Example of a pie chart
Carefully study the pie chart or pie graph below (Figure 4.5.1B) illustratingCarefully study the pie chart or pie graph below (Figure 4.5.1B) illustratingthe contribution of different provinces to the national GDP.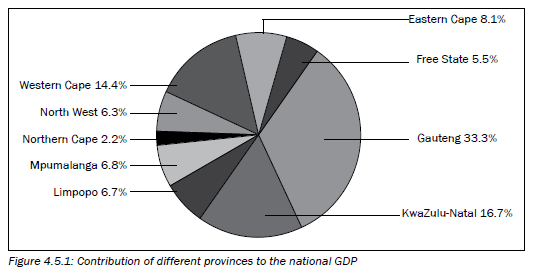
Follow the steps to read the graph
|
Activity 4.6
The following questions refer to Figure 4.5.1B on page 95.
- Rank the top three provinces in terms of their contribution to the GDP from largest to smallest contribution. (1 × 2 = 2)
- Give two reasons why the province ranked first in your answer in question 1 holds that position. (2 × 2 = 4)
- The following questions refer to the province which contributes the least to the national GDP.
- Name the province which contributes the least to the national GDP. (1 × 2 = 2)
- Name the ocean current that flows alongside this province. (1 × 2 = 2)
- What impact does this ocean current have on the rainfall in this province? (1 × 2 = 2)
- Explain how your answer in question c) affects the province’s contribution to the GDP. (2 × 2 = 4)
[16]
Answers to activity 4.6
|
4.5.2 Understanding tables
In this section we look at how to read and understand the information in a table. Follow these steps when you read a table:
| Steps to read a table Step 1: Look at the heading for the table to see what is shown Step 2: Look at the labels in the different columns Step 3: Look at the relationship between what is compared Step 4: Now read the questions |
Carefully study Table 4.4 below and then follow the steps to read the table.
| South Africa's mineral production and relative ranking in the world | ||
| Mineral | SA’s percentage of world production | World position |
| Asbestos | 6 | 4 |
| Chromium | 76 | 1 |
| Coal | 11 | 4 |
| Diamonds | 24 | 2 |
| Iron | 7 | 5 |
| Manganese | 78 | 1 |
| Platinum group | 79 | 1 |
Table 4.4
Steps
|
Activity 4.7
|
Answers to activity 4.7
|