GEOMORPHOLOGY GRADE 12 NOTES - GEOGRAPHY STUDY GUIDES
Share via Whatsapp Join our WhatsApp Group Join our Telegram GroupGeomorphology is the study of the landforms found on the Earth’s surface and the processes that create them. In this chapter, fluvial geomorphology is covered.
The following table of key concepts covers fluvial geomorphology.
If you know and understand these definitions of fluvial geomorphology, then you will be able to answer most of the questions in the Geomorphology section of the final exam.
Use mobile notes to learn these key concepts. They are easy marks!
Key concepts
| Concept | Definition |
| Base flow | The flow of groundwater in the same direction as the river. |
| Base level | The lowest level to which a river can erode. |
| Condensation | When water vapour reaches dew point temperature and changes into water droplets. |
| Deposition | When a river deposits (lays down) the sediment it is carrying on the river bed. |
| Drainage basin | An area drained by a river system. |
| Erosion | The removal of soil and wearing away of rocks by wind, water or ice. |
| Evaporation | When water in the liquid form is converted (changed) into water vapour (gas). |
| Fluvial hydrographs | Show runoff of a river at particular time at a point on a river. |
| Groundwater | Water stored below the ground in soil and rock. |
| Headward erosion | When a river cuts back towards its source. |
| Infiltration/percolation | A process whereby water seeps into the soil or rock. |
| Interception | he process by which raindrops are prevented from falling to the ground by plant leaves, stems and branches. |
| Perennial river/permanent river | River that flows throughout the year. |
| Precipitation | Any form of water falling from the sky (e.g. rain, hail, snow). |
| Rejuvenation | The renewal of erosion activity in a river. |
| River/channel flow | Water that flows within a river channel. |
| River discharge | The volume of water that flows past a point in a river in a given time. |
| River meander | A series of bends in a river as it moves along the floodplain. |
| River source | This is where a river starts; normally high up in mountainous areas. |
| River mouth | This is where a river ends; normally when it reaches the sea or ocean. |
| Runoff/overland flow | Rainwater which runs overland towards a river, lake or the sea. |
| Seasonal/periodic/non-perennial river | River that only flows during the rainfall season. |
| Stream capture/piracy | When one river ‘robs’ another of its water. |
| Stream channel | Where the water flows in a river (river bed). |
| Throughflow | The movement of groundwater through the soil due to gravity. |
| Transpiration | Water vapour is released from leaves in trees and plants. |
| Tributary | A smaller river which flows into (joins) a larger river. |
| Watershed/Drainage divide | High-lying land separating drainage basins. |
| Water table | The level below which the ground is saturated (it can hold no more water). |
If you know and understand these definitions of fluvial geomorphology, then you will be able to answer most of the questions in the Geomorphology section of the final exam. Use mobile notes to learn these key concepts. They are easy marks!
Fluvial geomorphology
This chapter deals with the action of water on the Earth’s surface. TheThis chapter deals with the action of water on the Earth’s surface. Theword fluvial refers to the action of running water.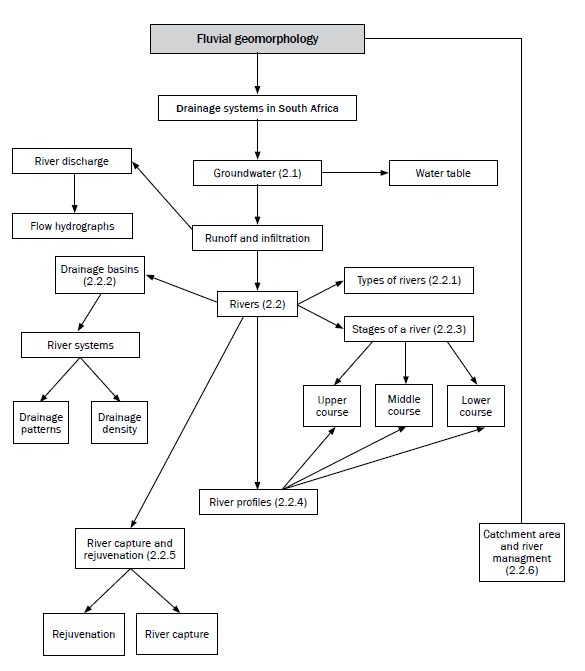
2.1 Groundwater
Groundwater is water stored beneath the Earth’s surface. When precipitation (rain) falls to the surface of the Earth, it either flows over the surface (runoff) or it is absorbed (infiltrates) into the groundwater supply. This section studies how the infiltration, runoff and groundwater systems work and lead to the formation of rivers. Refer to Figure 2.1A below of the water cycle (this was studied in Grade 10).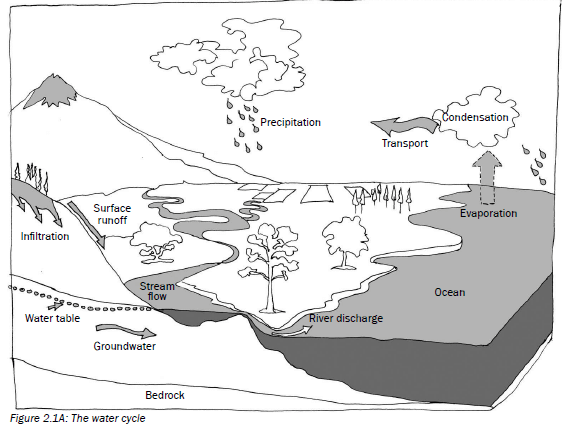 Groundwater supplies are replenished (filled up) when water infiltrates into the ground. For water to infiltrate into the soil, three important aspects should be present:
- Enough porous soil or rock to allow the water to infiltrate through it.
- Time for the surface water to be absorbed into the ground. This is affected by the steepness of the slope and the nature of the rain.
- Vegetation (plants) to slow down the speed of runoff, making it easier for infiltration to happen.
To see how these three aspects affect runoff and infiltration study Table 2.1 below.
| Factor | Impact on groundwater |
| Porous rock | More infiltration, less runoff and more groundwater |
| Rock is not porous | Less infiltration, more runoff and less groundwater |
| More time (gentle slope) | More infiltration, less runoff and more groundwater |
| Less time (steep slope) | Less infiltration, more runoff and less groundwater |
| More vegetation | More infiltration, less runoff and more groundwater |
| Less vegetation | Less infiltration, more runoff and less groundwater |
Run-off and infiltration factors are the same as drainage density factors.
Table 2.1: Factors affecting runoff and infiltration
Figure 2.1B below shows the impact of rock type, time and vegetation on groundwater. From the diagram we can see how the amount of groundwater affects the height of the water table. This is the level below which the ground is saturated (when it can hold no more water).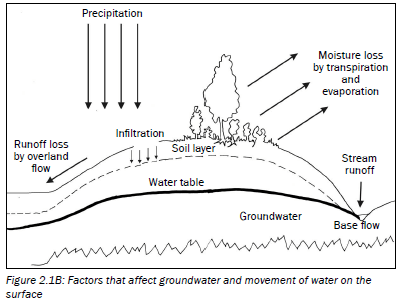
Activity 2.1
- List three important things that should be present for water to infiltrate into the soil. (3 × 2 = 6)
- Describe how groundwater supplies are replenished (filled up). (1 × 2 = 2)
- Why is it important to manage (look after) groundwater? (1 × 2 = 2)
[10]
In the exam, you may be given a diagram and asked to identify which aspect or factor has affected the runoff or infiltration.
Answers to activity 2.1
|
2.2 Rivers
When there is less infiltration, more runoff takes place. This starts as sheet flow but very soon the water flows in a path called channel flow.
When we study rivers we look at them in different ways:
- Types of rivers
- River discharge
- Drainage basins
- Stages and profiles of rivers
2.2.1 Types of rivers
The water table refers to the surface of the water-saturated part of the ground. The height of the water table changes each season. This gives rise to different types of rivers. Rivers are classified depending on when (or if) the river valley cuts into the water table.
There are three types of rivers:
- Permanent rivers flow all year round and are always in contact with the water table.
- Periodic rivers only flow during the rainy season. They are in contact with the water table only in the rainy season.
- Episodic rivers only flow after heavy rainfall when runoff flows into the river. They do not come into contact with the water table.
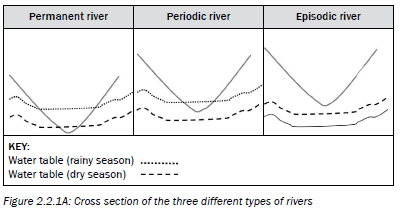
In the exam, you may be given a diagram of a cross section of a river and asked to identify the type of river. Learn to identify the different river types by redrawing and labelling Figure 2.2.1A.
River discharge
The amount of water flowing out of a river shows many aspects of a river. One way to study this discharge or runoff is by looking at a flow hydrograph.
When runoff enters a river, the amount of water flowing in the river increases. A hydrograph records how quickly the water level increases (time) and how high the water level reaches (peak flow discharge).
A flow hydrograph combines two graphs:
- A bar graph showing the amount of precipitation
- A line graph showing how the water level increases and decreases over time
Figure 2.2.1B below shows an example of a flow hydrograph. Study the graph and then read the explanation alongside.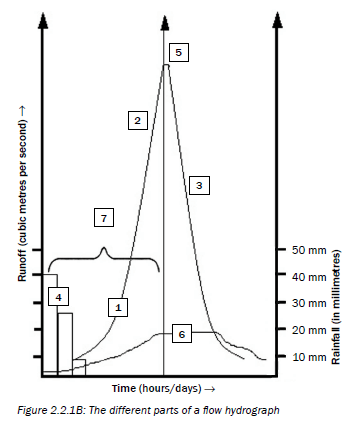
Explanation of the elements in Figure 2.2.2B(left):
|
The flow hydrograph in Figure 2.2.1B can be interpreted as follows:
The slope of the line graph indicates the increase in the river’s volume (discharge). If the slope of the line graph is steep, there is more runoff than infiltration. If the slope is gentle, there is more infiltration than runoff. The graph in Figure 2.2.1B has a steep slope, so there is more runoff than infiltration.
The highest point on the line graph is the peak flow discharge. This is when the river reaches its highest volume. The difference in time between when it rains and when the peak flow discharge occurs is called the time lag. The time lag is affected by the amount of runoff and infiltration that occurs. More runoff causes a shorter time lag and more infiltration causes a longer time lag.
The following factors influence the time lag:
- Amount of vegetation (increased vegetation reduces runoff and causes a longer time lag)
- Steepness of slope (a steeper slope increases runoff and causes a shorter time lag)
- Amount of rainfall (lots of rainfall increases runoff and causes a shorter time lag)
- Nature of rainfall (heavy rainfall increases runoff and causes a shorter time lag)
Figure 2.2.1C below shows the difference in the time lag between a natural catchment and an urbanised catchment.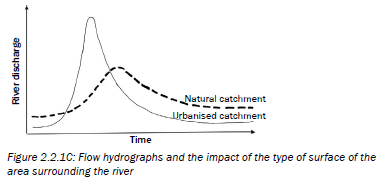
We can interpret the flow hydrograph in Figure 2.2.1C as follows:
- The line graph for the urbanised catchment area is much steeper than the line graph for the natural catchment as there is more runoff and less infiltration in the urbanised catchment.
- This is because the urbanised catchment has less vegetation which results in more runoff.
| Natural catchment (more vegetation) | Urbanised catchment (less vegetation) |
| More infiltration | Less infiltration |
| Less runoff | More runoff |
| Longer time lag | Shorter time lag |
| Lower peak discharge | Higher peak discharge |
Table 2.2: The difference between natural catchment and urbanised catchment
The amount of runoff on the surface leads to the development of rivers, which together form a river system within a drainage basin.
In the exam, you may be asked to determine the impact on time lag if an area that has a lot of vegetation (natural catchment) becomes urbanised (is covered by a city).
Study Table 2.2
(right) and make sure you know the difference between a natural catchment and an urbanised catchment so that you can interpret flow hydrographs in the exam. Remember, the catchment area refers to the area from which rainfall flows into a river, lake or reservoir.
Flow characteristics
The nature of the landscape over which the rivers flow will determine how the water moves in the river systems. Figure 2.2.1D (right) shows the two types of flow, namely laminar and turbulent flow.
A smooth channel causes a laminar flow of water and is more efficient. Less of the available energy is used to overcome friction (found on the lower course of a river).
A rough channel causes a turbulent flow of water. An uneven rocky bed causes an uneven flow of water. This increases the surface area for friction. This type of flow is very inefficient (found on the upper course of a river).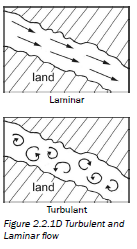
2.2.2 Drainage basins
A drainage basin is an area drained by a river system. You need to know the different parts of a drainage basin to understand the other aspects of rivers, such as a river’s source, river mouth, watershed and tributaries. Figure 2.2.2A (right) shows the different parts of a drainage basin.
A river does not flow by itself but is part of a river system (a main river and all its tributaries).
We will now look at two aspects of river systems: drainage density and drainage patterns.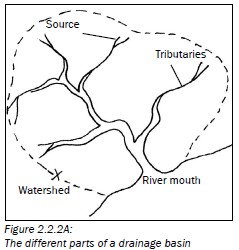
Drainage density
Drainage density describes how many streams there are in a drainage basin. Drainage density is affected by the same factors that affect runoff and infiltration:
- More infiltration will cause fewer rivers to occur, causing a low drainage density.
- More runoff will cause more rivers to occur, causing a high drainage density.
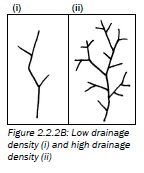
Figure 2.2.2B (i) (right) shows a low drainage density and Figure 2.2.2B (ii) (right) shows a high drainage density.
Interpretation of Figure 2.2.2B (i):
Drainage basin (i) has fewer tributaries so it has a low drainage density.
Some reasons for low drainage density are:
- Soft rainfall causing more infiltration
- Gentle slopes causing more infiltration
- Lots of vegetation causing more infiltration
- Very little rain so the ground can still hold more water causing more infiltration
You may be asked in an exam to give reasons for an area having a high or low drainage density.
Interpretation of Figure 2.2.2B (ii):
Drainage basin (ii) has more tributaries so it has a high drainage density.
Some reasons for high drainage density are:
- Heavy rainfall causing more runoff
- Steep slopes causing more runoff
- Very little vegetation causing more runoff
- Lots of rain so the ground cannot hold any more water causing more runoff
- Very little rain so the ground can still hold more water causing moreVery little rain so the ground can still hold more water causing more infiltration
Activity 2.2
Refer to drainage basins A and B in Figure 2.2.2C and the flow hydrograph showing line graphs D and E after a period of rainfall, to answer the following questions.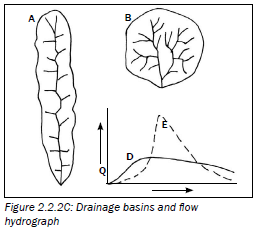
- The rivers in drainage basin A flow all year round. What type of river would this be classified as? (1 × 2 = 2)
- Graph D in the flow hydrograph shows the runoff of drainage basin A after a period of rain.
- Define the term ‘lag time’. (1 × 2 = 2)
- How would the lag time change if massive deforestation were to occur in drainage basin A where D was recorded? (1 × 2 = 2)
- Justify your answer in question b). (2 × 2 = 4)
- Name another factor which could occur and have the same impact on the lag time as mentioned in question b). (1 × 2 = 2)
-
- State the drainage density of drainage basin B. (1 × 2 = 2)
- Describe THREE possible causes for the drainage density found in drainage basin B. (3 × 2 = 6)
[20]
Answers to activity 2.2
|
Complete activity 2.2 to practise the concepts you have learnt so far in this chapter.
Drainage patterns
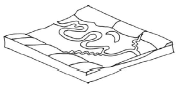
In a river system, individual streams flow over the surface in stream channels. These channels will cut into the rock surface where it is easiest to erode the rock. These channels form patterns known as drainage patterns. Figure 2.2.2D, E, F below show three types of drainage patterns.
You may be asked in an exam to identify the drainage pattern, describe the pattern (what it looks like) or explain what caused the pattern to occur. When you are asked to explain the cause of the drainage pattern, you may be required to name the underlying rock structure in the area.
Figures 2.2.2 D, E and F summarise the main things you need to learn about drainage patterns.
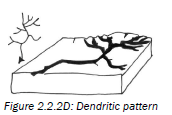 | Name: Dendritic Description: Looks like the branches of a tree with tributaries joining the main river at acute angles Explanation: Occurs where the underlying rock is of homogenous (equal) resistance, namely either horizontal (flat) sedimentary rock, massive igneous or metamorphic rock |
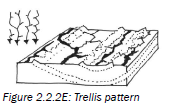 | Name: Trellis Description: Parallel streams with short tributaries joining at right angles (90°) Explanation: Occurs where the surface rock is of alternate resistance (strong and weak rock), or where sedimentary rock is folded |
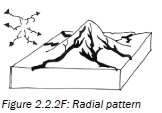 | Name: Radial Description: Streams flow outwards from one raised central point (dome or volcano) Explanation: Rivers flow downhill and away from the highest central point. |
Activity 2.3
Identify and briefly describe the drainage patterns in Figure 2.2.3G below.
(3 × 4 = 12)
[12]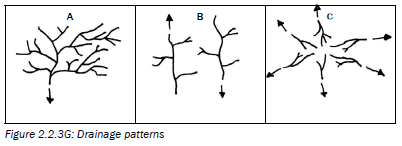
Answers to activity 2.3
|
2.2.3 Stages of a river
As a river flows from the mountains (source) to the sea (mouth), the amount of erosion and deposition changes. This changes what the river looks like from its source to its mouth:
- In its upper course, a river erodes vertically (downwards) creating steep valleys.
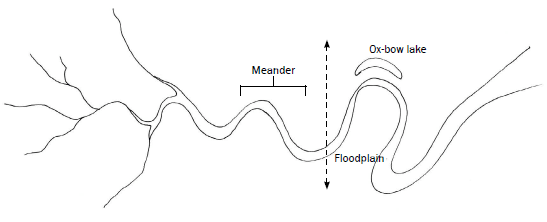
- In the middle course, lateral erosion and a little bit of deposition occur. The lateral erosion occurs unequally (unevenly) on the sides of the river. This causes the river to start meandering (flowing or bending from side to side).
- By the time the river reaches its lower course, the eroded material (sediment) carried by the river begins to be deposited onto the floodplains. A floodplain is a wide, flat area alongside a river.
- Floodplains are formed by the river eroding laterally (sideways). In the lower course the meanders may be cut off when the river flows straight, forming an ox-bow (U-shaped) lake.
Figure 2.2.3A (see page 33) shows the stages of a river in plan view.
Figure 2.2.3B (see page 33) shows the stages of a river in oblique view.
Table 2.3 (see page 33) summarises the features of a river at each stage.
You may be asked in an exam to identify the stage of a river from a plan view, an oblique view or a cross section diagram. You may also be asked to draw a river in a plan view or a cross section diagram of a river at a particular stage. To do this, learn the characteristic features of each stage. This is also useful for identifying the stage of a river on a topographic map.
| Upper course | Middle course | Lower course |
 | ||
| Figure 2.2.3A: Plan view of upper course, middle course and lower course | ||
 | 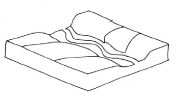 |  |
| Figure 2.2.3B: Oblique view of upper course, middle course and lower course | ||
| Typical features at each stage | ||
|
|
|
Table 2.3: Typical features of a river at each stage
2.2.4 River profiles
When we look at a river from the side (profile view) we can study it from two sides:
- Longitudinal profile: The profile from the river’s source to its mouth.
- Cross profile: The profile from one side of the river valley to the other side, through the river channel (depth and width).
Figures 2.2.4A and 2.2.4B (i) to (iii) on the next page show the profiles of a river. These figures are drawn as cross–sectional views. A cross section can be drawn as a longitudinal profile and as a cross profile.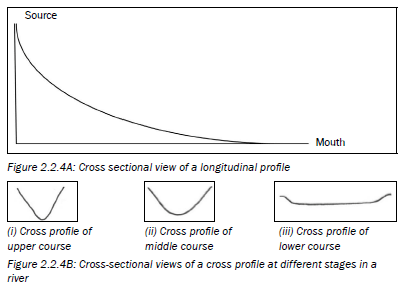
Activity 2.4
- Draw a longitudinal profile of a river (from source to mouth) and show the upper, middle and lower courses. (1 × 4 = 4)
- List two features of the upper course of a river. (2 × 2 = 4)
- Describe a river in its lower course. (2 × 2 = 4)
- Describe one difference between the river channel in the upper course and the lower course. (2 × 2 = 4)
[16]
Answers to activity 2.4
|
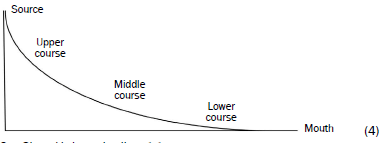
Figure 2.2.5A: An oblique view of a Figure 2.2.5B: An oblique view of a river valley in the upper course before river valley in the upper course after river rejuvenation has occurred river rejuvenation has occurred
2.2.5 River capture and rejuvenation
The longitudinal profile of a river has a concave shape. Changes can occur to a river’s longitudinal profile because of two processes:
- Rejuvenation: We will focus on the causes of rejuvenation and the changes to the cross profiles of each stage in a river.
- River capture: We will focus on the features that occur as a result of river capture.
Rejuvenation
When a river gets more energy it is said to be rejuvenated. It has more energy to erode downwards and laterally (sideways).
The causes of river rejuvenation are:
- An increase in the volume of the river, giving the river more energy.
- A drop in sea level due to uplift of land makes the longitudinal profile steeper, giving the river more energy.
Let us now look at the changes in the cross profiles of a river due to rejuvenation:
- Upper course: The valley becomes steeper and more V-shaped. This is shown in Figure 2.2.5B (below right).

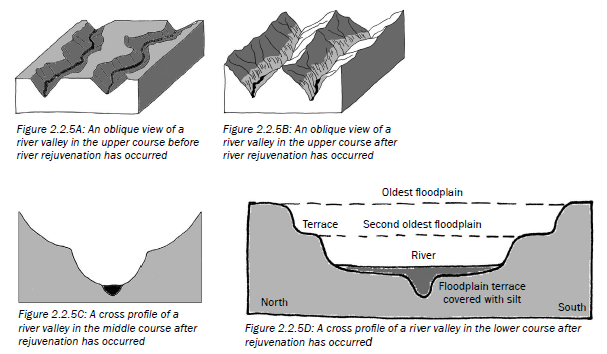
Middle course: Downward erosion results in a second U-shaped valley forming. This results in a valley within a valley. This is shown in Figure 2.2.5C (above).
Lower course: Downward and lateral (sideways) erosion cause a second valley to form. Because floodplains occur in this stage of a river, the valleys have a step-like (terraced) appearance. This is shown in Figure 2.2.5D (above). If meanders occur, they will be eroded downwards (incised) forming steep-sided meanders.
Let us now look at the changes in the longitudinal profile of a river due to rejuvenation:
The concave shape of a longitudinal profile is called a graded profile. When rejuvenation occurs, there is a sudden drop in the profile, causing the profile to no longer be concave. The profile is now an ungraded profile. The sudden drop in the profile is called a knickpoint. Rejuvenation can occur more than once along a river’s profile forming knickpoints along the way. Figure 2.2.5E (left) shows a graded (concave) longitudinal profile of a river before rejuvenation. Figure 2.2.5F (left) shows an ungraded (not concave) longitudinal profile of a river after rejuvenation.
The river wants to regain its concave profile so it will erode the knickpoints, making them less visible over time.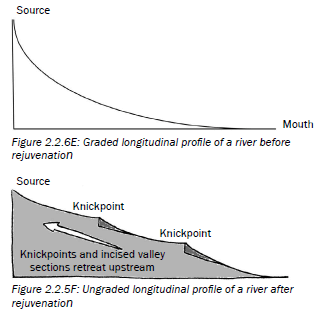
River capture
A river is rejuvenated when it gets more energy. A river which has more energy can lead to more erosion, especially headward erosion. Headward erosion is when the source of a river erodes backwards towards the watershed. The headward erosion eventually leads to the river capturing the water of another river. River capture is sometimes called river piracy.
This is because one river ‘robs’ another river of its water.
Headward erosion occurs because a river has more energy. Reasons for the increased energy are:
- A river flowing over a steeper gradient will flow faster
- A river with a larger volume will flow faster
- A river flowing over less resistant rock will flow faster
In Figures 2.2.5G and H (see page 37) you can see how river A erodes back (headward erosion) towards river B. River A ‘captures’ extra water from river B. River A is rejuvenated.
Study Figures 2.2.5I and J (see page 37) of stream capture and note the different features formed as a result of river capture.
Figure 2.2.6E: Graded longitudinal profile of a river before rejuvenation
Figure 2.2.5F: Ungraded longitudinal profile of a river after rejuvenation
A graded profile has no kickpoint, it is a smooth concave slope.
An ungraded profile has one or more kickpoints
You may be asked in an exam to identify if rejuvenation has occurred. Knickpoints occur during rejuvenation. After rejuvenation, knickpoints wear away, making the profile smooth once again (graded).
Once river capture has occurred, various features are visible in the drainage basin.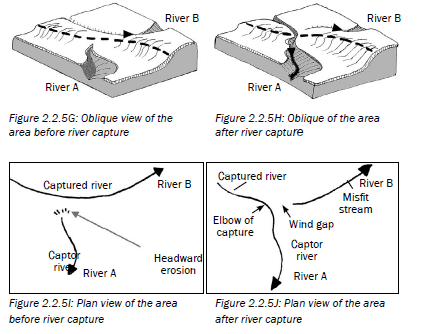
Study Figures 2.2.5 I and J (above) and take note of the different features formed as a result of river capture.
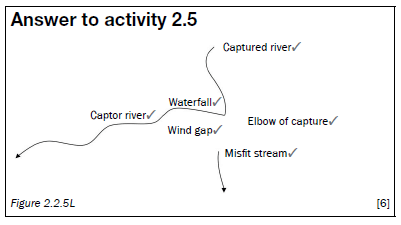
| Feature | Explanation |
| Captor river | The energetic stream that cuts back and intercepts (takes) the water of the other river. |
| Captured river | The river which has its water intercepted (taken) by the captor river. |
| Misfit stream | The river that has lost its source water as a result of capture. It is also called the beheaded stream. |
| Elbow of capture | The point of capture where a change of flow direction occurs. |
| Wind gap | The area between the elbow of capture and the misfit stream where water stops flowing and dry deposited gravels are exposed. |
| Waterfall | This may form at the point where the captured river flows into the captor river. |
Table 2.4: Features of river capture
| Example of a description of river capture River capture takes place when the energetic stream (captor stream) cuts back and intercepts (takes) the water from the other river (captured/beheaded river). The captured river turns into a misfit stream and a wind gap forms (where water stops flowing altogether). An elbow of capture is formed at the point of capture. Sometimes a waterfall may be formed at the elbow of capture. The captor stream is rejuvenated. |
You may be asked in an exam to identify the features of river capture on a diagram or you may be asked to describe the features in detail. Use mobile notes to help you learn the features of river capture provided in Table 2.4.
Activity 2.5
Figure 2.2.5K (right) shows a plan view of an area before river capture has occurred. Redraw the rivers after river capture has occurred.
On the diagram you have drawn, label the resultant features of river capture.
[6]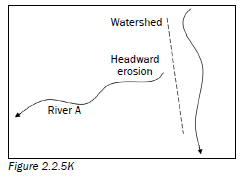
South Africa is not a water rich country.
2.2.6 Catchment area and river management
Importance of managing drainage basins and catchment areas
- Our river systems are a resource.
- Like all other natural resources, rivers are shared.
- Water is essential for our survival and well-being, as well as for social and economic development.
- Water resources are used for agriculture, industry, domestic use, hydro electric power and recreation.
- River systems are part of the water cycle.
- All water bodies are linked.
- The way we use the land has a dramatic impact on the water cycle.
- Our river systems are a habitat and function as ecosystems.
- A river links together many ecosystems in a catchment.
Impact of people on drainage basins and catchment areas
- Landfills, mining and agriculture pollute groundwater.
- Industries and sewage works discharge water waste into rivers.
- Agricultural run-off contains fertilizers and pesticides, which pollute rivers.
- Domestic use of rivers in informal settlements pollutes and litters rivers.
- Boreholes reduce the amount of groundwater that feeds rivers.
- Alien vegetation consumes large quantities of water very quickly in the river zone.
- Overgrazing and removal of vegetation reduce groundwater and increase run-off.
- Dams change the flow of a river.
- Draining of wetlands causes increased flooding.
- Flood control methods restrict the path of a river.
Activity 2.6
Use the topographical map of Nelspruit 2530BD at the back of this study guide to answer the following questions.
- The contour interval of this topographical map is...
- 1000 metres
- 50 000 metres
- 25 metres
- 20 metres
- The Crocodile River is a/an...
- Periodic river
- Exotic river
- Permanent river
- Seasonal river
(2 × 2 = 4) [4]
Answers to activity 2.6
|