GEOGRAPHY PAPER 2 GRADE 12 QUESTIONS - NSC PAST PAPERS AND MEMOS FEBRUARY/MARCH 2016
Share via Whatsapp Join our WhatsApp Group Join our Telegram GroupGRADE 12
GEOGRAPHY P2
FEBRUARY/MARCH 2016
NATIONAL SENIOR CERTIFICATE
RESOURCE MATERIAL
- An extract from topographical map 3126DD QUEENSTOWN.
- Orthophoto map 3126 DD 13 QUEENSTOWN.
- NOTE: The resource material must be collected by schools for their own use.
INSTRUCTIONS AND INFORMATION
- Write your EXAMINATION NUMBER and CENTRE NUMBER in the spaces on the cover page.
- Answer ALL the questions in the spaces provided in this question paper.
- You are provided with a 1 : 50 000 topographical map (3126DD QUEENSTOWN) and an orthophoto map (3126 DD 13 QUEENSTOWN) of a part of the mapped area.
- You must hand the topographical map and the orthophoto map to the invigilator at the end of this examination session.
- You may use the blank page at the back of this question paper for all rough work and calculations. Do NOT detach this page from the question paper.
- Show ALL calculations and formulae, where applicable. Marks will be allocated for these.
- Indicate the unit of measurement in the final answer of calculations.
- You may use a non-programmable calculator.
- The following English terms and their Afrikaans translations are shown on the topographical map:
| ENGLISH | AFRIKAANS |
| Aerodrome Caravan Park College Diggings Golf Course Gorge Holiday Resort Purification Plant River Sewage Works Yacht Club | Vliegveld Karavaanpark Kollege Uitgrawings Gholfbaan Ravyn (Kloof) Vakansieoord Watersuiweringsaanleg Rivier Rioolwerke YSeiljagklub |
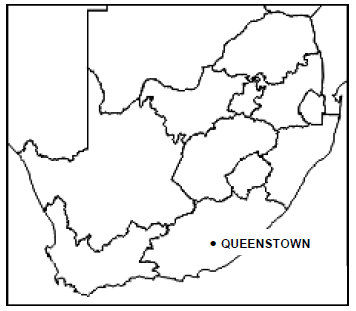
GENERAL INFORMATION ON QUEENSTOWN
Coordinates: 31°54'S 26°53'E Queenstown is a town in the Eastern Cape in South Africa. It lies on the Komani River, which forms part of the Great Kei system of rivers. Queenstown has a refreshing climate and plentiful water supply from the surrounding rugged mountains. The water is collected in the Bonkolo Dam (the name has been changed from Bongolo Dam recently), set in the hills. This dam is used extensively for recreation and water sports. Close to Queenstown is a nature reserve (Lawrence de Lange Nature Reserve) with numerous antelope, white rhinoceros and spectacular flowering plants, together with panoramic views from the mountain summit. Queenstown has rich sandstone layers deposited by meandering rivers on the flood plain. Queenstown's layout reflects its original objective as a defensive stronghold for the frontier area and has a most unusual design. There is a central hexagonal area where canon or rifle fire could be directed down six thoroughfares radiating from the centre. |
QUESTION 1: MULTIPLE-CHOICE QUESTIONS
The questions below are based on the 1 : 50 000 topographical map 3126DD QUEENSTOWN, as well as the orthophoto map of a part of the mapped area. Various options are provided as possible answers to the following questions. Choose the answer and write only the letter (A–D) in the block next to each question.
1.1 Queenstown is situated in the …
- Western Cape.
- Eastern Cape.
- Northern Cape.
- Free State.
1.2 The numbers 3126 in the map index refers to …
- 31' latitude and 26' longitude.
- 26' latitude and 31' longitude.
- 26° latitude and 31° longitude.
- 31° latitude and 26° longitude.
1.3 The direction of trigonometrical station 60 in block F1 from spot height 1076 in block J1 on the topographical map is …
- north-west.
- east-northeast.
- north.
- north-northeast.
1.4 What feature indicates that groundwater is found in I6?
- Dam
- Reservoir
- Windmill
- Non-perennial river
1.5 The angle at which the tributaries meet the main stream in C1 on the topographical map indicates that the general flow direction of this stream is ...
- westerly.
- northerly.
- easterly.
- southerly.
1.6 The height of the index contour line in block B10 on the topographical map is ... metres.
- 1 095
- 1 100
- 1 160
- 1 200
1.7 Area 1 on the orthophoto map has a/an … street pattern.
- unplanned irregular
- gridiron
- radial concentric
- planned irregular
1.8 The drainage pattern in blocks C9/10 and D9/10 on the topographical map is a … pattern.
- parallel
- centripetal
- radial
- trellis
1.9 What is the stream order at point X in block D9?
- 3
- 2
- 1
- 4
1.10 The landform at R in block I4 on the topographical map is a …
- pass.
- saddle.
- gorge.
- spur.
1.11 The shadows of the trees at 16 on the orthophoto map are found in the south-east, indicating that the photograph was taken at …
- 08:00
- 16:00
- 10:00
- 14:00
1.12 The major primary activity in the mapped area is …
- forestry.
- farming.
- mining.
- fishing.
1.13 Bowkerskop, found between points 7 and 8 on the orthophoto map, is a …
- mesa.
- cuesta.
- conical hill.
- butte.
1.14 The main factor limiting farming in block A3, that is evident on the topographical map, is ...
- pollution.
- deforestation.
- erosion.
- overgrazing.
1.15 Identify feature 14 on the orthophoto map.
- Embankment
- Mine dump
- Excavation
- Cutting(15 x 1)
[15]
QUESTION 2: MAP CALCULATIONS AND TECHNIQUES
2.1 Calculate the magnetic bearing of spot height 1200 (block H5) from trigonometrical station 203 in block G6 on the topographical map.
Formula:
Magnetic bearing = true bearing + present magnetic declination
True bearing: __________________________________________________
Difference in years: ______________________________________________
Mean annual change: ___________________________________________
Total change: __________________________________________________
Magnetic declination for 2016: ___________________________________
___________________________________
___________________________________
Magnetic bearing for 2016: ________________________________________
________________________________________
(6 x 1) (6)
2.2 Refer to recreational area S on the topographical map and 11 on the orthophoto map.
2.2.1 Calculate the area of recreational area S on the topographical map in m2. Show ALL calculations. Marks will be awarded for calculations.
Formula: area = length (L) x breadth (B)
_______________________________________________________
_______________________________________________________
_______________________________________________________
_______________________________________________________
_______________________________________________________
(4 x 1) (4)
2.2.2 The area of recreational area S on the topographical map is the same as the area of recreational area 11 on the orthophoto map as it is the same place. Explain why it appears to be larger on the orthophoto map.
_______________________________________________________
______________________________________________________________
______________________________________________________________
______________________________________________________________
______________________________________________________________
(2 x 1) (2)
2.3 Refer to trigonometrical station 293 in block D6 and trigonometrical station 187 in block D7 and answer the questions that follow.
2.3.1 Calculate the average gradient between trigonometrical station 293 in block D6 and trigonometrical station 187 in block D7. Show ALL calculations. Marks will be awarded for calculations.
Formula: gradient = vertical interval (VI)
horizontal equivalent (HE)
_______________________________________________________
_______________________________________________________
_______________________________________________________
_______________________________________________________
_______________________________________________________
_______________________________________________________
_______________________________________________________
_______________________________________________________
(4 x 1) (4)
2.3.2 Draw a diagram that illustrates the average gradient, calculated in QUESTION 2.3.1.
Diagram
 (2 x 1) (2)
2.3.3 Give reasons why the gradient calculated in QUESTION 2.3.1 is considered relatively steep.
_______________________________________________________
_______________________________________________________
(2 x 1) (2)
[20]
QUESTION 3: APPLICATION AND INTERPRETATION
3.1 Find Bowkerskop in the south-eastern section of the orthophoto map. The orthophoto map clearly shows a difference in vegetation density on either side of Bowkerskop.
3.1.1 State, and define, the microclimatological phenomenon responsible for the difference in vegetation density on either side of Bowkerskop.
_______________________________________________________
_______________________________________________________
_______________________________________________________
(2 x 1) (2)
3.1.2 Explain how this microclimatological phenomenon in QUESTION 3.1.1 is responsible for the difference in vegetation density on either side of Bowkerskop.
_______________________________________________________
_______________________________________________________
(1 x 2) (2)
3.2 Refer to block H1 on the topographical map and answer the following questions:
3.2.1 Name the stream channel pattern of the river in block H1.
_______________________________________________________
(1 x 1) (1)
3.2.2 Give reasons why the stream channel pattern in QUESTION 3.2.1 developed here.
_______________________________________________________
_______________________________________________________
_______________________________________________________
_______________________________________________________
(2 x 2) (4)
3.2.3 Explain why laminar flow is taking place in block H1.
_______________________________________________________
(1 x 2) (2)
3.3 Study slopes 12 and 13 on the orthophoto map.
3.3.1 Give the shape for each of slopes 12 and 13.
Slope 12: _______________________________________________
Slope 13: _______________________________________________
(2 x 1) (2)
3.3.2 Name the landform formed by slopes 12 and 13.
_______________________________________________________
(1 x 1) (1)
3.4 Study the residential area Blue Rise in blocks D5 and D6.
Explain how the size of the plots and the location of Blue Rise indicate that it is a high-income residential area.
______________________________________________________________
______________________________________________________________
______________________________________________________________
(2 x 2) (4)
3.5 Queenstown is classified as a gap town.
3.5.1 Define the term gap town.
_______________________________________________________
_______________________________________________________
(1 x 1) (1)
3.5.2 State ONE economic advantage of the location of Queenstown.
_______________________________________________________
_______________________________________________________
(1 x 2) (2)
3.5.3 State ONE environmental disadvantage of the location of Queenstown.
_______________________________________________________
_______________________________________________________
(1 x 2)
(2)
3.6
You are a town and city planner. It is required of you to evaluate the Queenstown area regarding its tourism potential.
Why would you promote Queenstown as a tourist destination?
______________________________________________________________
______________________________________________________________
(2 x 1) (2)
[25]
QUESTION 4: GEOGRAPHICAL INFORMATION SYSTEMS (GIS)
4.1 The orthophoto map shows a high resolution.
4.1.1 Explain the term resolution.
_______________________________________________________
_______________________________________________________
(1 x 1) (1)
4.1.2 Give evidence that the orthophoto map has a high resolution.
_______________________________________________________
_______________________________________________________
(1 x 1) (1)
4.1.3 Why can one say that the orthophoto map is an example of raster data?
_______________________________________________________
_______________________________________________________
(1 x 1) (1)
4.2 Due to the increase in farming in block A8, the possibility of increased erosion is very likely. The local municipality can use remote sensing to assess the impact of erosion on the Bonkolo Dam.
4.2.1 Explain the term remote sensing.
_______________________________________________________
_______________________________________________________
(1 x 1) (1)
4.2.2 Explain how the local municipality will use remote sensing to monitor the negative impact of the increased erosion on the Bonkolo Dam.
_______________________________________________________
_______________________________________________________
_______________________________________________________
(2 x 2) (4)
4.3 You have a choice between TWO sites on which to build a shopping mall: T in block B3 and U in block E7.
4.3.1 Give TWO data layers, evident on the topographical map, that you would use to assist you in making your choice.
_______________________________________________________
_______________________________________________________
(2 x 1) (2)
4.3.2 Name your final choice.
_______________________________________________________
(1 x 1) (1)
4.4 The plan view sketch of a part of Queenstown below is an example of data integration.
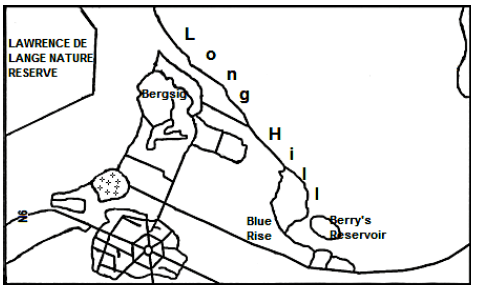
4.4.1 Explain the term data integration.
_______________________________________________________
(1 x 1) (1)
4.4.2 Name TWO sources that could have been used to obtain information to produce this sketch map.
_______________________________________________________
_______________________________________________________
(2 x 1) (2)
4.4.3 State ONE problem that a cartographer could have experienced when producing this sketch map.
_______________________________________________________
_______________________________________________________
(1 x 1) (1)
[15]
TOTAL: 75