GEOGRAPHY GRADE 12 PAPER 1 ANNEXURE - NSC PAST PAPERS AND MEMOS SEPTEMBER 2017
Share via Whatsapp Join our WhatsApp Group Join our Telegram GroupGEOGRAPHY
GRADE 12
PAPER 1
NSC PAST PAPERS AND MEMOS
SEPTEMBER 2017
ANNEXURE
FIGURE 1.1: FEATURES ASSOCIATED WITH A COASTAL LOW

[Source: Adapted from www.1stweather.com]
FIGURE 1.2: DRAINAGE BASIN FEATURES 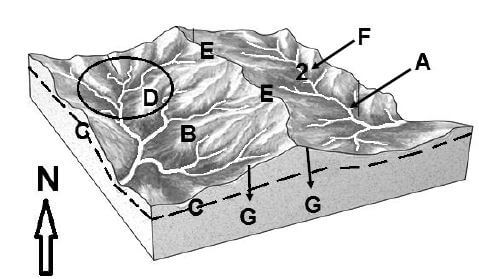
[Source: Adapted from http://www.google.co.za]
FIGURE 1.3: A TROPICAL CYCLONE IN ITS MATURE STAGE 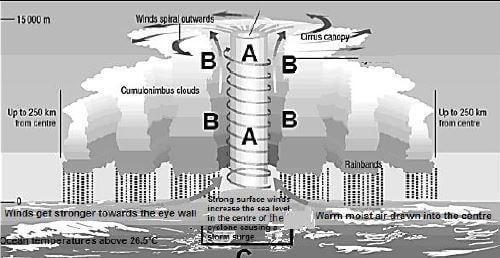
[Source: Adapted from http://www.google.co.za/images]
FIGURE 1.4: VALLEY IN THE NORTHERN HEMISPHERE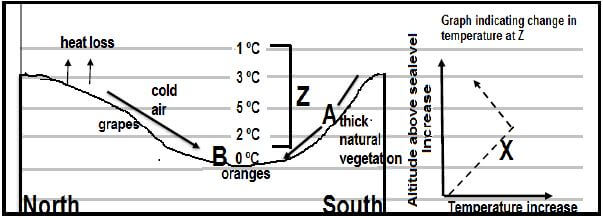
[Source: Adapted from Windows of the world]
FIGURE 1.5: DRAINAGE PATTERNS 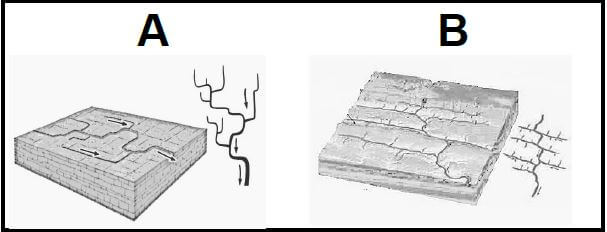
[Source: http://www.google.co.za/images]
FIGURE 1.6: RIVER IN A HIGHLYING AREA 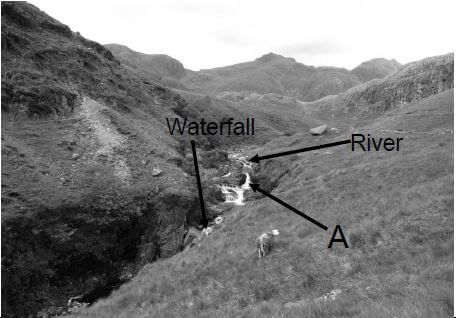
[Source: http://www.google.co.za/images]
FIGURE 2.1: AIR PRESSURE SYSTEMS IN SOUTH AFRICA 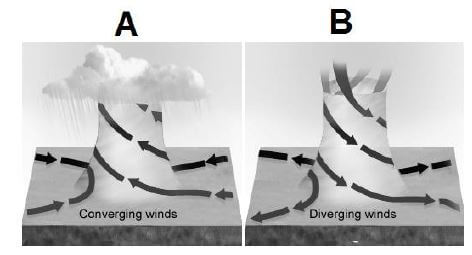
[Source: http://www.google.co.za/images]
FIGURE 2.2: FLOW PATTERNS OF RIVERS 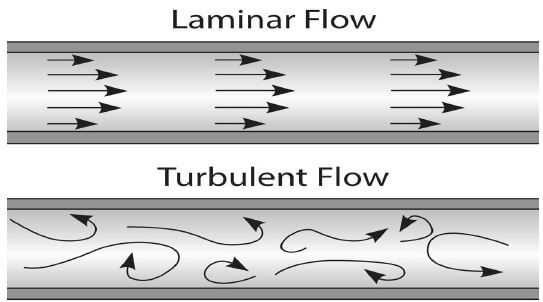
[Source: http://www.google.co.za/images]
FIGURE 2.3: SYNOPTIC WEATHER MAP AND WEATHER FORECAST FOR CAPE TOWN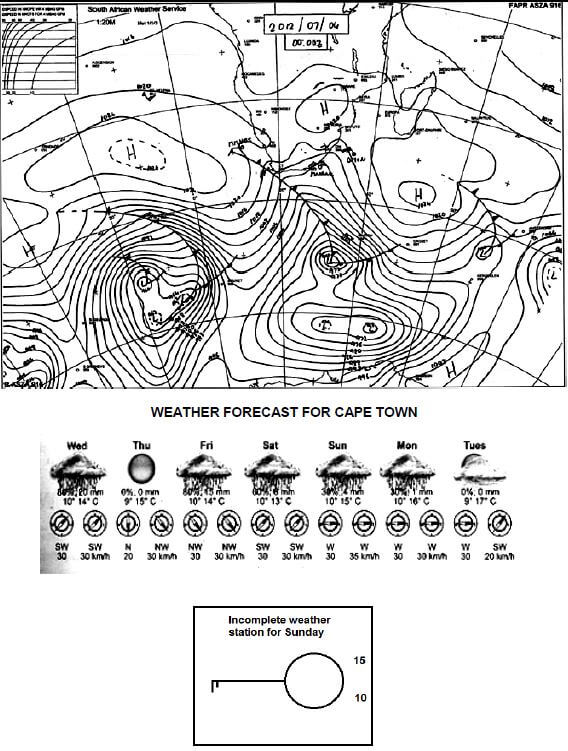
[Source: Adapted from Study Master Geography]
FIGURE 2.4: CLIMATIC CONTRASTS BETWEEN URBAN AND RURAL AREAS
| Climatic element | Differences between urban and rural areas |
| Insolation | 13-17% less than the surrounding rural areas |
| Air temperature | |
| (a) Annual mean | 0,5 – 1,0 °C higher than in the surrounding rural areas |
| (b) Winter minimum | 1,0 – 2,0 °C higher than in the surrounding rural areas |
| Relative humidity | 2–3% less than in surrounding rural areas |
| Precipitation | |
| (a) Annual mean | 5–10% more than in surrounding rural areas |
| (b) Thunderstorms | More than over surrounding rural areas |
| Cloudiness | 5–10% more than in surrounding rural areas |
[Source: New Windows on the World]
FIGURE 2.5: A MEANDERING RIVER 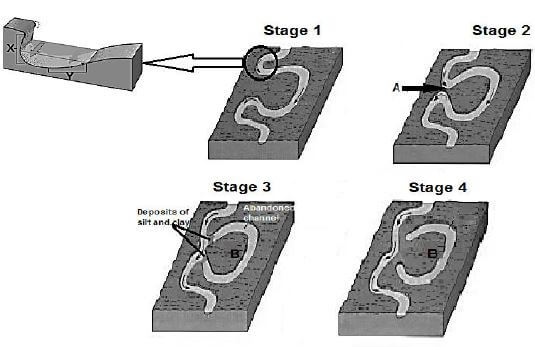
[Source: Physical Geology – Earth Revealed/google images]
FIGURE 2.6: RIVER CAPTURE 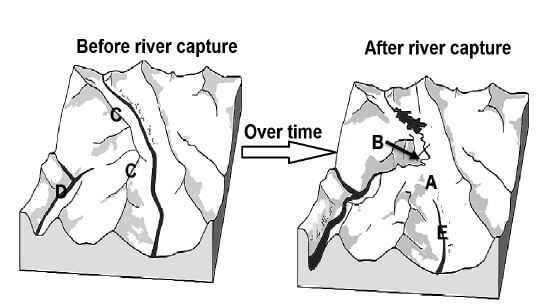
[Source: Adapted from www.orangesenqurak/org/river aspx]
FIGURE 3.1: BUSINESS DISTRICTS 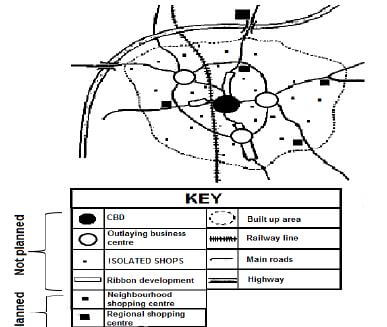
[Source: Adapted from X-kit Grade 12]
FIGURE 3.3: SETTLEMENT PATTERN 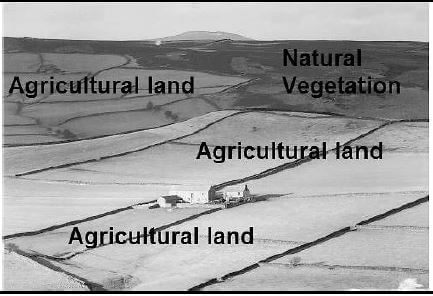
[Source: http://www.google.co.za/images]
FIGURE 3.4: TRAFFIC CONGESTION 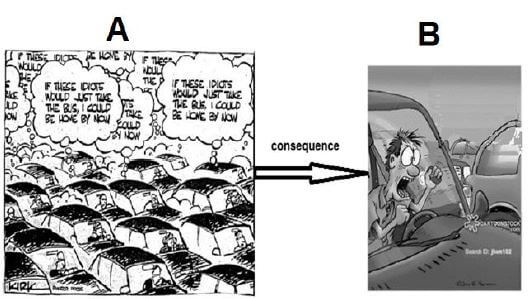
[Source: http://www.google.co.za/images]
FIGURE 3.5: KEY SECTORS OF SOUTH AFRICA’S ECONOMY 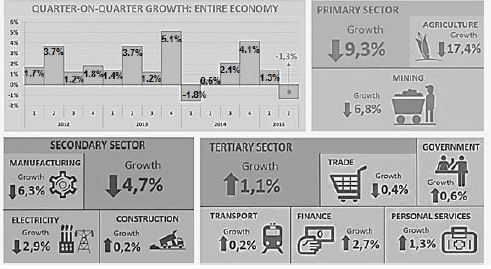
[Source: Statssa.co.za]
FIGURE 3.6: SOUTH WESTERN CAPE INDUSTRIAL REGION 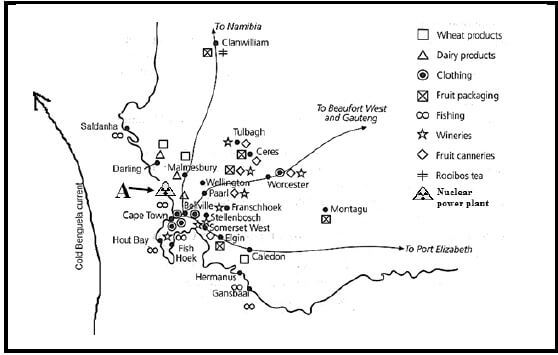
[Source: Focus on Geography/Grade 12 – Earl, et al]
FIGURE 4.2: TYPES OF SECTORS OF EMPLOYMENT IN SOUTH AFRICA A B 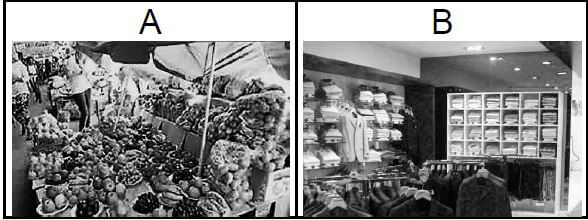
[Source: http://www.google.co.za/images]
FIGURE 4.3: LAND RESTITUTION
The Macleantown case study on land restitution The benefits of land restitution appear to be more symbolic than material. [Source: Mzingaye Brilliant Xaba and Monty J. Roodt / 9 December 2016 00:05] |
FIGURE 4.4: LAND USE ZONE IN AN URBAN AREA 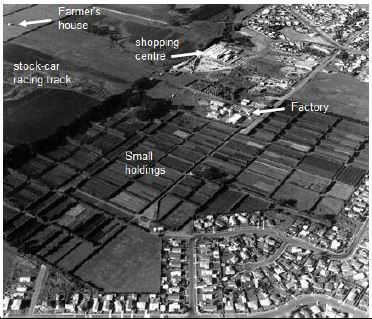
[Source: http://www.google.co.za/images/urban landuse]
FIGURE 4.5: MANUFACTURING IN SOUTH AFRICA
Manufacturing in South Africa South Africa has developed an established, diversified manufacturing base that has shown its resilience (staying power) and potential to compete in the global economy.The manufacturing sector provides a locus for stimulating the growth of other activities, such as services, and achieving specific outcomes, such as employment creation and economic empowerment. This platform of manufacturing presents an opportunity to significantly accelerate the country’s growth and development [Source: www.brandsouthafrica.com] |
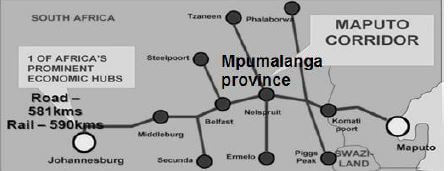
FIGURE 4.6: THE MAPUTO DEVELOPMENT CORRIDOR
The Maputo Development Corridor is one of the most ambitious and exciting initiatives undertaken within the Southern African region, stretching from Gauteng in South Africa, to Maputo in Mozambique. The corridor includes the Mpumalanga province with its rich minerals and aesthetic beauty.
[Source: Extract adapted from News 24] |