GEOGRAPHY GRADE 12 PAPER 2 MEMORANDUM - NSC PAST PAPERS AND MEMOS SEPTEMBER 2017
Share via Whatsapp Join our WhatsApp Group Join our Telegram GroupGEOGRAPHY
GRADE 12
PAPER 2
NSC PAST PAPERS AND MEMOS
SEPTEMBER 2017
MEMORANDUM
SECTION A
QUESTION 1: MULTIPLE-CHOICE QUESTIONS
1.1 C ✔
1.2 C ✔
1.3 B✔
1.4 D✔
1.5 C✔
1.6 B✔
1.7 B ✔
1.8 A ✔
1.9 B ✔
1.10 D ✔
1.11 B✔
1.12 B✔
1.13 A✔
1.14 C✔
1.15 C ✔ (15 x 1) (15)
[15]
SECTION B
QUESTION 2: MAPWORK CALCULATIONS AND TECHNIQUES
2.1 FIGURE 2.1 represents an incomplete cross section between points 4 and 5 on the orthophoto map.
2.1.1 Complete the cross section.
2.1.2 Label the position of spot height 203. 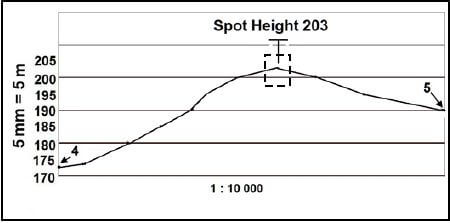
Marks allocated to:
- Outline of slope finished. ✔
- Spot height 203 (203 m) within the dotted lines. ✔
(2 x 1) (2)
2.1.3 Why is there no intervisibility between points 4 and 5 on the cross section?
- There is an obstruction between 4 and 5. ✔
- There is higher land (spot height 203) which blocks 4 from 5 from being seen. ✔
[Any ONE] (1 x 1) (1)
2.1.4 Calculate the vertical exaggeration of the cross section. Show ALL calculations. Marks will be awarded for calculations.
Formula: VE = Vertical scale (VS)
Horizontal scale (HS)
- VS = 5 mm = 5 (x 1 000) [1 : 1 000]
VS = 1: 1 000 ✔
HS = 1 ∶10 000 ✔
VE = 1 ÷ 1
1 000 10 000
= (1/1×10/1) ✔ OR (1 /1 000 × 10 000 / 1) ✔
= 10 /1
= 10 times ✔
(Learner must indicate unit.)
(4 x 1) (4)
2.1.5 Provide ONE reason why the vertical scale in a cross section is exaggerated (made bigger).
- It allows for the relief features to be seen more clearly. ✔
- If the vertical scale is not exaggerated, the relief feature will be flat. ✔
[Any ONE] (1 x 1) (1)
2.2
2.2.1 Calculate the average gradient between the trigonometric station (block G5) to trigonometric station (block H2) on the topographic map. Show ALL calculations. Marks will be awarded for calculations.
Formula: Gradient = Vertical interval (VI)
Horizontal equivalent (HE)
- VI = 726,5 m – 200,3 m VI = 726,5 m – 200,3 m
= 526,2 m ✔ = 526,2 m ✔
HE = 7,5 cm x 500 OR HE = 7,5 cm x 50 000
[Range 7,4 – 7,6] 500
= 3 750 m ✔ = 3 750 m ✔
[Range 3 700 – 3 800]
G = (526,2 /3 750 )✔ G = (526,2 /3 750 )✔
[Mark allocated for substitution]
= 1/ 7,1 = 1 / 7,1
= 1 : 7,1 / 1 in 7,1✔ = 1 : 7,1 / 1 in 7,1 ✔
[Range 1 : 7,0 – 1 : 7,3]
(4 x 1) (4)
2.2.2 With reference to the answer in QUESTION 2.2.1, is the gradient a true reflection of the actual landscape?
Give a reason for your answer.
No. ✔
Reason:
- We are calculating the average gradient and not the actual gradient. ✔
- From trigonometric station 94 to trigonometric station 138 there is a sharp change in gradient from mountainous area to a flat plain. ✔
[Any ONE] (2 x 1) (2)
2.3
2.3.1 Refer to the demarcated area in RED on the topographical map, which represents the orthophoto map. Use the demarcated area to calculate the surface area of the orthophoto map in km². Show ALL calculations. Marks will be awarded for calculations.
Formula: Area = length (L) x breadth (B)
- Length = 9,3 cm ✔ x 0,5 = 4,65 km (Range 4,6 – 4,7)
(9,2 cm – 9,4 cm)
[Accept other formulas to calculate length.]
Breadth = 7,4 cm ✔ x 0,5 = 3,7 km (Range 3,65 – 3,75)
(7,3 cm – 7,5 cm)
[Accept other formulas to calculate breadth.]
= 4,65 km ✔ x 3,7 km ✔
= 17,2 km² ✔
Range: 16,7 km² – 17,7 km²
[Accept other calculation methods.]
(5 x 1) (5)
2.3.2 Explain why the area covered by the orthophoto on the topographic map looks smaller than the orthophoto itself.
- The orthophoto map has a larger scale ✔
- Scale of orthophoto map is 5 times larger than the topographic map✔
- Scale of orthophoto map is 1 : 10 000 and the scale of the topographic map is 1 : 50 000 ✔
[Concept] (1 x 1) (1)
[20]
SECTION C
QUESTION 3: APPLICATION AND INTERPRETATION
3.1 Refer to the graph below, the information on page 3 and the topographical map to answer the questions that follow.
 |
[Source: https://en.climate-data.org/location/23402]
3.1.1 Calculate the average monthly rainfall (mm) for Citrusdal.
- 315 ÷ 12 = 26,25 mm ✔ (1 x 1) (1)
3.1.2 State the type of climate that this type of rainfall is associated with.
- Mediterranean climate ✔ (1 x 1) (1)
3.1.3 Given the above rainfall data (graph) and Citrusdal’s location, suggest ONE reason why there are many non-perennial streams in the area.
- Long dry summer – below average rainfall ✔
- Location on the SW coast dominated by cold Benguela current ✔
- Area experiences seasonal rain ✔
[Any ONE] (1 x 1) (1)
3.2 Grade 12 learners on a field trip to Citrusdal, discovered that the temperature at 12:00 (midday) at the caravan park labelled A, is a few degrees lower than the temperature near the industrial area labelled G, on the topographic map. Give reasons for the difference in temperature between the caravan park and the industrial area.
Caravan park is colder because:
- It is situated on the outskirts/far from the build-up area ✔✔
- It is close to water/Oliphant’s River. ✔✔
- There is a lot of vegetation nearby therefore more transpiration and lower temperatures. ✔✔
- There is less pollution or less activities that cause pollution. ✔✔
Industrial area is warmer because:
- It is situated in a built-up area – generating own heat. ✔✔
- There is less vegetation nearby. ✔✔
- There is more pollution (dome) such as dust and soot that absorb and retain heat for longer. ✔✔
[Any TWO] (2 x 2) (4)
3.3 Provide TWO pieces of evidence to justify that the site of the Oliphant’s River valley, situated on the west of the topographic map, is ideal for agriculture.
- Flat land / gentle slope / contour lines far apart ✔✔
- Close to water source / irrigation possible ✔✔
- Fertile soil / arable land ✔✔
[Any TWO] (2 x 2) (4)
3.4 There are numerous dams in the agricultural region of the area covered by the topographic map. Of what importance are these dams to the farmers during the dry seasons?
- Irrigation of cultivated lands / orchards and vineyards ✔✔
- Availability of water to live-stock ✔✔
- Water for domestic use ✔✔
[Any ONE] (1 x 2) (2)
3.5 Refer to the Oliphant’s River in block I2 on the topographic map.
3.5.1 Identify the stream channel pattern.
- Braided stream ✔ (1 x 1) (1)
3.5.2 Provide evidence from the topographic map to support your answer to QUESTION 3.5.1.
- Gentle gradient slows river velocity resulting in deposition. ✔✔
- The orchards on the sandbanks indicate that the sandbanks are above the level of water. ✔✔
- Shallow river splits into smaller rivulets (streams) around sandbanks. ✔✔
[Any TWO] (2 x 2) (4)
3.6 Refer to the town of Citrusdal.
3.6.1 Is Citrusdal a recreation, mining or gap town?
- Gap town ✔(1 x 1) (1)
3.6.2 Give evidence from the topographic map to support your answer.
- Situated between mountain ranges. ✔✔
- Situated between the Cederberg and Oliphant mountains. ✔✔
[Any ONE] (1 x 2) (2)
3.6.3 Explain the economic advantage of Citrusdal’s’ location.
- Tourism - Western Cape Fold mountains / Natural hot springs found there. ✔✔
- Agriculture – Citrus farming and vineyards contribute to the economy. ✔✔
- Employment in primary, secondary and tertiary sectors ✔✔
- Close to Cape Town and market. ✔✔
- Provides services for people travelling through the area. ✔✔
[Any TWO] (2 x 2) (4)
[25]
QUESTION 4: GEOGRAPHICAL INFORMATION SYSTEMS (GIS)
4.1 During the 2008 floods, accessibility to the Oliphant’s River Valley was limited to determine the extent of the damage. A GIS specialist used remote sensing to access flooded areas along the Oliphant’s River Valley.
4.1.1 Define the term remote sensing.
- Refers to the observation of the earth from a distance using satellites to gather information without having direct contact with an area. ✔
[Concept] (1 x 1) (1)
4.1.2 State TWO reasons as to why the GIS specialist chose remote sensing.
- Data can be collected from inaccessible areas. ✔
- Large areas can be captured as images. ✔
- Can be made available at short notice especially in times of floods (disaster management). ✔
- It can be used to track changes and development in an area over time. ✔
[Any TWO] (2 x 1) (2)
4.1.3 The GIS specialist also found that farming had a negative impact on the Oliphant’s River. He/she suggested that buffering should take place around the Oliphant’s River. Evaluate how this would prevent the mismanagement of the river.
- Limits pollution from pesticides wastes been deposited. ✔✔
- Leave areas around the river clear from farming expansion. ✔✔
- Prevents riverbank erosion. ✔✔
- Limits the negative effect on aquatic life of the river. ✔✔
[Any TWO] (2 x 2) (4)
4.2 Define the term spatial data.
- Refers to the location and shape of geographical features. ✔
[Concept] (1 x 1) (1)
4.3 Classify each of the following spatial objects in block E5, as a point, line or polygon (area).
- Non-perennial river / hiking trail: (line) ✔
- Spot height: (point) ✔
- Dam / cultivated lands: (polygon) ✔
(3 x 1) (3)
4.4 The diagram below illustrates the concept of data integration found in block A10 on the topographic map. Study the diagram and answer the questions below:
 |
[Source: Examiner]
4.4.1 Define the term data integration.
- Combining different types of data for decision-making. ✔
- Linking information from a variety of sources. ✔
[Concept] (1 x 1) (1)
4.4.2 Mention ONE problem that was experienced with data integration as shown in the diagram / figure prior to the introduction of GIS.
- Maps have different scales ✔
- First map 1 : 30 000, second map 1 : 80 000, third map 1 : 60 000, fourth map 1 : 50 000 [learner only needs to compare scales of two maps] ✔
[Any ONE] (1 x 1) (1)
4.4.3 State TWO ways, in which data integration could have assisted the farmer in making his farm at Kleinplaas, block E8, economically viable.
- Availability of water ✔
- Fertility of soil ✔
- Relief of the land (slope) ✔
- Microclimate ✔
- Access to infrastructure ✔
- Access to transport ✔
[Any ONE] (2 x 1) (2)
[15]
TOTAL: 75