GEOGRAPHY GRADE 12 PAPER 2 QUESTIONS - NSC PAST PAPERS AND MEMOS SEPTEMBER 2017
Share via Whatsapp Join our WhatsApp Group Join our Telegram GroupGEOGRAPHY
GRADE 12
PAPER 2
NSC PAST PAPERS AND MEMOS
SEPTEMBER 2017
RESOURCE MATERIAL
- An extract from topographic map 3219CA CITRUSDAL.
- Orthophoto map 3219CA 11 CITRUSDAL.
- NOTE: The resource material must be collected by the schools for their own use.
INSTRUCTIONS AND INFORMATION
- Write your NAME in the space provided on the cover page.
- Answer ALL the questions in the spaces provided in this question paper.
- You are provided with a 1 : 50 000 topographic map (3219CA CITRUSDAL) and an orthophoto map (3219CA 11 CITRUSDAL), of a part of the mapped area.
- You must hand in the topographic map and the orthophoto map to the invigilator at the end of this examination session.
- You must use the blank page at the back of this paper for all rough work. DO NOT detach this page from the question paper.
- Show ALL calculations and formulae, where applicable. Marks will be awarded for these.
- Indicate the unit of measurement in the final answer of calculations. Ensure that units are maintained throughout ALL your calculations and final answer.
- You may use a non-programmable calculator.
- The area demarcated in RED on the topographic map, represents the area covered by the orthophoto map.
- A glossary of some of the English and Afrikaans words that appear on the topographic and their translations appears below.
GLOSSARY
(SOME OF THESE ENGLISH TERMS OR THEIR AFRIKAANS TRANSLATIONS MAY APPEAR ON THE MAPS.)
ENGLISH | AFRIKAANS |
Landing strip Furrow Caravan park Diggings Sewerage works Hot springs Nature reserve | Vliegveld Voor Karavaanpark Uitgrawings Rioolwerke Warmwaterbronne Natuurreservaat |
QUESTIONS
QUESTION 1: MULTIPLE-CHOICE QUESTIONS
The questions below are based on the 1 : 50 000 topographic map 3219CA CITRUSDAL, as well as the orthophoto map of a part of the mapped area. Various options are provided as possible answers to the following questions. Choose the answer and write only the letter (A–D) in the block next to each question.
1.1 The map reference of the topographic map north of Citrusdal is …
- 1932AC.
- 3218BC.
- 3219AC.
- 3219AD.
1.2 The mean magnetic declination for the topographic map extract 3219CA Citrusdal in 2007 is, …
- 32°30ʹ W of True North.
- 19°00ʹ W of True North.
- 23°16ʹ W of True North.
- 24°22ʹ W of True North.
1.3 The orthophoto map scale of 1 : 10 000 means that one centimetre on the orthophoto map represents … kilometres on the ground.
- 0,01
- 0,1
- 0,5
- 0,05
1.4 The actual distance from number 4 to number 1 on the orthophoto map is … km.
- 5
- 5,3
- 1,3
- 1
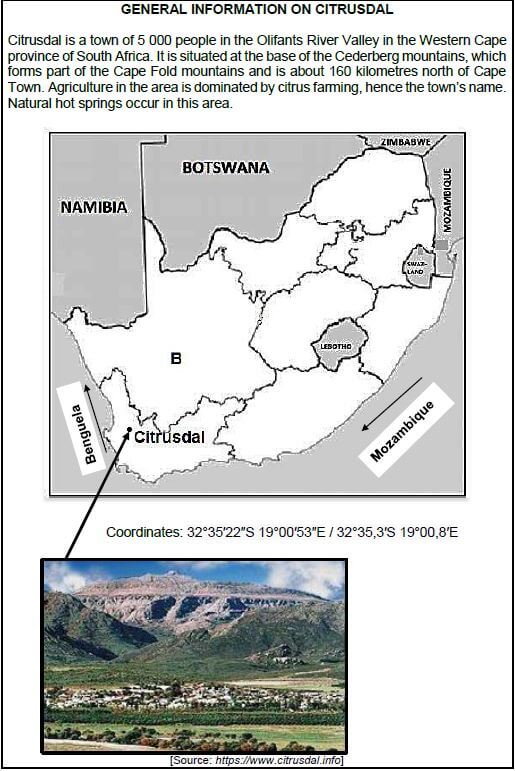
1.5 The province labelled B on the General Information on Citrusdal on page 3 is the …
- Free State.
- North West.
- Northern Cape.
- Eastern Cape.
1.6 To which mountain range does the Cederberg Mountains belong?
- Table Mountain
- Cape Fold
- Drakensberg
- Middelberg
1.7 The town of Citrusdal will experience … winds during the night.
- sea breeze
- katabatic
- anabatic
- land breeze
1.8 An orthophoto map is a … aerial photograph.
- vertical
- high oblique
- low oblique
- horizontal
1.9 The farming activity being practiced in the area marked 2 on the orthophoto map is, …farming.
- pastoral
- fruit
- forestry
- crop
1.10 The low lying landform found at H in block F8 on the topographic map is a …
- plain.
- saddle.
- spur.
- valley.
1.11 The feature labelled 1 on the orthophoto map is a …
- lake.
- dam.
- reservoir.
- river.
1.12 The grid reference (co-ordinates) of the trigonometric station number 94 block G5 is …
- 19°04'60"S 32°36'55"E / 19°04,1'S 32°36,9'E.
- 32°36'43"S 19°04'08"E / 32°36,7'S 19°04,1'E.
- 19°04'10"S 32°36'40"E / 19°04,1'E 32°36,6'E.
- 32°37'55"S 19°05'06"E / 32°37,9'S 19°05,1'E.
1.13 The drainage pattern marked C in block C7 and C8 is …
- trellis.
- dendritic.
- radial.
- rectangular.
1.14 The natural feature found at D in block G9, on the topographic map is a ...
- non-perennial river.
- dry water course.
- marsh and vlei.
- non-perennial water.
1.15 Crop farming is taking place at 8 on the orthophoto map. This type of farming is identified by its …
- dark tone.
- coarse texture.
- fine texture.
- smooth tone.
(15 x 1) (15) [15]
QUESTION 2: MAPWORK CALCULATIONS AND TECHNIQUES
2.1 FIGURE 2.1 represents an incomplete cross section between points 4 and 5 on the orthophoto map.
2.1.1 Complete the cross section.
2.1.2 Label the position of spot height 203. 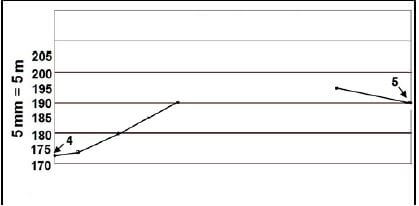 (2 x 1) (2)
2.1.3 Why is there no intervisibility between points 4 and 5 on the cross section? (1 x 1) (1)
2.1.4 Calculate the vertical exaggeration of the cross section.
Show ALL calculations. Marks will be awarded for calculations.
Formula: VE = Vertical scale (VS)
Horizontal scale (HS) (4 x 1) (4)
2.1.5 Provide ONE reason why the vertical scale in a cross section is exaggerated (made bigger). (1 x 1) (1)
2.2
2.2.1 Calculate the average gradient between the trigonometric station (block G5), to trigonometric station (block H2) on the topographic map. Show ALL calculations. Marks will be awarded for calculations.
Formula: Gradient = Vertical interval (VI)
Horizontal equivalent (HE) (4 x 1) (4)
2.2.2 With reference to the answer in QUESTION 2.2.1, is the gradient a true reflection of the actual landscape? Give a reason for your answer. (2 x 1) (2)
2.3
2.3.1 Refer to the demarcated area in RED on the topographic map, which represents the orthophoto map, and calculate its area in km².
Show ALL calculations. Marks will be awarded for calculations.
Formula: area = length (L) x breadth (B) (5 x 1) (5)
2.3.2 Explain why the area covered by the orthophoto on the topographic map looks smaller than the orthophoto itself. (1 x 1) (1)
[20]
SECTION C
QUESTION 3: APPLICATION AND INTERPRETATION
3.1 Refer to the climate graph below. 
[Source: https://en.climate-data.org/location/23402/]
3.1.1 Calculate the average monthly rainfall (mm) for Citrusdal. (1 x 1) (1)
3.1.2 State the type of climate that this type of rainfall is associated with. (1 x 1) (1)
3.1.3 Given the above rainfall data (graph) and Citrusdal’s location, suggest ONE reason why there are many non-perennial streams in the area. (1 x 1) (1)
3.2 Grade 12 learners on a field trip to Citrusdal, discovered that the temperature at 12:00 (midday), at the caravan park labelled A is a few degrees lower than the temperature near the industrial area labelled G, on the topographic map. Give reasons for the difference in temperature between the caravan park and the industrial area. (2 x 2) (4)
3.3 Provide TWO pieces of evidence to justify that the site of the Oliphant’s River valley, situated on the west side of the topographic map, is ideal for agriculture. (2 x 2) (4)
3.4 There are numerous dams in the agricultural region of the area covered by the topographic map. Of what importance are these dams to the farmers during the dry seasons? (1 x 2) (2)
3.5 Refer to the Oliphant’s River in block I2 on the topographic map.
3.5.1 Identify the stream channel pattern. (1 x 1) (1)
3.5.2 Provide evidence from the topographic map to support your answer to QUESTION 3.5.1. (2 x 2) (4)
3.6 Refer to the town of Citrusdal.
3.6.1 Is Citrusdal a recreation, mining or gap town? (1 x 1) (1)
3.6.2 Give evidence from the topographic map to support your answer. (1 x 2) (2)
3.6.3 Explain the economic advantage of Citrusdal’s’ location. (2 x 2) (4)
[25]
QUESTION 4: GEOGRAPHICAL INFORMATION SYSTEMS (GIS)
4.1 During the 2008 floods, accessibility to the Oliphant’s River Valley was limited to determine the extent of the damage. A GIS specialist used remote sensing to access flooded areas along the Oliphant’s River Valley.
4.1.1 Define the term remote sensing. (1 x 1) (1)
4.1.2 State TWO reasons as to why the GIS specialist chose remote sensing. (2 x 1) (2)
4.1.3 The GIS specialist also found that farming had a negative impact on the Oliphant’s River. He/she suggested that buffering should take place around the Oliphant’s River. Evaluate how this would prevent the mismanagement of the river. (2 x 2) (4)
4.2 Define the term spatial data. (1 x 1) (1)
4.3 Classify each of the following spatial objects in block E5, as a point, line or polygon (area).
- Non-perennial river / hiking trail:
- Spot height 1328:
- Dam / cultivated lands: (3 x 1) (3)
4.4 The diagram below illustrates the concept of data integration found in block A10 on the topographic map. Study the diagram and answer the questions below.
 |
[Source: Examiner’s sketch]
4.4.1 Define the term data integration. (1 x 1) (1)
4.4.2 Mention ONE problem that was experienced with data integration as shown in the diagram / figure, prior to the introduction of GIS. (1 x 1) (1)
4.4.3 State TWO ways, in which data integration could have assisted the farmer in making his farm at Kleinplaas, block E8, economically viable. (2 x 1) (2)
[15]
TOTAL: 75