GEOGRAPHY PAPER 2 GRADE 12 MEMORANDUM - PAST PAPERS 2017 JUNE
Share via Whatsapp Join our WhatsApp Group Join our Telegram GroupGEOGRAPHY PAPER 2
GRADE 12
NATIONAL SENIOR CERTIFICATE
MEMORANDUM
JUNE 2017
QUESTION 1: MULTIPLE-CHOICE QUESTIONS
The questions below are based on the 1:50 000 topographic map 2829AC HARRISMITH, as well as the orthophoto map of a part of the mapped area. Various options are provided as possible answers to the following questions. Choose the answer and write only the letter (A to D) in the block next to each question.
1.1 The topographic map sheet 2829 AC Harrismith shows part of …
C - Free State. ✓
1.2 According to the topographic map, which neighbouring town lies in the south- westerly direction of Harrismith?
C - Witsieshoek✓
1.3 The wind pump in block D4 on the topographic map lies at an altitude of … meters above sea-level.
D - 1640✓
1.4 The building labelled 1 on the orthophoto map is a …
A - hotel.✓
1.5 The country that lies south west of Harrismith is …
A - Lesotho.✓
1.6 In the urban hierarchy, Harrismith would be classified as a …
B - country town.✓
1.7 The orthophoto map of Harrismith is a … photograph with a map scale of 1 : 10 000.
A - vertical✓
1.8 The location (co-ordinates) of the spot height 1651 in block B1 is …
C - 28°16'44"S 29°00'15"E / 28°16.7’S 29°00.3’E.
1.9 On the orthophoto map, the Basuto Hill marked 2 lies in block … on the topographic map.
D - C7✓
1.10 The area marked 3 (WILGERPARK) on the orthophoto map is an example of a/an … residential area.
A - high-income✓
1.11 The map projection used on the Harrismith orthophoto map is a/an … projection.
C - Gauss conformal✓
1.12 The land use labelled 4 on the orthophoto map is mainly …
C - cultivation.✓
1.13 The Wilgerivier can be described as a/an … river.
B - permanent✓
1.14 The length of the dam wall in block G7 is … meters.
A - 150✓
1.15 WILGERPARK (block C7/8) residential area is dominated by a/an … street pattern.
B - planned irregular✓
(15 × 1)
[15]
QUESTION 2: MAPWORK CALCULATIONS AND TECHNIQUES
2.1 Use the linear scale to determine the distance in kilometres between the R74 road junction (block G4) and Witsieshek.
Answer: Map distance 6,4 km✓ + 28 km ✓ = 34,4 km ✓ (3 × 1) (3)
2.2
2.2.1 Draw a cross-section from points 5 and 6 on the orthophoto map. Use a vertical scale of 4 mm to represent 5 meters. Use the provided graph paper. Do not DETACH/REMOVE the graph paper from the answer sheet.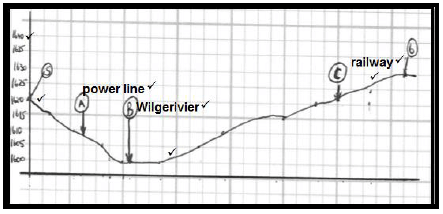
Correct vertical axis with appropriate values
Correct shape of the cross-section
(Refer to sketch for mark allocation) (4 × 1) (4)
2.2.2 On your cross-section, label the following:
- Power line
- Wilgerivier Refer to the sketch for the position and marks.
- Railway
Candidates may use letters to indicate the position of features i.e. (a), (b) and (c). (3 × 1) (3)
2.2.3 Write down the vertical scale as a ratio scale.
4 mm : 5 m
4 mm : 5 (1 000) mm
4 mm : 5 000 mm
1 : 1250 ✓
(1 × 1) (1)
2.2.4 The vertical exaggeration of the cross-section drawn in QUESTION 2.2.1 is 8 times. What does this answer mean?
This means that the vertical scale has been stretched / enlarged/made bigger 8 times more than the horizontal scale. (1 × 1) (1)
2.3 The scale of the topographic map is 1 : 50 000. Explain what this ratio scale means.
1 cm on the topographic map represents 50 000 cm on the actual ground. ✓ (Concept) (1 × 1) (1)
2.4 Calculate the magnetic bearing of spot height 1737 (block E2) from trigonometric station 3 (block E5) for 2017.
Show ALL your calculations. Marks will be awarded for calculations.
Formula: Magnetic Bearing =Mean Magnetic Declination + True Bearing
Difference in years: 2017 – 2001 = 16 years✓
Mean annual change : 8’W✓
Total annual change: 8’W × 16 years = (128’W or 2o 08’W) ✓
Magnetic declination for 2017 : 20o28’W (+✓) 128’ = 22o36’W✓
Therefore: Magnetic bearing of spot height 1737 from the trigonometric station 3 on the topographic map for 2017 is:
22o 36’W + 268o = 290o36’ (range 289o36’ – 291o36’) (7)
[20]
QUESTION 3: APPLICATION AND INTERPRETATION
3.1 Refer to the topographic map and answer the following questions:
3.1.1 Identify the drainage density found in block F1.
Low drainage density✓ (1 × 1) (1)
3.1.2 Describe TWO possible causes found in block F1 that lead to the formation of drainage density mentioned in QUESTION 3.1.1.
The slope is gentle (contour lines are far apart) causing more infiltration. ✓✓
Scarcity of rainfall (the river is non-perennial) ✓✓ (2 × 2) (4)
3.2 Locate the residential area at 7 on the orthophoto map.
3.2.1 Does the settlement represent a high or low income area?
Low income ✓ (1 × 1) (1)
3.2.2 Provide ONE reason to support your answer to QUESTION 3.2.1.
Plots are small ✓✓
Houses do not have an uniform geometry ✓✓
Buildings look the same ✓✓
Any ONE (1 × 2) (2)
3.3 Refer to the hospital at 8 on the orthophoto map.
3.3.1 In which land-use zone is the hospital found?
Rural urban fringe ✓ (1 × 1) (1)
3.2.2 Provide ONE orthophoto evidence to justify your answer to QUESTION 3.3.1.
Presence of cemetery ✓✓
Presence of recreation grounds✓✓
Any ONE (1 × 2) (2)
3.4 Use the orthophoto map as well as the topographic map to answer questions below.
3.4.1 Identify the dominant street pattern at Harrismith CBD.
Gridiron ✓ (1 × 1) (1)
3.4.2 Give ONE advantage and ONE disadvantage of the street pattern identified in QUESTION 3.4.1.
Advantage:
Easy to find way around (cannot get lost) ✓✓
And can be divided up easily ✓✓
Can be converted into one-way streets to ease traffic congestion ✓✓
Shorter distance to travel ✓✓
Little wastage of land ✓✓
Any ONE
Disadvantage:
Traffic congestion as traffic stops at every intersection✓✓
More accidents because of intersections✓✓
Monotonous (boring) layout✓✓
Any ONE (2 × 2) (4)
3.5 Find the industrial area marked 9 on the orthophoto map.
3.5.1 Classify the industrial area as heavy or light industry.
Heavy industrial area ✓ (1 × 1) (1)
3.5.2 With reference to orthophoto and topographic map evidence, comment on the suitability of the location of the industry referred to in QUESTION 3.5.1.
Located on the outskirts of the town✓✓
Near the rail and road network for transporting bulky raw materials and finished products. ✓✓
Located on relatively flat land✓✓
Near power lines for power supply✓✓
Near the Wilgerivier for water supply✓✓
Any TWO (2 × 2) (4)
3.6 Refer to block D/E6 on the topographic map.
3.6.1 Identify the fluvial landform feature labelled A.
Oxbow lake ✓ (1 × 1) (1)
3.6.2 Identify the stage in which Nuwejaarspruit is (block D/E 6).
Lower course ✓ (1 × 1) (1)
3.6.3 Suggest ONE map evidence to answer to QUESTION 3.6.2.
A lot of meanders✓
Oxbow lake has developed✓
Development of marshes and vleie✓
Wide flood plain✓
River flows on gentle/flat slope✓
Any ONE (1 × 1) (1)
3.7 Refer to block H1 on the topographic map.
Identify the human-made feature, which is used to regulate (control) the flow of water of Nuwejaarspruit.
Weir ✓ (1 × 1) (1)
[25]
QUESTION 4: GEOGRAPHICAL INFORMATION SYSTEMS (GIS)
4.1 Data in GIS can be gathered from a number of sources. Differentiate between the following data sources used in GIS.
4.1.1 Primary data:
Data that is collected directly through observations, fieldwork, surveys measurements etc. ✓
(Concept) (1 × 1) (1)
4.1.2 Secondary data:
Data that is collected obtained from existing sources captured or supplied by another source. For example, maps, books, magazines etc. ✓
(Concept) (1 × 1) (1)
4.2 Is the topographic map of Harrismith a vector or raster map?
Vector ✓ (1 × 1) (1)
4.3 Justify your answer to QUESTION 4.2.
The map is made up of lines, points and polygons. ✓✓ (1 × 2) (2)
4.4 Explain why the orthophoto map of Harrismith has a high spatial resolution.
The orthophoto map shows more detail. ✓✓
The orthophoto map has a higher degree of clarity of images. ✓✓
The orthophoto map has a large scale and therefore more detail and better resolution. ✓✓
Any ONE (1 × 2) (2)
4.5 Refer to block H9 and answer the following questions:
4.5.1 Suggest THREE data layers that the farmer considered before establishing his farm in this specific area (block H9).
Drainage layer✓
Relief/topography layer✓
Infrastructure layer✓
Geology layer✓
Any THREE (3 × 1) (3)
4.5.2 Provide a reason for the choice of ONE layer made in QUESTION 4.5.1.
Drainage layer: water supply for domestic and irrigation purposes✓✓
Relief/topography layer : suitable slope for building and ploughing/cultivation✓✓
Infrastructure/transport layer: transportation of farm inputs and outputs to the nearby markets (Harrismith for example). ✓✓
Geology layer : suitable soil for cultivation and fertility✓✓
Any ONE (1 × 2) (2)
4.6 Name and explain the GIS process that the farmer used to decide on the location of his farm (block H9).
4.6.1 GIS process:
Data layering/Thematic layering/Layering/Overlaying (1 × 1) (1)
4.6.2 Explanation:
The process whereby different types of information are projected on one another/placed on top of one another for the purpose of decision making ✓✓
(Concept) (1 × 2) (2)
[15]
TOTAL: 75