GRADE 12 MATHEMATICAL LITERACY PAPER 1 QUESTIONS - NSC PAST PAPERS AND MEMOS SEPTEMBER 2017
Share via Whatsapp Join our WhatsApp Group Join our Telegram GroupGRADE 12 MATHEMATICAL LITERACY
PAPER 1
NSC PAST PAPERS AND MEMOS
SEPTEMBER 2017
INSTRUCTIONS AND INFORMATION
- This question paper consists of FIVE questions. Answer ALL the questions.
-
- 2.1 Use the ANNEXURES in the ADDENDUM to answer the following questions:
ANNEXURE A for QUESTION 1.4
ANNEXURE B for QUESTION 4.1
ANNEXURE C for QUESTION 4.2
ANNEXURE D for QUESTION 5.3 - 2.2 ANSWER SHEET for QUESTION 5.3.3.
Write your GRADE and NAMES in the spaces provided on the ANSWER SHEET. Hand in the ANSWER SHEET with your ANSWER BOOK.
- 2.1 Use the ANNEXURES in the ADDENDUM to answer the following questions:
- Number the answers correctly according to the numbering system used in this question paper.
- Start EACH question on a NEW page.
- You may use an approved calculator (non-programmable and non-graphical), unless stated otherwise.
- Show ALL calculations clearly.
- Round off ALL final answers appropriately according to the given context, unless stated otherwise.
- Indicate units of measurement, where applicable.
- Maps and diagrams are NOT necessarily drawn to scale, unless stated otherwise. 10. Write neatly and legibly.
QUESTIONS
QUESTION 1
1.1
Ben buys a bicycle on lay-bye for R3 200. |
1.1.1 Express the deposit as a percentage of the purchase price. (2)
1.1.2 Determine the balance, after the deposit has been paid. (2)
1.1.3 Determine the total amount paid after the deposit and five instalments has been paid. (2)
1.2
| Karen bought 50 Kwh of electricity from her municipality in June 2017 when the tariff was 0,8865 R/Kwh (Rand per kilo-watt hour), including VAT. |
1.2.1 Calculate the rate (in cents) for the tariffs charged for the 50 Kwh of electricity. (2)
1.2.2 Calculate the total amount charged for the 50 Kwh of electricity. (2)
1.2.3 Write the abbreviation VAT out in full. (2)
1.3
| A care-taker at a school is paid at the rate of R26 per hour worked. He works from 7:30 am for 7 hours, excluding a 15-minute tea break and 45-minute lunch break. He does not work during weekends. |
1.3.1 Determine the time when he goes off duty. (2)
1.3.2 Calculate his income if he worked for four weeks. (2)
1.4
| The distances between the cities in South Africa are shown in ANNEXURE A. Use it to answer the following questions. |
1.4.1 Write down the distance between Mafikeng and Port Elizabeth. (2)
1.4.2 Name TWO cities that are equal distance from Kimberley. (2)
1.4.3 Which two cities are furthest apart? (2)
1.5 A research was carried out among some parents of Zozo High School to indicate the percentage of their income they saved in June 2017. The results are shown on the graph below.
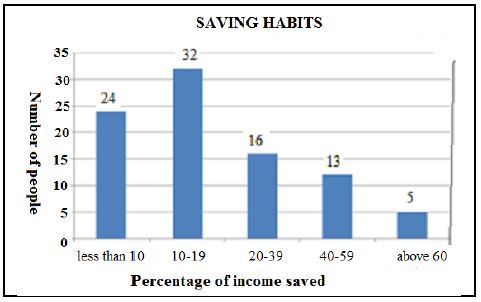 |
1.5.1 Determine the number of people that took part in the survey. (2)
1.5.2 Calculate the number of people who saved less than 20% of their income. (2)
1.5.3 What was the modal range? (2)
1.5.4 Write down the type of graph used to display the information. (2)
[30]
QUESTION 2
2.1 In South Africa many families solely depend on social grants to sustain their livelihood. Nobuzwe, a 78-year-old grandmother lives with her four grandchildren and takes care of them. Study the information in TABLE 1 below on social grants and answer the questions that follow.
| TABLE 1: MONTHLY SOCIAL GRANTS FOR FINANCIAL YEARS 2015/2016 AND 2016/2017 PER INDIVIDUAL | ||||||||||||||||||||||||
[Adapted from People’s guide to the budget] |
2.1.1 Identify the social grant that increased the least over the two financial years. (2)
2.1.2 Two of her four grandchildren received a child support grant.
Calculate the total amount of social grant Nobuzwe and the two grandchildren receive monthly for the 2016/2017 financial year. (3)
2.1.3 The War Veterans’ social grant was increased by 6,27% at the end of the 2015/2016 financial year. Calculate the monthly amount after the increase to the nearest rand. (3)
2.2 Ludwe, Nobuzwe’s son bought tyres for his expensive car from Lee Tyre and Exhaust centre in Cape Town. Study the information on the invoice below and answer the questions that follow.
Lee Tyre and Exhaust Centre: Tax Invoice R – Rands VAT – Value Added Tax | |||
Item detail | Price excluding VAT: (R) | Quantity | Net Value (R) |
813750 FS TZ Firehawk tyres | 1 155,26 | 4.000 | A |
BBO Wheel balance (Standard) | 28,95 | 4.000 | 115,80 |
WWA 1 Wheel alignment | 192,98 | 1.000 | 192,98 |
Sub-total | 4 929,82 | ||
VAT | 690,18 | ||
Grand total | 5 620,00 | ||
Change | 0,00 | ||
2.2.1 Calculate the value of A, the Net value of Firehawk tyres. (2)
2.2.2 Write down the amount Ludwe received as change. (2)
2.2.3 In August ONLY the tyres were discounted by 5,6%. Calculate how much Ludwe would have paid for the tyres, including VAT. (4)
2.3 Sasol has exploration, development, production, marketing and sales operations in 36 countries around the world. Study the revenue contributions and the total capital investments by region shown in TABLE 2 below and answer the questions that follow.
| TABLE 2: |
[www.sasoltechnox.co.za] |
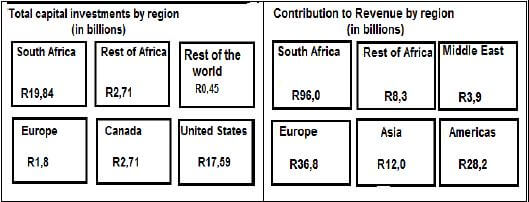
2.3.1 Write down the amount contributed to Revenue by the Rest of Africa. (2)
2.3.2 Calculate the total capital investments by Sasol in all regions. (2)
2.3.3 Convert the total capital investment in Europe into Euros. Given that 1 Euro = R15,3728 (2)
2.3.4 Calculate the difference in contribution to revenue between South Africa and Europe. (3)
2.3.5 Express the capital investment in the United States as a percentage of the total capital investments. (3)
2.3.6 Write down Europe’s capital investments, to that of Europe’s revenue contribution in the simplest ratio. Give your answer in the form: 1 : … (3)
2.4 Lerato High School had a memorial service for Anako, one of Nobuzwe grandchildren that was in Grade 10. Study the quotation from TABLE 3 below and answer the questions that follow.
TABLE 3: QUOTATION FOR PRINTING COSTS FROM THE STATIONERY SHOP PER COPY
A3 | A4 | |||||||
Copies | Black and White | Colour | Black and White | Colour | ||||
Quantity | S/S | D/S | S/S | D/S | S/S | D/S | S/S | D/S |
1–250 | R3,50 | R4,00 | R10,00 R12,00 | R1,50 | R2,00 | R5,00 | R6,00 | |
251–500 | R3,00 | R3,50 | R9,50 | R11,50 | R1,00 | R1,50 | R4,50 | R5,50 |
501–1 000 | R2,80 | R3,00 | R9,00 | R11,00 | R0,85 | R1,05 | R4,00 | R5,00 |
1 000+ | R2,50 | R2,70 | R8,50 | R10,50 | R0,75 | R0,95 | R3,00 | R4,50 |
S/S – Single sided D/S – Double sided
2.4.1 The school will display TWENTY FOUR A3 single sided colour advertisements in the community and ONE A3 single sided colour advertisement outside the hall. Calculate the total amount the school will pay for these copies. (2)
2.4.2 The school will print 260 double sided black and white A4 programmes for the service. Calculate the total cost for the programs. (2)
2.4.3 Write down the amount charged per copy if you copy 520 A3 double sided colour copies. (2)
2.5
| The prices of 1 kg of corn flakes was R52,95 in June 2016 and R55,95 in June 2017. |
2.5.1 The price changes shown above are as a result of inflation. Explain the term inflation from the above context. (2)
2.5.2 Calculate the inflation rate used for the price changes on the cornflakes. Give your answer to the nearest percentage.
You may use the formula:
Inflation rate =New price – Old price x 100 (3)
Old price
[42]
QUESTION 3
3.1 Excessive sugar intake is a health hazard. Study the information about the amount of sugar in the chosen items mentioned in the TABLE 4 below and answer the questions that follow.
TABLE 4: AMOUNT OF SUGAR IN DIFFERENT CHOSEN ITEMS
Item | Amount of sugar (in grams) (g) | Capacity of an item |
Sports drink | 28 | 500 mℓ |
Flavoured water | 20 | 500 mℓ |
Medium muffin | 10,6 | 65 g |
Sweetened fizzy drink | 55 | 500 mℓ |
Vitamin water | 27,5 | 500 mℓ |
Chocolate bar | 41,2 | 80 g |
1 tablespoon tomato sauce | 7,4 | … |
Ice tea | 28 | 330 mℓ |
[Source: Discovery Vitality Kids report 2014 illustrations, Sock]
NOTE: 1 teaspoon = 4,18 g 1 cup = 250 mℓ
3.1.1 Rose drinks a can of ice tea and eats two medium muffins for breakfast, one chocolate bar at break and one sports drink after running in the afternoon. Calculate Rose’s total amount of sugar intake. (3)
3.1.2 Determine the number of teaspoons of sugar in the vitamin water drink. Give your answer to the nearest teaspoon. (3)
3.1.3 Calculate the number of cups you will get when you buy 50 bottles of sports drink for your school teams. (2)
3.2 The box shown below is used to pack 80 rectangular chocolate bars. The measurements of the box are: length = 28 cm, width =15 cm and height = 8 cm. 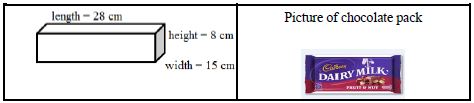
3.2.1 Calculate the volume of the box.
You may use the formula.
Volume = length ×width× height. (2)
3.2.2 Determine the thickness of a chocolate if the area of its base is 35 cm2.
You may use the formula:
Volume = area of base × thickness (4)
3.3 The table Lindi uses for functions in a tent has a diameter of 130 cm. The circular tablecloth used on the table overhangs 25 cm, all round. To make the tablecloth she has to add 1,8 cm right around for the hem. The tablecloth material measures 2,3 m wide and 2,3 m in length. 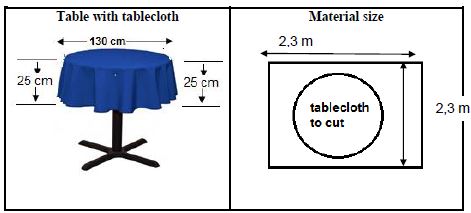
3.3.1 Calculate the diameter of the tablecloth to be cut from the material, including the additional centimetres for the hem. (2)
3.3.2 Calculate the area (in m2) of the tablecloth material.
You may use the formula:
Area = Length x Breadth (2)
3.3.3 Calculate the area (in m2) of a tablecloth to be cut by Lindi.
You may use the formula:
Area = π (radius)2, where π = 3,142 (3)
3.3.4 Calculate the amount of material wasted when cutting the table cloth.
You may use the formula:
Wasted material = Area of a material – Area of tablecloth to be cut (2)
[23]
QUESTION 4
4.1
Study the map on ANNEXURE B that shows the sample points for testing Escherichia coli (E. coli) and Blue Green Algae counts per 100 mℓ. |
4.1.1 Write down the total number of bridges found upstream (north east) of the R59 bridge. (2)
4.1.2 Name the SIXTH sample point on the map starting from the west side. (2)
4.1.3 Lindi travelled by boat from Ascot Bridge to Vaalview Aquatic Club. Name the side streams (tributaries) to the Vaal River that she will pass. (2)
4.1.4 The distance between the R59 Bridge and Railway Bridge is 3 km. Calculate the distance on another map if the scale is 1: 25 000. (3)
4.2 Study ANNEXURE C showing the diagrams and corresponding letters, A; B; C and D provided in order to assemble the cot and finally form a junior bed.
4.2.1
- Write down the number of holes in the end panels. (2)
- Name the wooden parts that must be removed, to form the junior bed. (2)
- Which assembly illustration shows that the base is now added? (2)
4.2.2 Calculate the number of pins and bolts needed to assemble the cot. (2)
4.2.3 Determine the probability of randomly selecting an 80 mm bolt from a bag containing only the bolts. Give your answer as a simplified common fraction. (3)
[20]
QUESTION 5
5.1 TABLE 5 below shows the number of learners who were condoned to Grade 12 (made to progress to Grade 12). Study the table and answer the questions that follow.
TABLE 5: PROGRESSED LEARNERS
Province | Total number of progressed learners who | ||
wrote matric in 2015 | passed matric in 2015 | currently is in matric in 2016 | |
Eastern Cape | 11 705 | 2 625 | 18 255 |
Free State | 5 105 | 2 600 | 7 362 |
Gauteng | 4 568 | 2 149 | N/A |
KwaZulu-Natal | 10 070 | 4 765 | 24 549 |
Limpopo | 13 022 | 3 492 | 27 523 |
Mpumalanga | 5 091 | 2 290 | 11 160 |
Northern Cape | 1 963 | 613 | 2 280 |
North West | 3 543 | 2 122 | 6 654 |
Western Cape | 3 589 | 1 404 | 3 058 |
TOTAL | A | 22 060 | … |
5.1.1 List the provinces with the number of progressed learners less than 5 000 in 2016. (2)
5.1.2 Calculate the value of A in the table. (2)
5.1.3 Arrange the number of progressed learners who passed matric in 2015 in ascending order. (2)
5.1.4 Determine the median of progressed learners who passed matric in 2015. (2)
5.1.5 Calculate the difference between the progressed learners who passed Grade 12 in 2015 from the Eastern Cape and Western Cape. (3)
5.1.6 Calculate the mean number of the progressed learners who wrote matric in 2015. Give your answer to the nearest whole number. (3)
5.1.7 Identify the province with the highest number of progressed learners in 2016. (2)
5.2 Label the box and whisker diagram by matching the terms below with the letter indicated on the diagram.
| Mean; Median; Mode; Minimum; Lower Quartile; Upper Quartile; Maximum; Range |
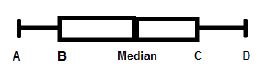
ONLY write down the letter and the correct term. (4)
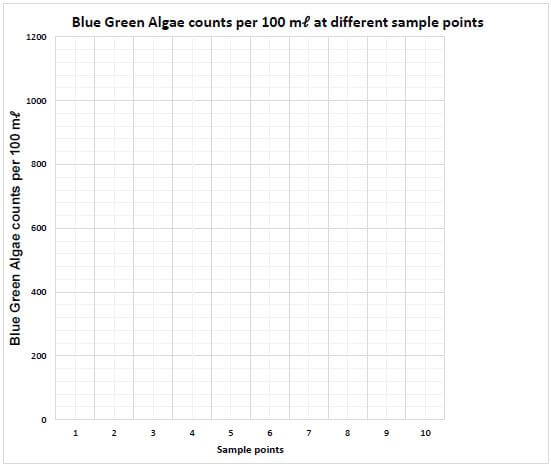
5.3 Study TABLE 6 in ANNEXURE D that shows the sample points for testing Escherichia coli (E. coli) and Blue Green Algae counts per 100 mℓ to answer the questions that follow.
5.3.1 Identify the number(s) of sample points with the same values readings for the Blue Green Algae. (2)
5.3.2 At sample point 8, the readings were 291 for E. coli counts per 100 mℓ. Write down the guideline on such readings. (2)
5.3.3 Sketch the line graph showing the readings for Blue Green Algae counts per 100 mℓ at all sample points. Use the ANSWER SHEET to draw the graph. (6)
5.4 Ludwe tossed a coin twice and recorded all the possible outcomes as displayed in the tree diagram below:
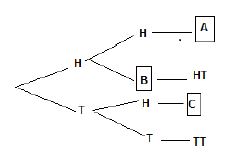
5.4.1 Write down the possible outcomes represented by the letters A, B and C. (3)
5.4.2 Determine the probability of getting two heads when the coin is tossed two times. (2)
[35]
TOTAL: 150
ANSWER SHEET
GRADE 12
NAME OF LEARNER:
QUESTION 5.3.3