ECONOMICS PAPER 2 GRADE 12 MEMORANDUM - PAST PAPERS 2017 JUNE
Share via Whatsapp Join our WhatsApp Group Join our Telegram GroupECONOMICS PAPER 2
GRADE 12
NATIONAL SENIOR CERTIFICATE
MEMORANDUM
JUNE 2017
SECTION A (COMPULSORY)
QUESTION 1 30 MARKS – 20 MINUTES
1.1
1.1.1 B
MC curve above AVC. ✓✓
1.1.2 C
increases by the same amount. ✓✓
1.1.3 D
private costs. ✓✓
1.1.4 A
The car industry ✓✓
1.1.5 C
Entry to the market is free. ✓✓
1.1.6 A
market ✓✓
1.1.7 B
normal ✓✓
1.1.8 D
training schemes ✓✓ (8 × 2)
(16)
1.2
1.2.1 C ✓
individuals still benefit from a good even if they do not pay for it
1.2.2 F ✓
accepts or reject investigations and recommendations
1.2.3 A ✓
consumers like the choice that result from product proliferation
1.2.4 B ✓
two firms dominate the market
1.2.5 H ✓
all costs are variable
1.2.6 D ✓
cannot be recovered should the firm leave the market
1.2.7 I ✓
the product mix does not reflect consumer’s tastes
1.2.8 E ✓
factors of production are completely mobile (8 x 1)
(8)
1.3
1.3.1 Price discrimination ✓
1.3.2 Price taker ✓
1.3.3 Industry ✓
1.3.4 Positive externality ✓
1.3.5 Price leadership ✓
1.3.6 Inelastic demand ✓ (6 × 1) (6)
TOTAL SECTION A: 30
SECTION B
QUESTION 2 40 MARKS – 30 MINUTES
2.1
2.1.1 List any TWO aims of the competition policy in South Africa.
- Prevent abuse of economic power ✓
- Regulate the growth of market power ✓
- Prevent restrictive practices especially by oligopolies ✓
- Accept any correct relevant aim (Any 2 × 1) (2)
2.1.2 Why is the short run economic profit of a monopolistically competitive firm not sustainable in the long run?
New firm will enter the market because of freedom of entry, ✓ the supply will increase and the equilibrium price will fall until all the firms are making normal profit in the long run. ✓(2)
2.2 Study the graph below and answer the questions that follow.
2.2.1 How is profit calculated?
TR-TC ✓ (1)
2.2.2 Which profit does the firm earn at point B?
Normal profit ✓ (1)
2.2.3 Why is the TR curve starting at zero?
Total revenue starts at zero because if there is no production there is no revenue earned. ✓✓ (2)
2.2.4 When is profit maximised in the graph above?
Profit is maximised when the gap between TR and TC is the greatest / where area A is the greatest✓✓ (2)
2.2.5 What are the implications of producing beyond point B?
Beyond point B total costs are more than total revenue, ✓✓ producing beyond this point the firm will suffer a loss. ✓✓(4)
2.3 Study the information below and answer the questions that follow.
2.3.1 Give names of TWO banks from those above.
- First National bank ✓
- Capitec bank ✓
- Standard bank ✓
- ABSA bank ✓
- Nedbank ✓ (Any 2 × 1) (2)
2.3.2 Explain any TWO characteristics that makes a banking sector an oligopoly.
- The market is dominated by few large businesses✓✓
- Banks are interdependent✓✓
- There is an element of collusion amongst banks✓✓
- They offer differentiated services✓✓
Accept any correct relevant response (Any 2 × 2) (4)
2.3.3 How do banks use non-price competition to make their products or services more price inelastic?
- Extensive use of advertising to provide information, remind consumers and to persuade the consumers to use their services ✓✓
- Offers such as bonus points for use of certain bank cards ✓✓
- Online banking services ✓✓
- Extended business hours ✓✓
Accept any other correct response (Any 2 × 2) (4)
2.4 Explain immobility of factors of production as a reason for market failure.
- Labour takes time to move from one area to another.✓✓
- The supply of skilled labour cannot be increased because of the time it takes to be trained or educated.✓✓
- Physical capital, like factory buildings or infrastructure such a telephone lines cannot be reallocated easily.✓✓ They cannot be moved to fit a change in demand✓✓
- Structural changes like a change from producing plastic packets to paper packets or shifting from labour-intensive production to computer based production requires a change in labourers’ skills, employment and work patterns. ✓✓ This takes time to change.
- Technology used in production may change but it takes time for industries to adapt. ✓✓(Any 4 × 2) (8)
2.5 With the aid of a graph, explain the long run equilibrium of the individual producer in a perfect market. 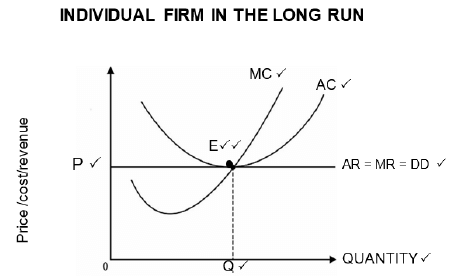 (8)
(8)
[40]
QUESTION 3 40 MARKS – 30 MINUTES
3.1
3.1.1 Name TWO elements of a hybrid structure of monopolistic competition.
- Perfect competition ✓
- Monopoly ✓(2)
3.1.2 How will output be affected when a loss is made in a perfect market?
Output will decrease as more firms would leave the market. ✓✓(2)
3.2 Study the table below answer the questions that follow.
3.2.1 In which run are the two firms operating?
Short run ✓ (1)
3.2.2 Give an example of a fixed cost.
Rent ✓
Accept any correct example (1)
3.2.3 With reasons, identify a firm that will shut down.
- Firm B will shut down ✓✓
- Variable costs are greater than the total revenue ✓✓ (2 × 2) (4)
3.2.4 What, do you think, are the implications of a shutdown?
- A firm stop production for a certain period - is usually temporary✓✓
- It does not mean that a firm is going out of business. ✓✓
- It still retains capital assets, but cannot avoid paying its fixed costs. ✓✓
Accept any relevant explanation (Any 2 × 2) (4)
3.3 Study the information below and answer the questions that follow.
3.3.1 Identify TWO negative effects of sugar intake from the information above.
- Unhealthy weight gain ✓
- Diabetes ✓
- Tooth decay ✓ (Any 2 × 1) (2)
3.3.2 What effect will sugar tax have on the prices of sugary drinks?
The prices of sugary drinks will increase. ✓✓(2 × 1) (2)
3.3.3 What do you understand by demerit goods?
- Demerit goods are goods that are harmful to the community. ✓✓
- These goods are usually over-consumed and have negative externalities. ✓ (2 × 1) (2)
3.3.4 How, do you think, will sugar tax affect the economy?
- It will raise revenue for the government. ✓✓
- Firms will sell healthier drinks thereby improving health to the society. ✓✓
- It may lead to job losses. ✓✓
Accept any relevant correct argument (Any 2 × 2) (4)
3.4 Distinguish between artificial and natural monopoly.
Natural monopolies
- High development costs prevent others from entering the market and therefore the government supplies the product. ✓✓
- E.g. Electricity in South Africa is provided by the government enterprise, Eskom. ✓
- It costs billions of rands to build and maintain power stations and therefore there are no other suppliers. ✓✓
- A single business (Eskom) can serve the whole market at a lower price than two or more businesses together. ✓✓
- Such a business is frequently owned or regulated by the government. ✓✓ (Any 2 × 2) (4)
Artificial monopolies:
- Here the barriers to entry are not economic in nature. ✓✓
- An example of a barrier is a patent.✓
- A patent is a legal and exclusive right to manufacture a product,✓✓e.g. Denel Land Systems manufacturing Casspirs.
- Licensing is another way in which an artificial monopoly is applied.✓✓
- In South Africa licenses are required for radios, TV broadcasters, etc. ✓✓
- Licenses protects operators against entry of competitors.✓✓
(Any 2 × 2) (4) (8)
3.5 Why do governments produce certain goods and services themselves?
- The good or service is highly desirable for the general welfare of the country✓✓ and are not highly rated by the market✓✓
- There is high capital needed to supply the goods which the markets may not have✓✓
- The markets will not generate profit in supplying them✓✓
- If the supply of these goods is left in the hands of the markets there will be under consumption✓✓
- For example, if health care was left in the hands of the markets most people would not afford it and there will be high death rates✓✓
Accept any relevant correct explanation. (Any 4 × 2) (8)
[40]
QUESTION 4 40 MARKS – 30 MINUTES
4.1
4.1.1 List any TWO characteristics of public goods.
- Non-rivalry in consumption ✓
- Non-excludability ✓
- Social benefit outstrips private benefit ✓
- Non-rejectability ✓
- Continuous consumption ✓(Any 2 × 1) (2)
4.1.2 How is a lack of information a reason for market failure?
Lack of information leads to wrong decision making. ✓✓
Accept any correct relevant explanation. (Any 1 × 2) (2)
4.2 Study the graphs below and answer the questions that follow:
4.2.1 Which market structure do the graphs above represent?
Imperfect market / Monopoly ✓ (1)
4.2.2 Provide a suitable label for curve A.
MR or Marginal revenue ✓ (1)
4.2.3 Why is the demand curve equal to the average revenue curve?
- The average revenue from each product is calculated by dividing the total revenue by the quantity, which is equal to price / AR = P ✓✓
- The demand curve shows quantity and price relations, which are therefore the same as quantity and average revenue relations. ✓✓
- Since P = AR, therefore the demand curve and average revenue curves are the same. ✓✓(Any 2 × 2) (4)
4.2.4 Using the information in the graphs, explain how the firm determines the price.
- The firm fixes the price above the centre of the demand curve/AR curve ✓✓
- It is at this point that the total revenue increases ✓✓
- At P2 , TR decreases at Q2, it is at P1 that the total revenue is at its highest at Q1 ✓✓
- P1 is the market price ✓✓ (Any 2 × 2) (4)
4.3 Study the bar chart below and answer the questions that follow.
4.3.1 What is the economic cost of project B?
R20 000 m ✓ (1)
4.3.2 Give an example of a social benefit of contracting a tarred road.
- Fewer accidents ✓
- Less time taken to reach destination ✓
Accept any relevant example (Any 1 × 1) (1)
4.3.3 Briefly explain cost benefit analysis.
A technique for enumerating and evaluating the total social costs and total social benefits associated with an economic project. ✓✓ (2)
4.3.4 What is the purposes of doing cost benefit analysis?
- To assess whether a new project will be feasible ✓✓
- To make objective decisions✓✓
- To ensure a more equitable distribution of resources ✓
Accept any other correct relevant response (Any 1 × 2) (2)
4.3.5 Use the formula
CBR = Present value of economic benefits ÷ Present value of economic costs to calculate the cost benefit ratio for project C.
CBR = Present value of economic benefits ÷ Present value of economic costs
= 28 000 ✓
30 000 ✓
= 0,933 ✓✓ (4)
4.4 Explain product differentiation in monopolistic competition.
Product differentiation has three dimensions
- Products are not identical but are similar in many ways. ✓✓
- The similarity between products lies in the fact that they satisfy the same consumer need.✓✓ e.g. toothpaste. ✓
- Differences may be imaginary as it is merely the service of the seller that differentiates its products from that of someone else, ✓✓ e.g. medicine that contain the same basic ingredients. ✓
- The packaging of a product may make it different from other similar products,✓✓ e.g. salt. ✓ (4 × 2) (8)
4.5 How does a cartel negatively affect businesses and consumers?
Businesses
- When companies form cartels, market dominance is achieved and often maintained for lengthy periods✓✓ e.g. OPEC ✓ resulting in the smaller businessman being eliminated. ✓✓ / Some firms exit the market. ✓✓
- Entrance into the market by new role players is more difficult because of the monopoly held by the cartel. ✓✓ / The cartel becomes a barrier to entry to the market. ✓✓
Accept any relevant correct explanation (Any 2 × 2) (4)
Consumers
- Consumers do not have access to and cannot freely select the quality and variety of goods and services they desire. ✓✓
- Local communities have to pay more for products and services because the price is artificially manipulated. ✓
- The fixing of a price of a product causes prejudice or harm to broader society and sadly, it is most often the poorest of the poor who suffer most. ✓
Accept any relevant correct explanation (Any 2 × 2) (4) (8)
[40]
TOTAL SECTION B: 80
SECTION C
Answer any ONE of the two questions from this section in the ANSWER BOOK.
Your answer will be assessed as follows:
| STRUCTURE OF THE ESSAY | MARK ALLOCATION |
Introduction
| Max. 2 |
| Body Main part: Discuss in detail / In-depth discussion / Examine / Critically discuss / Analyse / Compare / Evaluate / Distinguish / Explain / Assess / Debate Additional part: Give own opinion / Critically discuss / Evaluate / Critically evaluate / Draw a graph and explain / Use the graph given and explain / Complete the given graph / Calculate / Deduce / Compare / Explain / Distinguish / Interpret / Briefly debate | Max. 26 |
| Max. 10 | |
Conclusion
| Max. 2 |
| TOTAL | 40 |
QUESTION 5 40 MARKS – 40 MINUTES
‘Markets are broadly categorised into perfect and imperfect markets.’
- Compare and contrast in detail the perfect competition and monopoly in terms of the following:
- number of businesses
- nature of the product
- demand curves
- output and price (26)
- With the aid of a fully labelled graph explain the long run equilibrium position of a monopolist. (10)
INTRODUCTION
A market is a circumstance where buyers and sellers meet to determine exchange of goods and services.✓✓
A market structure (2)
BODY
| Criterion | Perfect competition | Monopoly |
| Number of businesses | Large number of sellers ✓✓ Close examples JSE, agricultural products ✓ | One business, ✓✓ e.g. Eskom ✓ |
| Nature of the product | Products are homogeneous, that is they are exactly the same regarding quality, appearance, etc. ✓✓ It makes no difference where or from whom he or she buys the product ✓✓ | Unique product without any close substitutes ✓✓ |
| Demand curves | The demand curve of a perfect competitor is horizontal✓✓ | Downward sloping demand curve ✓✓ Negative sloping demand curve ✓✓ |
| Output and price | Produces high output and demands low price ✓✓ Production occurs at the minimum point of the long term average cost curve ✓✓ | Produces less and demands a high price ✓✓ Production does not occur at the minimum point of the long term average cost curve ✓✓ |
(Maximum 13 marks for each market structure) (13 × 2)
(26)
ADDITIONAL PART
With the aid of a fully labelled graph explain the long run equilibrium position of a monopolist. 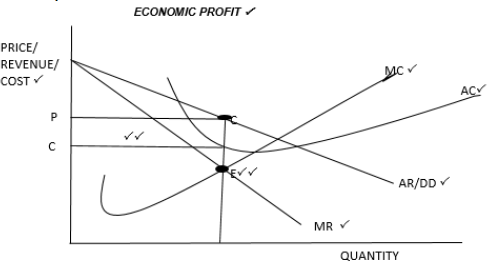 (10)
(10)
CONCLUSION
There is a general belief that a community’s welfare can be improved by a shift from a state of pure monopoly to one of perfect competition. ✓✓
Accept any relevant conclusion (2)
[40]
QUESTION 6 40 MARKS – 40 MINUTES
‘Reliance on markets is not always a best decision.’
- With the aid of graphs, discuss in detail state intervention as a consequence of market failures, under the following headings:
- minimum wages
- maximum prices (26)
- How successful is the South African government in solving income inequality? (10)
INTRODUCTION
Market failure occurs when the forces of demand and supply do not ensure the correct quantity of goods and services are produced to meet demand at the right time.✓✓
Accept any relevant introduction (2)
BODY
Minimum wages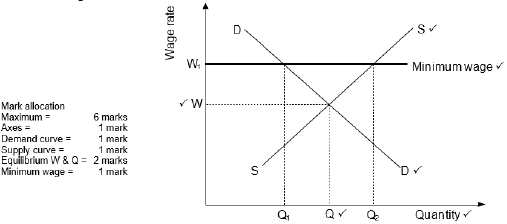
- When the government enforces a minimum wage, it means workers have to be paid a certain wage amount and not anything less than this. ✓✓
- The graph above shows that if the wage rate is set at W, the corresponding demand and supply of labour will be Q. ✓✓
- If a minimum wage of W1 is set, the demand for labour will decrease from Q to Q1. ✓✓
- Some people may become unemployed due to the introduction of a minimum wage. ✓✓
- However, the quantity of labour supplied will increase from Q to Q2 ✓✓
- More people will offer their labour because of the higher wage. ✓✓ (Max 13)
Setting maximum prices/price ceilings
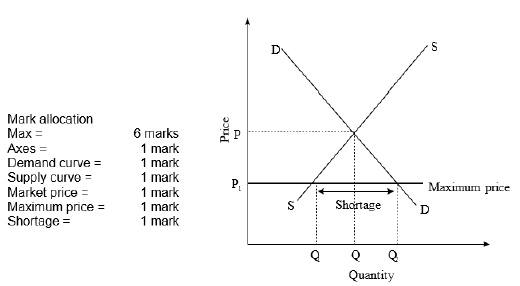
- The government sets a maximum price ceiling below the market price to make goods more affordable.✓✓
- Maximum prices allow the poor greater access to certain goods and services. ✓✓
- A maximum price is set on goods such as basic foods, housing and transport. ✓✓
- In South Africa the price of petrol, diesel fuel and paraffin are controlled at their maximum prices. ✓✓

- Initially the market equilibrium price is P and equilibrium quantity is Q. ✓✓
- The government intervenes and passes a law that a product cannot be sold for more than P1. ✓✓
- The effect of this maximum price is that quantity supplied decreases to Q1 and quantity demanded increases to Q2. ✓✓
- There is a shortage equal to the difference between Q1 and Q2. ✓✓
- A shortage creates a problem of how to allocate the product to consumers. ✓✓
- Black markets often develop where people can obtain the product. A black market is an illegal market in which either illegal goods are bought and sold or illegal prices are charged. ✓✓
- Maximum prices may cause a shortage of goods but they do improve the welfare of some consumers since goods can be purchased at lower prices. ✓✓ (Max 13)
(26)
ADDITIONAL PART
How successful is the South African government in solving income inequality?
The South African government has been successful in the following:
- Transferring income directly to the poor✓✓ e.g. child support grants, unemployment benefits etc. ✓
- Implementing a progressive system of taxation, which reduces the gap between high and low income earners ✓✓
- Providing free primary health care in provincials hospitals and clinics✓✓
- Offering free basic education to those who cannot afford to pay-✓✓ no fee schools. ✓
- Excluding VAT in basic items that the poor often consumes✓✓ e.g. maize✓
Accept any relevant correct argument. (5 × 2) (10)
CONCLUSION
It is important for the government to intervene, when markets fail, for the benefit of the society.✓✓
Accept any relevant conclusion. (2)
[40]
TOTAL SECTION C: 40
GRAND TOTAL: 150