GRADE 12 MATHEMATICAL LITERACY PAPER 1 QUESTIONS - PAST PAPERS 2017 JUNE
Share via Whatsapp Join our WhatsApp Group Join our Telegram GroupMATHEMATICAL LITERACY PAPER 1
GRADE 12
NATIONAL SENIOR CERTIFICATE
JUNE 2017
INSTRUCTIONS AND INFORMATION
- This question paper consists of FIVE questions. Answer ALL the questions.
- Use the addendum with ANNEXURES for the following questions:
ANNEXURE A for QUESTION 1.6
ANNEXURE B for QUESTION 4.1
ANNEXURE C for QUESTION 4.2
ANNEXURE D for QUESTION 5.1
ANSWER SHEET 1 for QUESTION 2.2.2 - Write the GRADE and YOUR NAMES in the spaces provided on the ANSWER SHEET 1. Hand in the ANSWER SHEET with your ANSWER BOOK.
- Number the answers correctly according to the numbering system used in this question paper.
- Start EACH question on a NEW page.
- You may use an approved calculator (non-programmable and non-graphical), unless stated otherwise.
- Show ALL calculations clearly.
- Round off ALL the final answers according to the context used, unless stated otherwise.
- Indicate units of measurement, where applicable.
- Maps and diagrams are NOT necessarily drawn to scale, unless stated otherwise.
- Write neatly and legibly.
QUESTION 1
1.1 Mabo is a director in an import company and earns R1 285 456 p.a.
1.1.1 Write down the abbreviation p.a. in full. (2)
1.1.2 Write R1 285 456 in words. (2)
1.1.3 Round off R1 285 456 to the nearest hundred. (2)
1.2 Study TABLE 1 below that shows the items Mabo bought from a Super Spar in Port Elizabeth and answer the questions that follow.
(Some information is omitted.)
TABLE 1: Items Mabo bought
| Item | Prices excluding VAT |
| 1:Marina salt 500 g | R3,99 |
| 2:Maize meal 2,5 kg | R29,99* |
| 3:I&J fish fingers 400 g | R59,98 |
| 4:Jumbo eggs (1 dozen) | R17,99 |
| 5:150 mℓ of cooking oil | R13,99 |
| *0,00% VAT Rate | |
| 14% VAT Rate | |
1.2
1.2.1 Calculate the price of ONE egg. (2)
1.2.2 Calculate the amount of VAT to be charged on I&J fish fingers of 400 g. (2)
1.2.3 Convert 2,5 kg of maize meal into grams. (1 000 g = 1 kg) (2)
1.2.4 Calculate the number of grams for a 150 mℓ cooking oil if 10 mℓ weighs 8 g. (2)
1.3 Jane mixed orange juice with water in the ratio 1 : 5 to serve to parents at a school function.
Determine the number of glasses of water used to mix 10 glasses of orange juice. (2)
1.4 The programme for a 2017 matric farewell function was designed on an A4 sheet of paper with length of 0,294 m. Give this length in centimetres (cm). Given that 1 cm = 0,01 m. (2)
1.5 Lindi has grandchildren of whose ages as shown: 3; 4; 5; 8; 8; 12; 13; 14; 16. Use the information to answer the following questions:
1.5.1 Three of the grandchildren are girls. Determine the number of boys. (2)
1.5.2 Determine the range from the ages of the girls given that their ages are odd numbers (2)
1.6 Research was carried out among Grade 12 learners in a high school to find out the most popular dress code for an end year party in 2016. Use the results displayed in ANNEXURE A to answer the following questions.
1.6.1 Write down the number of learners that took part in the research (2)
1.6.2 Identify the most popular dress code. (2)
1.6.3 Determine the number of boys who preferred a traditional dress code. (2)
[28]
QUESTION 2
2.1 TABLE 2 below shows the income and expenditure statement for the period 2015 and 2016 for Jony and Brothers business venture in King William’s Town.
Use the information in TABLE 2 to answer the questions that follow.
TABLE 2
| Income and expenditure statement for the years 2015 and 2016 in Rands | |||||
| Income | Expenditure | ||||
| Details | 2015 | 2016 | Details | 2015 | 2016 |
| Fee income | 260 000 | 316 000 | Bank fees | 1 080 | 1140 |
| Interest received | 2 600 | 2 860 | Salaries | 160 000 | 160 400 |
| Insurance | 6 600 | 7 400 | |||
| Water and electricity | 2 400 | 2600 | |||
| Cellphones | 9 600 | 10 400 | |||
| Postage | 280 | 360 | |||
| Depreciation | 4 800 | 7 200 | |||
| Entertainment | 1 400 | 1 600 | |||
| Cleaning | 2 400 | 2 440 | |||
| 262 600 | 318 860 | 188 560 | ---------- | ||
| Total profit for 2015 | ---------- | ||||
| Total profit for 2016 | 126 460 | ||||
2.1.1 Calculate the profit made in 2015.
You may use the formula: Profit = Income – Expenditure (2)
2.1.2 Calculate the total expenditure incurred in 2016. (2)
2.1.3 Identify ONE item whose value increased by 50% from 2015 to 2016. (2)
2.1.4 Determine the percentage increase of salaries from 2015 to 2016.
Use the formula: % ???????? ?? ????????=???????? ?? ???????????????? ?? ???? ×??? (3)
2.2 Lutho, a university student intends to buy a cellphone. He was provided with options A, B and C by a service provider.
Option A
Contract that charges a monthly fixed cost of R500 for the calls made during the month not exceeding 800 minutes. (No calls allowed after the limit.)
Option B
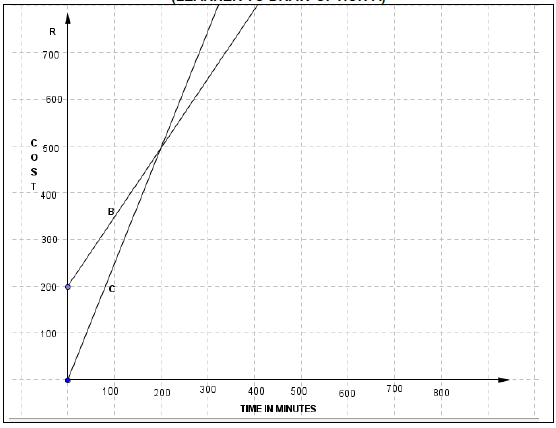
Contract that charges a monthly fixed cost of R200 plus R1,50 for each minute called. (Cost (C) = 200 + 1,50 x number of minutes called in a month)
Option C
Pre-paid charges R2,50 for each minute called.
Cost (C) = 2,50 x number of minutes called in month):
The graph provided on ANSWER SHEET 1 represents options B and C. Use it to answer the following questions.
2.2.1 Identify the independent variable from the graph. (2)
2.2.2 Draw a graph for option A on the graph provided on ANSWER SHEET 1. (3)
2.2.3 Use the graphs to identify the cheapest option for calls amounting to 200 minutes in a month. (2)
2.2.4 Lutho selected one option randomly. What is the probability that he chose option C? (2)
2.3 Lerato used a paraffin heater pictured below during winter in 2016.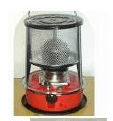
Capacity of the heater is 3 litres.
TABLE 3 below shows the cost per litre of paraffin for the period March 2016 to June 2016. Use the information to answer the questions that follow.
TABLE 3: Paraffin cost per litre for the given period
| Period | 2nd March – 5th April 2016 | 6thApril – 3rd June 2016 |
| Cost per litre of paraffin | R5,60 | P |
2.3.1 Calculate the cost of paraffin bought in March 2016 to fill one heater. (2)
2.3.2 Determine the value of P if the cost of a litre of paraffin increased by
10% for the period 6thApril – 3rd June 2016. (3)
2.3.3 Lerato uses one full tank of the heater every two nights. Calculate the cost of paraffin she bought on 1st June 2016 to use in that month. (3)
[26]
QUESTION 3
3.1 ABC Company won a tender to supply road sign posts of Type 1 and Type 2 shown in the pictures below.
Use the pictures to answer the questions that follow.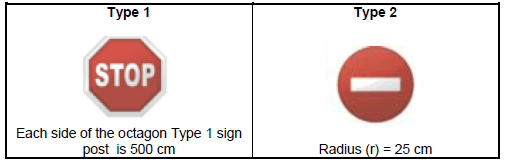
3.1.1 Calculate the perimeter of the Type 1 sign post in metres. (3)
3.1.2 Calculate the area of sign post Type 2 in ??2.
You may use the formula: Area of a circle: ?=??? and ?=?,???. (2)
3.1.3 Determine the area of the enclosed rectangle given that its area is ?? th of the area of the sign post Type 2. (2)
3.2 The paint used for painting the sign posts is bought in a cylindrical container shown below.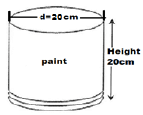
Internal diameter: d = 20 cm and Internal height: h = 20 cm
3.2.1 Calculate the volume of the paint contained in the above cylindrical container in ??3. Use the formula: V = ????, and ?=?,???. (3)
3.2.2 Given that the 1 cm3 of paint can be used to paint an area 2 cm2. Calculate the number of Type 2 sign posts that can be painted using paint in one cylindrical container.
Use the formula: Number of sign posts= 2 x Volume of the paint
Area of sign post type 2−area of enclosed rectangle) (3)
[13]
QUESTION 4
4.1 The 2015 “Up Run” Comrades Marathon took place between Durban and Pietermaritzburg which are 150 m and 596 m above sea level respectively.
The profile map of the marathon is shown in the addendum as ANNEXURE B. Use the map to answer the questions that follow.
4.1.1 Which ONE of the following statements best describes the meaning of “Up Run marathon”? Write down the letter only next to the question number.
A marathon that starts from a low to a high altitude.
A marathon that starts from high to low altitude.
A marathon that is run along the paths that has no change in altitude. (2)
4.1.2 Write down an estimate distance (in km) of the Comrades Marathon. (2)
4.1.3 Identify the highest point on the route. (2)
4.1.4 A runner is expected to take 12 hours to complete the Comrades Marathon. Determine the average speed of the runner and give the answer with correct units.
Use the formula: Speed = ????????
???? (3)
4.2 One of the runners travelled from Cape Town. A map of South Africa in ANNEXURE C shows the main routes and cities. Use it to answer the questions that follow.
4.2.1 The straight line distance between Cape Town and Durban is 70 mm. Use the scale of 1 : 16 000 000 to determine the distance in km. (3)
4.2.2 Write down the compass direction of Pietermaritzburg from Durban. (2)
4.2.3 Determine the number of towns between Cape Town and Pietermaritzburg along the N2 and N3. 2)
[16]
QUESTION 5
5.1 The graph in ANNEXURE D shows the results of a study carried out on HIV prevalence by sex and age in South Africa in 2012. Use the graph to answer the following questions.
5.1.1 Name the type of graph used to display the data of HIV prevalence. (2)
5.1.2 Determine the median of HIV prevalence (%) for females. (2)
5.1.3 Calculate the mean HIV prevalence (%) for the males ages that is displayed. (3)
5.1.4 The upper quartile for male HIV prevalence is 17,3%. Identify the male age groups that have a HIV prevalence (%) that is more than the upper quartile.(3)
5.2 The government carried out a survey on the type of toilet facilities in households in 2011 and 2016.
Use TABLE 4 below to answer the questions that follow.
TABLE 4: The distribution of households by toilet facilities
| Toilet facilities | Census 2011 | Census 2016 | ||
| Number | % | Number | % | |
| Flush toilet (connected to sewage) | 8 242 924 | 57,0 | 10 260 829 | 60,6 |
| Flush toilet (with septic tank) | 442 481 | 3,1 | 461 934 | 2,7 |
| Chemical toilet | 360 703 | 2,5 | 713 856 | 4,2 |
| Pit toilet with ventilation(VIP) | 1 266 102 | B | 2 063 128 | 12,2 |
| Pit toilet without ventilation | 2 786 068 | 19,3 | 2 315 279 | 13,7 |
| Ecological toilet | 0 | 0 | 49 277 | 0,3 |
| Bucket toilet | 297 847 | 2,1 | 377 231 | 2,2 |
| Other | 305 444 | 2,1 | 271 895 | 1,6 |
| None | 748 592 | 5,2 | 409 881 | 2,4 |
| TOTAL | 14 450 161 | 100 | A | 100 |
5.2
5.2.1 Calculate the value of A the total number of households surveyed in 2016. (2)
5.2.2 Determine the value of B, the percentage of VIP to the total number of households surveyed in 2011. (2)
5.2.3 Determine the probability that a household chosen at random in 2016 had a flush toilet. (3)
[17]
TOTAL: 100
ANSWER SHEET
NAME:
GRADE:
QUESTION 2.2.2
GRAPH SHOWING PHONE DEAL OPTIONS B AND C;
(LEARNER TO DRAW OPTION A)