ElimuZA Access to Education
GRADE 12 MATHEMATICAL LITERACY PAPER 1 MEMORANDUM - PAST PAPERS 2017 JUNE
Share via Whatsapp Join our WhatsApp Group Join our Telegram GroupMATHEMATICAL LITERACY PAPER 1
GRADE 12
MEMORANDUM
NATIONAL SENIOR CERTIFICATE
JUNE 2017
This memorandum consists of 6 pages.
| Symbol | Explanation |
| M | Method |
| CA | Consistent accuracy |
| A | Accuracy |
| S | Simplification |
| RT/RG/RM | Reading from a table/Reading from a graph/Read from map |
| SF | Substitution in a formula |
| P | Penalty, e.g. for no units, incorrect rounding off etc. |
| R | Rounding Off/Reason |
QUESTION 1 [28 Marks]
| Quest | Solution | Explanation | Marks |
| 1.1.1 | p.a. means per annum ✓✓ OR annual earning | R | (2) |
| 1.1.2 | One million, two hundred eighty five thousand, four hundred and fifty six ✓✓ | R | (2) |
| 1.1.3 | 1 285 500 ✓✓ | Rounding | (2) |
| 1.2.1 | Price of an egg =17,9912 = 1,499 ✓ = R1,50 ✓ | 1A for 12 1CA (2 dp. money) | (2) |
| 1.2.2 | VAT = 14 ×59,88 ✓ = R8,38 ✓ 100 | 1M Multiplication 1A (2 dp. for money) | (2) |
| 1.2.3 | 2,5 × 1 000 = 2 500 g ✓✓ | 1MA Multiplication 1A | (2) |
| 1.2.4 | 10 ?ℓ→8? 150 ?ℓ→? ? = 150 × 8 =120 ? ✓✓✓ 10 | 2M 1A | (2) |
| 1.3 | Juice: Water = 1 : 5 10: ?? ?? = 10 × 5 =50 glasses of water ✓ 1 | 1M 1A | (2) |
| 1.4 | Length = 0,294 ✓= 29,4 cm ✓ 0,01 | 1M division 1A | (2) |
| 1.5.1 | Number of boys = 9 – 3 = 6 | 1MA 1A | (2) |
| 1.5.2 | Range = 13 – 3 ✓ = 10 | 1MA 1A | (2) |
| 1.6.1 | Learners that took part in research = 32 ✓✓ | 2 RG | (2) |
| 1.6.2 | Formal dress code ✓✓ | 2 RG | (2) |
| 1.6.3 | Boys that preferred traditional dress code = 24 – 16 ✓= 8 ✓ OR counting from graph – 8 boys ✓✓ | 1M subtraction of the values 1CA AO | (2) |
[28]
QUESTION 2 [26 Marks]
| Quest. | Solution | Explanation | Marks |
| 2.1.1 | Profit for 2015 = Income – expenditure = 262 600 – 188 560 ✓ = 74 040 ✓ | 1MA subtraction 1A | (2) |
| 2.1.2 | Total expenditure in 2016 = 160 400 + 7 400 + 2 600 +10 400 + 360 + 7 200 +1 600 + 2 440 = 192 400 ✓ OR Total expenditure = Income – profit = 318 860−126 460 ✓ = 192 400 ✓ | 1M addition of expenses 1A 1M addition of expenses 1A | (2) |
| 2.1.3 | Depreciation increased by 50% ✓✓ | 2RT | (2) |
| 2.1.4 | % ???????? ?? ????????= ???????? ?? ???????? ×100 ???????? ?? 2015 = 160 400−160 000 ×100 ✓ 160 000 = 400 ×100 = 0,25% ✓ 160 000 | 1SF 1A | (2) |
| 2.2.1 | Minutes (time) ✓✓ | 2RT | (2) |
| 2.2.2 | GRAPH SHOWING CELLEPHONE DEALS OPTIONS: A; B; C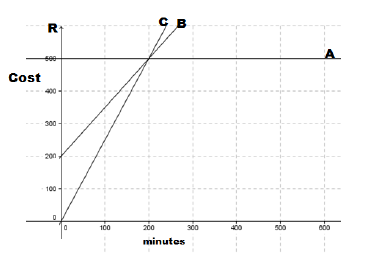 Point (0; 500), another point on line cost = 500 ✓ line cost = 500 ✓ | (3) | |
| 2.2.3 | Same cost for all the options. ✓✓ OR None is cheaper. ✓✓ | 2RG | (2) |
| 2.2.4 | P(C) =1 3 ✓✓ | 1 numerator 1 denominator (Answer only full marks) | (2) |
| 2.3.1 | Cost of paraffin = 5,60 × 3 ✓= R16,80 ✓ | 1MA Multiplication 1A | (2) |
| 2.3.2 | P = 5,60 ×1,1 ✓✓=R6,16 ✓ OR P = 5,60 × 110 ✓✓= R6,16 100 OR Increase = 5,60 × 10% = R0,56 ✓ P = 5,60 + 0,56 ✓ = R6,16 ✓ | 2 MA Multiplication 1A 1MA for the increase 1M addition 1A | (3) |
| 2.3.3 | No. of tanks = 30 =15 ✓ 2 Cost = 15 × 3 × 6,16 ✓= R277,20 ✓ | 1A for 15 1M Multiplication 1CA | (3) |
[26]
QUESTION 3 [13 Marks]
| Quest. | Solution | Explanation | Marks |
| 3.1.1 | Perimeter = 8 ×500 ✓ = 4 000 ÷100✓ = 40 m ✓ | 1M multiplication 1M dividing by 100 1CA | (3) |
| 3.1.2 | = 3,142×252 ✓ =1 963,75?2 ✓ | 1S radius and 3,142 1A (-1 for using calculator pi) | (2) |
| 3.1.3 | Area of the rectangle = 1 ?ℎ of the area of the sign post Type 2 5 = 1 ×196 3,75 ✓ 5 = 392,75 ??2 ✓ | 1S (Area from 3.1.2) 1CA | (2) |
| 3.2.1 | V = ??2ℎ h = 20 cm r = 10 cm ✓ V = 3,142×102×20 ✓ V = 6 284 ??3 ✓ | 1A (r = 10 cm) 1SF 1S 1CA | (3) |
| 3.2.2 | ?????? ?? ???? ????? = 2 × ?????? ?? ?ℎ? ?????(???? ?? ???? ???? ???? 2−???? ?? ???????? ?????????) = 2 × 6284 (1 963,75−392,75)✓✓ = 8 ✓ | 1SF 1S simplification 1CA | (3) |
[13]
QUESTION 4 [16 Marks]
| Quest | Solution | Explanation | Marks |
| 4.1.1 | A ✓✓ | 2R | (2) |
| 4.1.2 | Allow any value between 85 ‒ 90 km ✓✓ | 2 RM | (2) |
| 4.1.3 | Highest point: UMLAAS RD ✓✓ | 2 RM | (2) |
| 4.1.4 | Speed = ???????? ???? = 85 = 7,08 km/h | 1S 1CA 1A unit (km/h) | (3) |
| 4.2.1 | Distance Cape Town to Durban 1 : 16 000 000 70 mm : 16 000 000 x 70 mm ✓ Distance = 16 000 000 x 70 ÷1000 000 ✓ =1 120 km ✓ | 1M multiplication 1M division 1A (with units) | (3) |
| 4.2.2 | NW/????ℎ ???? ✓✓ | 2 Reading Map | (2) |
| 4.2.3 | 8 ✓✓ | 2 Reading Map | (2) |
[16]
QUESTION 5 [17 Marks]
| Quest | Solution | Explanation | Marks |
| 5.1 5.1.1 | Bar graph ✓✓ | 2 RG | (2) |
| 5.1.2 | Ascending order 2,4; 2,4; 5,6; 9,7; 14,8; 17,4; 19, 7; 28, 0; 28,4; 31,6; 36,0 ✓ Median = 17,4 | 1M order 1M middle value 2M middle values | (2) |
| 5.1.3 | Mean = 2.3+0.7+5.1+17.3+25.6+28.8+15.8+13.4+15.5+5.5+4.6 11✓ =134.6= 12,24 ✓ 11✓ | M1 Addition 1M division by 11 1A | (3) |
| 5.1.4 | The male age groups that have more than the upper quartile are 30‒34: ✓✓ and 35‒39 ✓ (36% and 28,8%) | 2 RG (Allocate 1 mark if % is given instead of age groups) | (3) |
| 5.2 5.2.1 | 10 260 829 + 461 934 + 713 856+ 2 063 128 + 2 315 279+49 277 + 377 231+271 895 + 409 881= 16 923 309 ✓✓ | 1M addition 1A | (2) |
| 5.2.2 | Value of B =1 266 102 x 100 ✓= 8,76 = 8,8%✓ 14 450 161 OR Value of B = 100% ‒ (57,0 + 3,1 +2,5 + 19,3 + 2,1 + 2,1 + 5,2) ✓= 8,8% ✓ | 1MA 1A 1M (100 ‒ the total of the other %) CA | (2) |
| 5.2.3 | P(flush toilet) = (60,6% + 2,7%) ✓✓ = 63,3% ✓ OR P(flush toilet) = ????? ???ℎ ????ℎ ?????? ????? ?? ?????? = 10 722 763 ✓× 100 ✓=63,4% ✓ 16 923 309 | 1M 1S 1A 1SF (numerator and denominator) 1M multiplication with100 1CA | (3) |
[17]
TOTAL: 100
Published in 2017 Grade 12 June Exams