GEOGRAPHY PAPER 1 GRADE 12 ANNEXURE - AMENDED SENIOR CERTIFICATE PAST PAPERS AND MEMOS MAY/JUNE 2017
Share via Whatsapp Join our WhatsApp Group Join our Telegram GroupGEOGRAPHY PAPER 1
GRADE 12
SENIOR CERTIFICATE EXAMINATIONS
ANNEXURE
MAY/JUNE2017
FIGURE 1.1: SYNOPTIC WEATHER MAP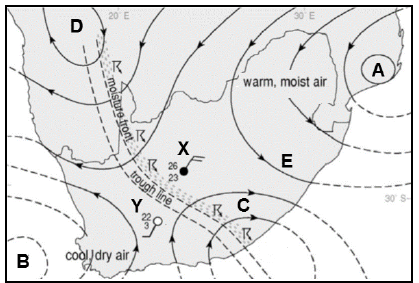
FIGURE 1.3: SATELLITE IMAGE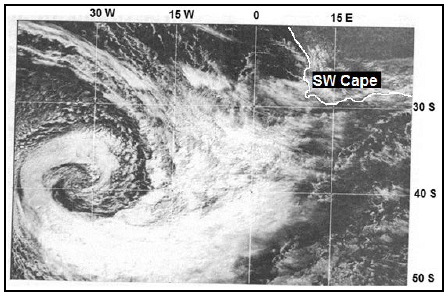
FIGURE 1.4: AVERAGE AIR TEMPERATURE DISTRIBUTION IN THE
JOHANNESBURG CBD
|
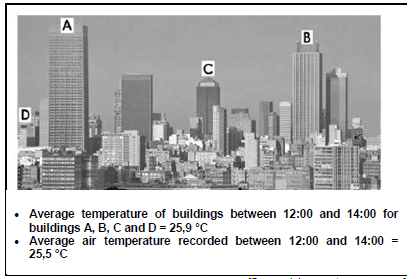
FIGURE 1.5: SURFACE RUN-OFF PATTERNS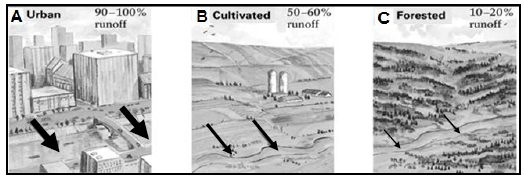
The thickness of the arrow refers to the volume of water
FIGURE 1.6: RIVER CAPTURE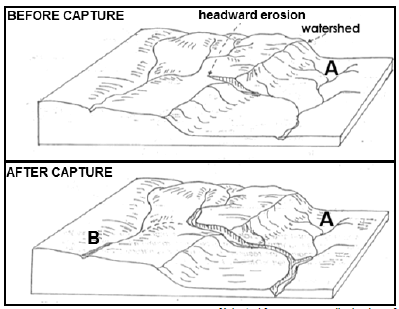
FIGURE 2.1: THE INFLUENCE OF THE PLATEAU ON THE WEATHER AND CLIMATE OF SOUTH AFRICA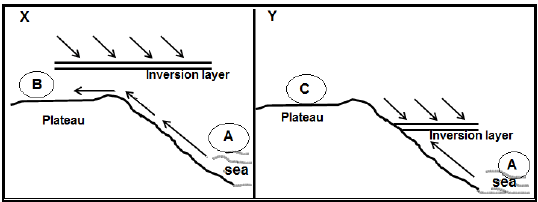
FIGURE 2.2: FLUVIAL FEATURES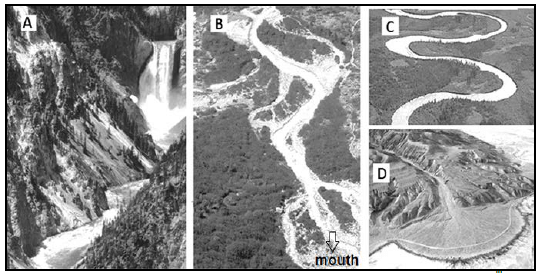
FIGURE 2.3: SLOPE WINDS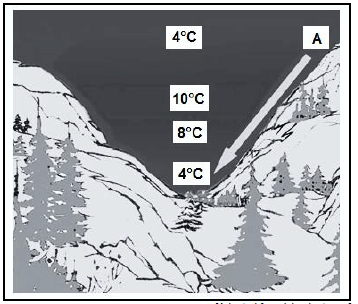
FIGURE 2.4: HURRICANES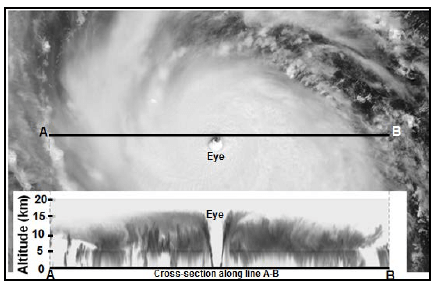
FIGURE 2.5: STREAM DISCHARGE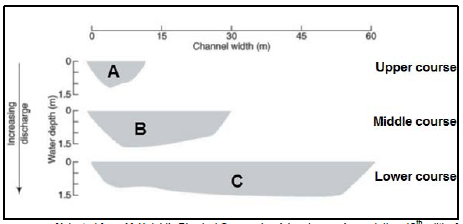
FIGURE 2.6: CATCHMENT AND RIVER MANAGEMENT
CASE STUDY ON CATCHMENT AND RIVER MANAGEMENT: WORKING FOR WETLANDS Covering many South African river basins, the Working for Wetlands programme operates in all major catchments. |
FIGURE 3.3: 1913 NATIVES LAND ACT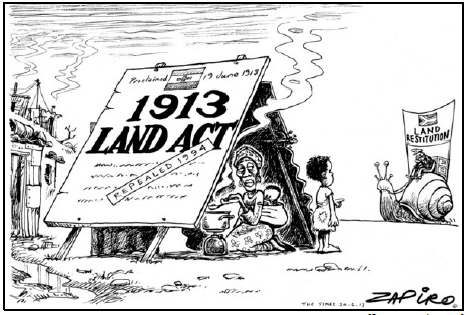
FIGURE 3.4: A CENTRAL PLACE AND ITS SURROUNDING CUSTOMERS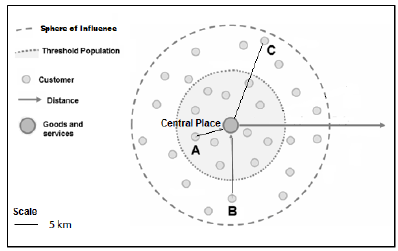
FIGURE 3.5: SMALL-SCALE FARMING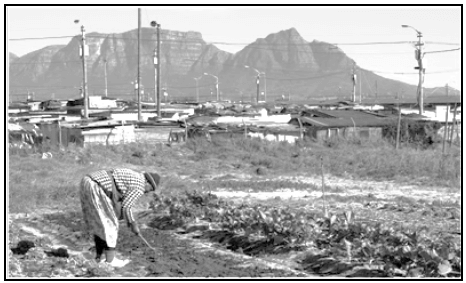
FIGURE 3.6: DURBAN-PINETOWN INDUSTRIAL REGION
| The Durban-Pinetown Industrial Region is the hub of industrial development along the coast of KwaZulu-Natal. Eight new industrial areas have been developed within this industrial region. One of these industrial areas, Cornubia Industrial Park, will generate 36 000 new job opportunities according to the developers. An additional 370 000 short-term construction jobs will also be created in the Cornubia Industrial Park. |
FIGURE 4.2: ECONOMIC GEOGRAPHY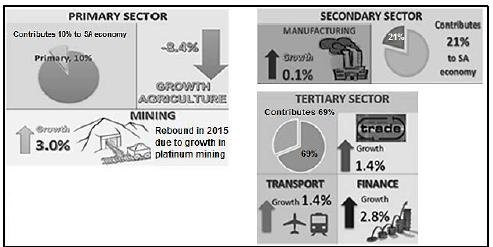
FIGURE 4.3: RURAL-URBAN MIGRATION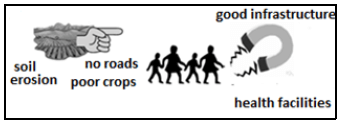
FIGURE 4.4: AN URBAN PROBLEM
FIGURE 4.5: MAPUTO DEVELOPMENT CORRIDOR
| The Maputo Corridor is a transport corridor linking the east coast port of Maputo in Mozambique with the highly industrialised and productive regions of Gauteng in South Africa. The key elements of this transport corridor are the N4 toll road, the rail corridor, the Lebombo/Ressano Garcia border post and the port and terminal facilities at the Port of Maputo. Short by African corridor standards, the Maputo Corridor is only 590 km by road between Maputo and Johannesburg, and 581 km by rail. It is increasingly strategic because it presents the shortest route to a port for South African exporters on the corridor. The Port of Maputo provides the shortest access to the Indian and Far Eastern markets and it supports the South African regional port hubs in a multipurpose port of 15 terminals. It is an extremely busy trade corridor, despite its short distance. Trade between South Africa and Mozambique totalled R25,1 billion in 2011. Annually a total of 4,6 million people, 730 000 vehicles and 87 000 trucks cross the border into Mozambique at the Lebombo/Ressano Garcia border post. Trade is largely outward bound. |
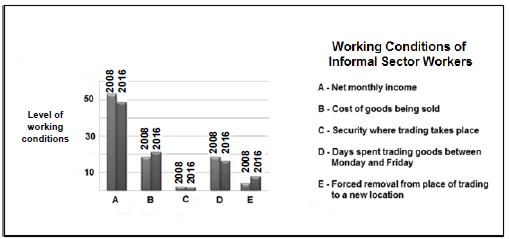
FIGURE 4.6: INFORMAL SECTOR