AGRICULTURAL SCIENCES PAPER 2 GRADE 12 MEMORANDUM - AMENDED SENIOR CERTIFICATE PAST PAPERS AND MEMOS MAY/JUNE 2017
Share via Whatsapp Join our WhatsApp Group Join our Telegram GroupAGRICULTURAL SCIENCES PAPER 2
GRADE 12
SENIOR CERTIFICATE EXAMINATIONS
MEMORANDUM
MAY/JUNE 2017
SECTION A
QUESTION 1
1.1
1.1.1 D ✓✓
1.1.2 C ✓✓
1.1.3 B ✓✓
1.1.4 D ✓✓
1.1.5 A ✓✓
1.1.6 C ✓✓
1.1.7 A ✓✓
1.1.8 D ✓✓
1.1.9 D ✓✓
1.1.10 B/C/D ✓✓ (10 x 2) (20)
1.2
1.2.1 E ✓✓
1.2.2 J ✓✓
1.2.3 C ✓✓
1.2.4 D ✓✓
1.2.5 B ✓✓ (5 x 2) (10)
1.3
1.3.1 Fixed price/cost/price fixing/hedging ✓✓
1.3.2 Management ✓✓
1.3.3 Inversion ✓✓
1.3.4 Polygenic ✓✓
1.3.5 Cross breeding/out crossing ✓✓ (5 x 2) (10)
1.4
1.4.1 Market segment ✓
1.4.2 Closing balance ✓
1.4.3 Continuous ✓
1.4.4 Biometrics ✓
1.4.5 Heterosis/hybrid vigour ✓ (5 x 1) (5)
TOTAL SECTION A: 45
SECTION B
QUESTION 2: AGRICULTURAL MANAGEMENT AND MARKETING
2.1 Market functions
2.1.1 The letter representing the functions of marketing
- C ✓(1)
- B/D ✓(1)
- D ✓(1)
- A ✓ (1)
2.1.2 THREE advantages of processing agricultural products
- Prevents spoilage/perishability/increases shelf life/ increases storage period ✓
- The product is available throughout the year ✓
- Improves food safety ✓
- Easy to transport ✓
- Adds/increases value/quality/usefulness of product ✓
- It provides job/business opportunities ✓
- Reduces wastage of excess produce ✓
- It is a way of overcoming over-supply of products ✓
- It allows for easier packing and handling of products ✓
- Higher price of products/higher income/profit ✓ (Any 3)(3)
2.2 Marketing channels
2.2.1 Farm gate marketing ✓ (1)
2.2.2 Stock auction ✓ (1)
2.2.3 Contract market ✓ (1)
2.2.4 Fresh produce market ✓ (1)
2.2.5 Internet marketing ✓ (1)
2.3 Graph on price equilibrium
2.3.1 Identification of curves
- A Demand ✓(1)
- B Supply ✓ (1)
2.3.2 THREE factors affecting demand
- Price of the product ✓
- Quality of products/usefulness of product ✓
- Consumer preferences/fashion/taste of consumers ✓
- Range of products available/substitute/complimentary products ✓
- Season/time/period of production ✓
- Income/status of consumers/buying power of consumers ✓
- Number of consumers ✓ (Any 3) (3)
2.3.3 Definition of equilibrium
The price where the supply ✓ is equal to the demand ✓ (2)
2.3.4 Relationship between the price and the quantity demanded
The higher the price, the lower the quantity demanded ✓✓
OR
The lower the price the higher the quantity demanded ✓✓(2)
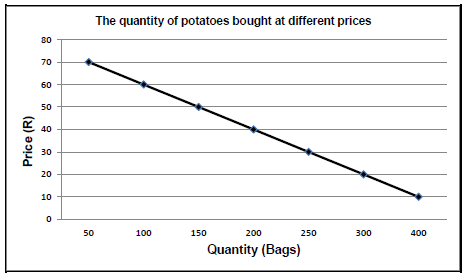
2.4 The number of potatoes bought at different prices per week
2.4.1 Line graph showing the quantities of potatoes bought at different prices
Criteria/rubric/memorandum
- Correct heading ✓
- X axis: Correctly calibrated and labelled (Quantity) ✓
- Y axis: Correctly calibrated and labelled (Price) ✓
- Correct units (R and bags) ✓
- Line graph ✓
- Accuracy ✓(6)
2.4.2 The price when most potatoes were bought
R10 ✓ (1)
2.4.3 Reason
400 bags of potatoes were bought when the price was R10/the
highest quantity was bought at R10/lowest price/highest quantity bought at the lowest price ✓ (1)
2.5 THREE problems encountered when drawing up a business plan
- Insufficient research done ✓
- Vague business plan ✓
- Insufficient cash flow allocated ✓
- Unrealistic assumption and projections ✓
- Hiding weaknesses and risks ✓
- Not highlighting potential competition ✓
- Using the incorrect format ✓
- Inconsistent information on supplies ✓ (Any 3) (3)
2.6 THREE elements of the SWOT analysis
- Strengths ✓
- Weaknesses ✓
- Opportunities ✓
- Threats ✓ (Any 3) (3)
[35]
QUESTION 3: PRODUCTION FACTORS
3.1 The budget of a small-scale farmer for a year
3.1.1 ONE cost item that can be repaid over a period of five years
Loan (tractor) ✓ (1)
3.1.2 Reason for the answer
A tractor is a medium term asset ✓ (1)
3.1.3 Calculation of the highest income generated
- R200 000 + R120 000 ✓
- = R320 000 ✓(2)
3.1.4 TWO problems associated with a medium term asset
- Interest rate on loan ✓
- Depreciation ✓ (2)
3.1.5 The profit of the enterprise
- Profit = income – expenditure ✓
- R320 000 – R252 500 ✓
- Profit = R67 500 ✓ (3)
3.2 Labour legislation
3.2.1 Basic Conditions of Employment Act, 1997 (Act 75 of 1997) ✓ (1)
3.2.2 Skills Development Act, 1998 (Act 97 of 1998) ✓ (1)
3.2.3 Occupational Health and Safety Act, 1993 (Act 85 of 1993) ✓ (1)
3.3 Scenario on labour as a production factor
3.3.1 Identification of the type of labourers
Seasonal labourers ✓ (1)
3.3.2 Distinction between a permanent and a seasonal labourer
Seasonal labourer
- Employed only for harvesting/specific time/peak period of the year/season ✓
Permanent labourer
- Permanently employed throughout the year ✓ (2)
3.4 THREE challenges of labour as a production factor
- Shortages/scarcity of labour ✓
- High cost of labour ✓
- Lack of skills/training ✓
- Competition from other industries/economic migrants ✓
- Poor labour management/working conditions ✓
- Social problems/HIV and AIDS ✓
- Industrial action/strikes ✓ (Any 3)(3)
3.5 Calculation of the wage of the labourer working on a public holiday
- R150 x 2/R150 + R150 ✓
- = R300 ✓ (2)
3.6 Management principles
3.6.1 Association of the statement with the management principles
- A Control/supervision ✓
- B Organization/coordination ✓
- C Planning ✓(3)
3.6.2 THREE business managerial skills of a manager to perform duties at C
- Conceptual ✓
- Analytical ✓
- Planning ✓
- Problem solving ✓
- Application skills
- Financial management skills ✓
- Implementation ✓
- Decision making ✓ (Any 3) (3)
3.7 Scenario on the increasing of land productivity
3.7.1 Consolidation/consolidating uneconomic units/mechanisation ✓ (1)
3.7.2 Scientific methods/improve soil fertility/crop rotation/inter cropping ✓ (1)
3.7.3 Restoring land potential ✓ (1)
3.7.4 Improving water management ✓ (1)
3.8 Explanation with an example the law of diminishing return
- As the quantity of an input is increased, the yield (output) will increase ✓
- until a specific point, thereafter it will increase at a decreasing rate ✓
- Example (fertilizer application and maize yield) ✓ (3)
3.9 TWO functions of land as a production factor
- Source of minerals ✓
- Used as a collateral ✓
- Provides physical space for production ✓
- Provides raw materials ✓
- Food production ✓ (Any 2)(2)
[35]
QUESTION 4: BASIC AGRICULTURAL GENETICS
4.1 Crossing of yellow and white flowers
4.1.1 Provision of the labels (a) - (e)
- Yy ✓
- Yellow ✓
- Yy ✓
- 3:1 (Yellow to white) ✓
- 1:2:1 ✓ (5)
4.1.2 Type of dominance
Complete dominance ✓ (1)
4.1.3 Justification
- Yellow colour (Y) is dominant over white colour (y) ✓
- No intermediate/new colour in the offspring ✓ (Any 1) (1)
4.2 TWO crosses in F1 generation
4.2.1 Indication of the type of crossing
Monohybrid ✓ (1)
4.2.2 Reason
Crossing involving only one characteristic/trait ✓ (1)
4.2.3 Prediction of the genotype of parents in the first crossing
- Parent 1 Bb ✓
- Parent 2 bb ✓
OR
- Bb ✓ x bb ✓ (2)
4.2.4 Punnet square determining the genotypic percentage of the offspring in the second crossing
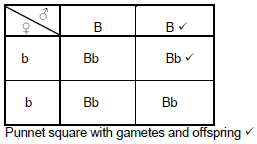
Genotypic percentage of the offspring is 100% ✓
Marking guidelines
Complete Punnet square with gametes and offspring ✓
Correct gametes ✓
Correct offspring ✓
Correct percentage ✓ (4)
4.2.5 Calculation of the phenotypic percentage of the offspring in the second crossing
Phenotypic % = 4 x 100 ✓
4
= 100% black ✓ (2)
4.3 Scenario on Genetic Modification
4.3.1 Identification of the advantage of GM seed over the traditional seed
- Yield doubled during the first harvest ✓
- Spraying against bollworm is reduced/less costs ✓ (Any 1) (1)
4.3.2 TWO possible techniques used to modify the cotton seed
- Bacterial carriers/Agrobacterium tumefaciens ✓
- Gene gun/ biolistic ✓
- Electroporation ✓
- Micro - injection ✓
- Lipofection ✓
- Viral carriers ✓
- Gene silencing✓
- Gene slicing ✓
- Gene recombination ✓
- Calcium-phosphate precipitation✓ (Any 2) (2)
4.3.3 TWO economic benefits of using genetically modified seed to the farmer
- Reduced cost for pesticides ✓
- Higher yield/ more income ✓ (2)
4.3.4 TWO impacts of using the GM cotton seed
- Environment
- Less spraying leads to reduced pollution of environment ✓
- Leads to herbicide resistant crops/super weeds ✓
- Beneficial insects/pests are killed when feeding on insect resistant crops ✓
- Biodiversity is reduced ✓ (Any 2)(2)
- Economic
- Seeds are expensive/farmers have to buy new seed yearly/ famers may not retain seeds for breeding purposes ✓
- High input costs as farmers must pay a technology fee ✓ (2)
4.4 Breeding systems
4.4.1 Cross breeding/upgrading ✓ (1)
4.4.2 Inbreeding ✓ (1)
4.4.3 Upgrading ✓ (1)
4.4.4 Species crossing ✓ (1)
4.5 Breeding Value (BV)
4.5.1 Calculation of the weaning weight of the progeny in kilograms
16 + 6 = 22 ✓
22 ✓
2
= 11 kg ✓
OR
(16 ÷ 2) + (6 ÷ 2)✓
8+ 3 ✓
= 11 kg ✓ (3)
4.5.2 Interpretation of the figure
The offspring of these parents will be 11 kg heavier ✓ than the average of the herd ✓ (2)
[35]
TOTAL SECTION B: 105
GRAND TOTAL : 150