LIFE SCIENCES PAPER 2 GRADE 12 QUESTIONS - NSC PAST PAPERS AND MEMOS FEBRUARY/MARCH 2017
Share via Whatsapp Join our WhatsApp Group Join our Telegram GroupLIFE SCIENCES
PAPER 2
GRADE 12
NSC PAST PAPERS AND MEMOS
FEBRUARY/MARCH 2017
INSTRUCTIONS AND INFORMATION
Read the following instructions carefully before answering the questions.
- Answer ALL the questions.
- Write ALL the answers in the ANSWER BOOK.
- Start the answers to EACH question at the top of a NEW page.
- Number the answers correctly according to the numbering system used in this question paper.
- Present your answers according to the instructions of each question.
- Do ALL drawings in pencil and label them in blue or black ink.
- Draw diagrams, tables or flow charts only when asked to do so.
- The diagrams in this question paper are NOT necessarily drawn to scale.
- Do NOT use graph paper.
- You must use a non-programmable calculator, protractor and a compass, where necessary.
- Write neatly and legibly.
QUESTIONS
SECTION A
QUESTION 1
1.1 Various options are provided as possible answers to the following questions. Write down the question number (1.1.1–1.1.8), choose the answer and make a cross (X) over the letter (A–D) of your choice in the ANSWER BOOK.
EXAMPLE:
1.1.9 ![]()
1.1.1 The process where one DNA molecule produces two identical DNA molecules is called …
- reproduction.
- replication.
- translation.
- protein synthesis.
1.1.2 A difference between DNA and RNA:
- RNA is double-stranded and DNA is single-stranded.
- DNA has a sugar-phosphate frame, whereas RNA does not.
- There are weak hydrogen bonds in DNA, but not in RNA.
- RNA has a helix structure and DNA is straight.
1.1.3 A pedigree diagram shows …
- how organisms evolve.
- the inheritance of characteristics over many generations.
- sex-linked characteristics only.
- the number of children in a family only.
1.1.4 A red flowering plant is crossed with a white flowering plant. All the offspring have pink flowers. When the two pink flowering plants are crossed, the next generation of flowering plants will have flowers that are …
- pink only.
- red only.
- white only.
pink, red and white.
1.1.5 The diagram below represents the chemical structure of a protein. 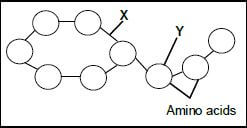
X represents a …
- hydrogen bond.
- nitrogen base.
- peptide bond.
- mRNA molecule.
1.1.6 The difference between nucleic acids and nucleotides is that ...
- nucleic acids are building blocks of nucleotides.
- nucleotides are building blocks of nucleic acids.
- nucleotides are larger than nucleic acids.
- nucleic acids are found in the nucleus and nucleotides are found in the cytoplasm.
1.1.7 Which ONE of the following events occurs during metaphase I of meiosis?
- Homologous chromosomes arrange themselves at the equator
- Centrioles move to opposite poles
- Chromosomes arrange themselves singly at the equator
- Splitting of the cytoplasm
1.1.8 Comparisons of the amino acid sequences in a protein have been made between humans and a number of other organisms. The number of differences is shown in the table below.
ORGANISM | SHARK | KANGAROO | FISH | COW | LIZARD |
Number of differences in amino acid sequences in a protein compared to humans | 79 | 27 | 68 | 17 | 62 |
[Adapted from AQA Biology 1998]
The type of evidence for evolution in the table above is …
- fossil evidence.
- biogeography.
- cultural evidence.
- genetic evidence. (8 x 2) (16)
1.2 Give the correct biological term for each of the following descriptions. Write only the term next to the question number (1.2.1 to 1.2.7) in the ANSWER BOOK.
1.2.1 A sudden change in the sequence/order of nitrogenous bases of a nucleic acid
1.2.2 Explanation of an observation that is supported by facts, models and laws
1.2.3 The breeding of organisms over many generations in order to achieve a desirable phenotype
1.2.4 The type of sugar found in an RNA molecule
1.2.5 Type of evolution involving long periods of time when species do not change and short periods of rapid change
1.2.6 The hypothesis which supports migration of human ancestors from the point of origin
1.2.7 The mineralised remains of organisms that have lived in the past (7 x 1) (7)
1.3 Indicate whether each of the statements in COLUMN I applies to A ONLY, B ONLY, BOTH A AND B or NONE of the items in COLUMN II. Write A only, B only, both A and B, or none next to the question number (1.3.1 to 1.3.3) in the ANSWER BOOK.
COLUMN I | COLUMN II |
1.3.1 Occurs during telophase of meiosis I | A: Dividing of the cytoplasm |
1.3.2 Location of DNA | A: Nucleus |
1.3.3 Found in African apes and humans | A: Claws instead of nails |
(3 x 2) (6)
1.4 The diagram below shows possible evolutionary relationships among primates. 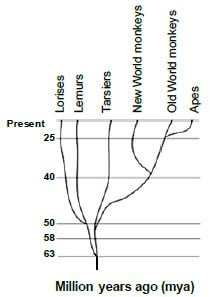
[Source: http://dl0.creation.com/articles]
1.4.1 How many million years ago did the:
- Apes appear on Earth (1)
- Common ancestor evolve to form the Tarsiers and Lemurs (1)
1.4.2 Which TWO species share the most recent common ancestor? (2)
1.4.3 Which species is most closely related to the Lemur? (1) (5)
1.5 The diagrams below represent a chromosome pair in a female human cell.
The cells (A, B and C) show different events in a phase of meiosis, which are not necessarily in the correct sequence. 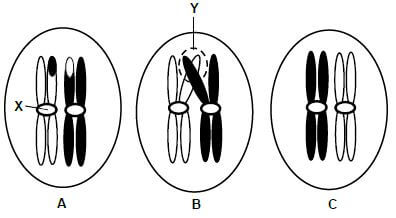
1.5.1 How many pairs of chromosomes occur in a normal human cell? (1)
1.5.2 Give labels for:
- Structure X (1)
- Area Y (1)
1.5.3 Name the organ in the human female where meiosis occurs. (1)
1.5.4 Name the:
- Process occurring in diagram B (1)
- Phase represented by the diagrams above (1)
- Type of cells that would result from meiosis of this cell (1)
1.5.5 Arrange the letters A, B and C to show the correct sequence of the events. (1) (8)
1.6 Coat colour in mice is controlled by two alleles, black (B) and grey (b). Tail length is controlled by two alleles, long (T) and short (t).
The Punnett square below shows a part of the cross between two mice. Genotype (i) has been left out. 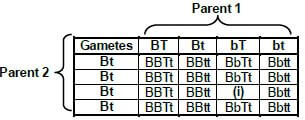
1. 6.1 Give the:
- Genotype of parent 1 (2)
- Phenotype of parent 2 (2)
- Genotype of offspring (i) (1)
1.6.2 What percentage of the offspring above is grey with short tails? (1)
1.6.3 State the genotypes of TWO gametes from the table above that will result in offspring that are heterozygous for both traits, if fertilisation occurs. (2) (8)
TOTAL SECTION A: 50
SECTION B
QUESTION 2
2.1 Read the passage below.
NEW HOMININ SPECIES DISCOVERED On 13 September 2013 scientists discovered fossils in the Sterkfontein Caves in South Africa which appeared to belong to a previously unknown species of hominins. [Adapted from https://humanorigins.si.edu/evidence] |
2.1.1 Define the term transitional fossil. (2)
2.1.2 Name a characteristic from the passage that Homo naledi shared with both Australopithecus and Homo. (1)
2.1.3 State ONE other characteristic from the passage that Homo naledi shared only with Australopithecus. (1)
2.1.4 Explain TWO characteristics of a skeleton which are adaptations for bipedalism. (4)
2.1.5 Give ONE possible reason why there was a change to smaller teeth in modern humans. (3) (11)
2.2 Study the table below that shows the change in antibiotic resistance in three strains of bacteria (MRSA, VRE and FQRP) over a period of 20 years.
YEAR | ANTIBIOTIC RESISTANCE (%) | ||
MRSA | VRE | FQRP | |
1981 | 2 | 0 | 0 |
1985 | 10 | 0 | 0 |
1989 | 15 | 2 | 0 |
1993 | 40 | 5 | 5 |
1997 | 40 | 20 | 10 |
2001 | 60 | 20 | 25 |
[Source: http://wallace.genetics.uga.edu/groups/evol]
2.2.1 Which bacterial strain was the:
- Most resistant to antibiotics over the years (1)
- Last to develop antibiotic resistance (1)
2.2.2 Calculate the percentage increase in antibiotic resistance in VRE from 1993 to 1997. (3)
2.2.3 Draw a line graph to show the development of antibiotic resistance in the bacterial strain MRSA. (6) (11)
2.3 The diagram below represents nitrogen-base sequences of a part of a nucleic acid that codes for making insulin. Insulin is necessary for the uptake of sugar from the blood.
The sequences below are from two individuals and are read from left to right. Sequence 1 is from a normal person and sequence 2 is from a person who shows a mutation and cannot produce insulin.
TWO NITROGEN-BASE SEQUENCES OF A PART OF A NUCLEIC ACID | |||||||||
Sequence 1 | TAG | CCA | CAC | GTT | ACA | ACG | TGA | AGG | TAA |
Sequence 2 | TAT | CCA | CAC | GTT | ACA | ACG | TGA | AGG | TAA |
[Source: www.biologyjunction.com]
2.3.1 Which nucleic acid is represented in both sequences? (1)
2.3.2 Where did the mutation in the second sequence occur? (1)
The table below shows the amino acids coded for by different DNA base triplets.
AMINO ACID | DNA BASE TRIPLET |
Glycine | CCG |
CCT | |
CCC | |
Valine | CAT |
CAC | |
Histidine | GTA |
GTG | |
Proline | GGA |
GGC | |
Isoleucine | TAA |
TAT |
2.3.3 Give the:
- Anticodon of the fourth base triplet on sequence 2 (2)
- Amino acid coded for by the first base triplet in sequence 2 (2) (6)
2.4 Describe the process of transcription in protein synthesis. (4)
2.5 Tay-Sachs disease is caused by an autosomal recessive allele (n). Children with Tay-Sachs disease lose motor skills and mental functions. Over time, the children become blind, deaf, mentally retarded and paralysed. Tay-Sachs children die by the age of five.
The pedigree diagram below shows the inheritance of Tay-Sachs disease in a family. 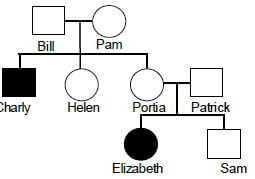
[Source: www.tay-sachs.org]
2.5.1 Give:
- Charly's phenotype (2)
- Portia's genotype (2)
- Bill's genotype (2)
2.5.2 Explain why Patrick is normal, but a carrier of Tay-Sachs disease. (2) (8)
[40]
QUESTION 3
3.1 Tom and Maria have three children. One of the three children was adopted. A DNA profile for each member of the family was prepared to determine if Tom is the father of all three children (Anne, Mary and Steve).
The DNA profiles are given below. 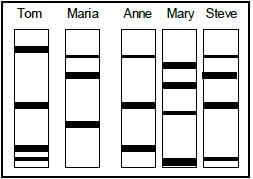
3.1.1 Which ONE of the children has been adopted? (2)
3.1.2 Explain your answer to QUESTION 3.1.1. (2) (4)
3.2 Human blood groups are controlled by multiple alleles.
3.2.1 How many alleles control blood groups? (1)
3.2.2 Which TWO alleles are codominant in the inheritance of blood groups? (2)
3.2.3 A man is heterozygous for blood group A and marries a woman who has blood group O. Use a genetic cross to show the phenotypic ratio of their offspring. (7) (10)
3.3 Haemophilia is a genetic disorder caused by a recessive allele on the X chromosome.
A haemophiliac female marries a normal male. Explain why all their sons will be haemophiliacs. (4)
3.4 Finches of the species Geospiza fortis are found on one of the Galápagos Islands. There was variation in the size of their beaks.
All the finches used to feed on small, soft seeds which were plentiful on the island. Then the island was affected by a severe drought which made food scarce.
Many of the plants on the island died. The small, soft seeds were all gone. Only hard, woody seeds remained.
Scientists conducted an investigation to determine the relationship between beak size and survival of the finches before and during the drought.
The table below shows the results of part of the investigation.
BEAK SIZE (mm) | TOTAL NUMBER OF FINCHES BEFORE THE DROUGHT | TOTAL NUMBER OF FINCHES DURING THE DROUGHT |
7,3 | 2 | 0 |
7,8 | 12 | 2 |
8,3 | 30 | 4 |
8,8 | 48 | 4 |
9,3 | 45 | 6 |
9,8 | 40 | 8 |
10,3 | 25 | 10 |
[Adapted from Excerpt Evolution, Roberts et al.]
3.4.1 List FOUR steps that the scientists followed to obtain their results. (4)
3.4.2 Name the independent variable of this investigation. (1)
3.4.3 Describe the relationship between the number of finches during the drought and beak size. (2)
3.4.4 Give a possible reason for the relationship in your answer to QUESTION 3.4.3. (3)
3.4.5 Predict which beak size(s) would be present in the population if the drought continued. (1) (11)
3.5 The diagram below shows a genetic engineering process. A donor cell was taken from the muscle cell of a male champion horse (stallion) to create a new offspring. 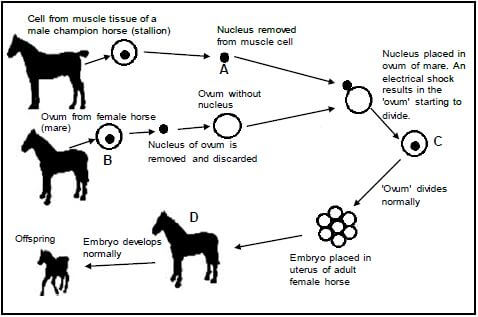
[Adapted from www.biologyreference.com]
3.5.1 Name the:
- Genetic engineering process shown in the diagram above (1)
- Process that produced ovum B (1)
3.5.2 Why is the donor cell extracted from a champion horse? (2)
3.5.3 Explain why only the nucleus of the donor cell is used. (2)
3.5.4 A somatic cell in a horse contains 64 chromosomes. How many chromosomes would there be in:
- Structure A (1)
- Ovum B (1)
- A muscle cell in organism D (1)
3.5.5 Explain why the 'ovum' labelled C cannot be considered a gamete. (2)
(11)
[40]
TOTAL SECTION B: 80
SECTION C
QUESTION 4
The anole lizard of the Caribbean Islands represents a group of about 150 closely related species, which evolved within the past 50 million years from a single species.
Use this example to describe how natural selection led to the process of speciation that gave rise to the 150 different species of lizards.
Content: (17)
Synthesis: (3)
(20)
NOTE: NO marks will be awarded for answers in the form of a table, flow charts or diagrams.
TOTAL SECTION C: 20
GRAND TOTAL: 150