GRADE 12 MATHEMATICAL LITERACY PAPER 2 QUESTIONS - AMENDED SENIOR CERTIFICATE PAST PAPERS AND MEMOS MAY/JUNE 2017
Share via Whatsapp Join our WhatsApp Group Join our Telegram GroupMATHEMATICAL LITERACY PAPER2
GRADE 12
SENIOR CERTIFICATE EXAMINATIONS
MAY/JUNE 2017
INSTRUCTIONS AND INFORMATION
- This question paper consists of FOUR questions. Answer ALL the questions.
- Use the ANNEXURES in the ADDENDUM to answer the following questions:
- ANNEXURE A for QUESTION 1.2
ANNEXURE B for QUESTION 3.2
ANNEXURE C for QUESTION 4.1
ANNEXURE D for QUESTION 4.2 - Number the answers correctly according to the numbering system used in this question paper.
- Start EACH question on a NEW page.
- You may use an approved calculator (non-programmable and non-graphical), unless stated otherwise.
- Show ALL calculations clearly.
- Round off ALL final answers appropriately according to the given context, unless stated otherwise.
- Indicate units of measurement, where applicable.
- Maps and diagrams are NOT drawn to scale, unless stated otherwise.
- Write neatly and legibly.
QUESTION 1
1.1 Basketball is a team sport in which any member of the team can score points in a match.
In TABLE 1 below the manager of a basketball team recorded the number of points scored by each member of the team in the last two tournaments played.
TABLE 1: RECORD OF POINTS SCORED BY EACH TEAM MEMBER
| Player | A | B | C | D | E | F | G | H | I | J | K | L | M | N | O |
| First Tournament | 27 | 41 | 53 | 32 | 42 | 28 | 43 | 34 | 46 | 62 | 56 | 30 | 38 | 44 | 43 |
| Player | E | B | C | D | A | F | G | H | I | M | K | L | J | O | N |
| Second Tournament | 10 | 10 | 17 | 20 | 27 | 29 | 33 | 40 | 41 | 50 | 63 | 70 | 79 | 81 | 100 |
Use TABLE 1 above to answer the questions that follow.
1.1.1 Express the probability (as a decimal) of randomly selecting a member of the team who scored between 50 and 80 points in the second tournament. (3)
1.1.2 Calculate, as a percentage of the total number of team players, the number of players whose points decreased from the first to the second tournament.(3)
1.1.3 Use the points scored by the team in the first tournament and determine:
- Median score (3)
- Modal score (2)
- Interquartile range (IQR)
The following formula may be used:
IQR = upper quartile - lower quartile (3)
1.1.4 The box and whisker plots below represent the points scored by individual players in the two tournaments.
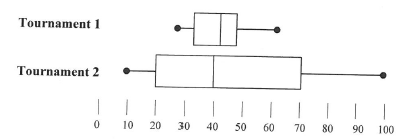
Use the interquartile range and the maximum and minimum values to compare the performance of the team during the two tournaments.(4)
1.2 PICTURE 1 in ANNEXURE A shows a basketball court, scoring positions with points and a player scoring.
Use ANNEXURE A and the information provided in QUESTION 1.1 to answer the questions that follow.
1.2.1 A player in the first tournament scored his total points with goals as
follows:
- 3 goals from free-throw line
- 8 goals from inside the 3-point(pt) line
- 3 goals from outside the 3-pt line
Determine which player obtained this total score. Show ALL the calculations. (4)
1.2.2 The diameter of the centre circle of a normal basketball court is 3,66 m. Write (in simplified form) the ratio of the diameters of:
hoop : centre circle (3)
1.2.3 The shaded part in the diagram below shows the ball passing exactly through the centre of the hoop.
DIAGRAM 1; DIRCT VIEW OF THE AREA BETWEEN THE BASKETBALL AND THE HOOP WHEN IT PASSES THROUGH THE CENTRE
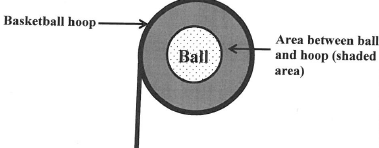
Determine the area of the shaded part of the sketch. You may use the following formula:
Area of circle =π x (radius)2, were n = 3,142 (7)
1.3 The team that won the tournament received a total bonus of R8,1 million.
The 15 players in the team were placed into three groups, X, Y and Z, according to their performance in the tournament. Each group has an equal number of players
The bonus was shared between the three groups in the ratio X : Y : Z = 2 : 3 : 4. Each player in each group received an equal amount of money
A player in group Y stated that he would receive a bonus of R540 000.
Verify whether his statement is CORRECT. Show ALL the calculations. (7)
[39]
QUESTION 2
2.1 Statistics South Africa published the following data on urban food price trends for selected wheat products for the period April 2015 to April 2016.
TABLE 2: WHEAT PRODUCT PRICES FOR APRIL 2015 TO APRIL 2016
WHEAT PRODUCTS | AVERAGE (MEAN) PRICE IN RAND | PERCENTAGE CHANGE | |||
| Apr 2015 | Jan 2016 | Apr 2016 | Jan 2016 to Apr 2016 | Apr 2015 to Apr 2016 | |
| Cake flour 1 kg | 12,10 | 12.32 | 12.22 | -0.81 | 0.99 |
| Cake flour 2,5 kg | 22.57 | 23.60 | 26.48 | 12.20 | 17.32 |
| Cake flour 5 kg | 46.39 | 49.51 | 53.38 | 7.82 | 15.07 |
| Brown bread 600 g | 6.34 | 6.57 | 6.72 | 2.28 | 2.99 |
| Brown bread 700 g | 10.51 | 10.88 | 11.50 | Q | 9.42 |
| Brown bread 800 g | 13.35 | K | 14.44 | 6.18 | 8.16 |
| White bread 600 g | 7.18 | 7.50 | 7.50 | 0.00 | 4.46 |
| White Bread 600g | 11.61 | 12.03 | 12.66 | 5.24 | 9.04 |
| Macaroni 500g | 11.00 | 11.02 | 12.13 | 10.07 | 10.27 |
| Spaghetti 500 g | 10.87 | 11.29 | 12.57 | 11.34 | 15.64 |
| Average percentage change: | 6.00 | E | |||
| [Adapted data from Slats SA Media Release: Food Price Monitor, May 2016] | |||||
Use TABLE 2 above to answer the questions that follow.
2.1.1 Determine the missing values:
- K (3)
- Q (4)
- E (3)
2.1.2 Describe the trend in the average mean prices for white bread (600 g and 700 g) for the period Apr. 2015 to Jan. 2016 and Jan. 2016 to Apr. 2016. (4)
2.1.3 Mr Mkhize buys wheat products regularly. He did not receive a salary increase from January 2015 to January 2016.
Explain the impact of the change in wheat product prices on his household income. (2)
2.2 The average year-on-year inflation rate for 2016 was 6,6% and 6% has been projected for 2017.
Calculate the projected price of brown bread (600 g) in April 2018.(6)
2.3 Meloding Supermarket buys bread for resale directly from the bakery. The bread is stacked in crates when transported.
| PICTURE OF A RECTANGULAR BREAD CRATE | PICTURE OF STACKED BREAD CRATES |
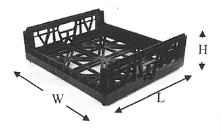 L (length) = 690 mm W (width) = 445 mm . | 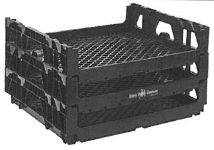 A maximum of 9 crates may be stacked vertically on top of each other |
The manager had one delivery consisting of 80 crates.
Use the information above to answer the questions that follow.
2.3.1 Calculate the volume (in mm3) of each crate
The following formula may be used:
Volume of a rectangular prism = length X width X height (3)
2.3.2 The manager stated that all 80 crates can be packed in a 2 m x 2m area in the store room. (Assume that the height of the store room is adequate for 9 stacked crates.)
Verify if this statement is CORRECT. Show ALL calculations (7)
2.3.3 The cost price of the delivery of 80 crates of bread is R5 350,00.
Each crate contains 8 loaves of bread.
The supermarket sells each loaf of bread for R11,50.
The proportional fixed cost for this delivery of bread is RI 720,70.
Calculate the number of loaves of bread that Meloding Supermarket has to sell in order to break even.
The following formula may be used:
Number of loaves to break even = FC
SP - CP
Where:
FC is the proportional fixed costs
SP is the selling price per loaf of bread
CP is the cost price per loaf of bread (5)
[37]
QUESTION 3
3.1 Francis studied the population estimates of South Africa provided by Statistics SA for the years 2014 to 2016.
TABLE 3 below shows population estimates, by group, for SA females for 2014, 2015 and 2016.
TABLE 3: POPULATION ESTIMATES BY GROUP FOR SA FEMALES
| 2014 | 2015 | 2016 | ||||
| NUMBER | % | NUMBER | % | NUMBER | % | |
| Black | 22 165 000 | 80,2 | 22 574 500 | 80,4 | 22 990 700 | 80,6 |
| Coloured | 2 465 700 | 8,9 | 2 498 100 | 8,9 | 2 529 200 | 8,9 |
| Indian/Asian | 664 900 | 673 900 | 684 100 | |||
| White | 2 340 400 | 8,5 | 2 332 200 | 8,3 | 2 325 100 | 8,1 |
| Total | 27 635 900 | 28 078 700 | 28 529 100 |
Use TABLE 3 above to answer the questions that follow.
3.1.1 During 2015 the number of black females was estimated to be 41,1% of the total South African population.
Determine the estimated total South African population (rounded off to the nearest 100) for 2015. (4)
3.1.2 The total estimated population of SA during 2016 was 55 908 900.
If a person was randomly chosen in 2016, determine the probability that the person would be the following:
- A white female (2)
- A male (3)
3.1.3 Show, using calculations, that in any TWO consecutive years the Indian/Asian female percentage (rounded off to ONE decimal place) remained the same.(5)
3.2 Francis intends renovating her house by changing the following:
- Replacing the carpets in the passage, dining room and living room with laminated flooring
- Building a new railing along one side of the wooden sundeck
The railing consists of panels made up of two main posts and a number of smaller posts. The spaces between the posts are equal.
ANNEXURE B contains the floor plan of Francis' house.
Picture of one incomplete panel that shows the placing of the posts
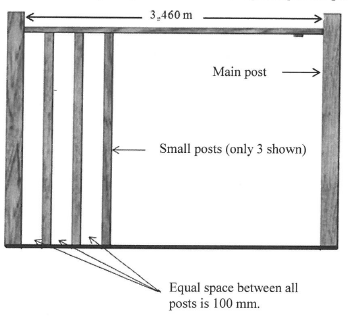
NOTE: A small post has a width of 40 mm. The spaces between the posts in the panel is 100 mm.
Use the information above to answer the question that follows.
3.2.1 Calculate how many posts should be fitted in one panel. (4)
Use ANNEXURE B to answer the questions that follow.
3.2.2 Give and explain ONE possible reason why Bedrooms 2 and 3 will most probably be the warmest rooms during the day.(2)
3.2.3 Explain why the doors of the closet (C), linen(L), storage (S) and pantry (P) all open in a different direction compared to the other doors in the house. (2)
3.2.4 Calculate the total area (rounded to the nearest m2) that needs to be covered with laminated flooring if the passage is 15% of the combined areas of the dining room and living room.
You may use the formula:
Area of a rectangle = length x width (8)
3.2.5 Francis obtained a quotation for the installation of the laminated flooring in the dining room, living room and passage. An insulation sheet (underlayer) has to be placed on the floor before the laminated flooring is placed on top.
A summary of the labour and materials quotation is as follows:
Labour:
- R1 600 for removal of existing carpets and preparation of floor
- R70,00 per square metre for installation of laminated flooring
Materials:
- R299,90 per box of laminated flooring, where each box covers 2,15 m2
- R56,90 per roll of underlayer insulation that covers 10 m2
Francis budgeted R12 000 to complete the entire job.
Show, with calculations, whether her budget was sufficient. (8)
[38]
QUESTION 4
4.1 Abel lives in Australia. He earned an annual taxable income of $289 303,26 in the 2015/2016 tax year and $311 001 in the 2016/2017 tax year. He studied the revised Australian tax tables which showed that from 1 July 2016 individual tax rates for certain brackets had changed.
The Australian tax tables for the 2015/2016 and 2016/2017 tax years are given on ANNEXURE C.
Use the information above and ANNEXURE C to answer the questions that follow.
4.1.1 Identify the taxable income bracket(s) affected by the tax rate changes introduced from 1 July 2016. (3)
4.1.2 Explain the tax implications of the medical levy on individual tax payers. (2)
4.1.3 Abel stated that the tax and medical levy due for the 2016/2017 tax year was $9 882,94 more than the amount that was due for the 2015/2016 tax year.
Verify, showing ALL calculations, whether his statement is CORRECT. (12)
4.2 Abel went on holiday and stayed in the Denmark Hotel. He used a map to help him identify the different tourist destinations.
The map is shown in ANNEXURE D.
Use ANNEXURE D to answer the questions that follow.
4.2.1 Write down the names of the venues that have wheelchair access.
4.2.2 Give ONE valid reason why it can be stated that a bridge forms part of the South Coast Highway.
4.2.3 State the general direction of the Civic Centre from Organic Indigo Indian Cuisine.
4.2.4 Describe the route that Abel would travel if he exited the Denmark Hotel at the Walker Street entrance and intended visiting the Mary Rose restaurant.
4.2.5 Abel walks at a speed of 1,1 m per second. He commented that it would take him 2 minutes to walk from Denmark Pizza to Organic Indigo Indian Cuisine. Verify, showing ALL calculations, whether this comment is valid. (9)
TOTAL: 150