GRADE 12 MATHEMATICS PAPER 2 QUESTIONS - NSC PAST PAPERS AND MEMOS FEBRUARY/MARCH 2017
Share via Whatsapp Join our WhatsApp Group Join our Telegram GroupGRADE 12 MATHEMATICS
PAPER 2
NSC PAST PAPERS AND MEMOS
FEBRUARY/MARCH 2017
INSTRUCTIONS AND INFORMATION
Read the following instructions carefully before answering the questions.
- This question paper consists of 11 questions.
- Answer ALL the questions in the ANSWER BOOK provided.
- Clearly show ALL calculations, diagrams, graphs et cetera that you have used in determining your answers.
- Answers only will not necessarily be awarded full marks.
- You may use an approved scientific calculator (non-programmable and non-graphical), unless stated otherwise.
- If necessary, round off answers to TWO decimal places, unless stated otherwise.
- Diagrams are NOT necessarily drawn to scale.
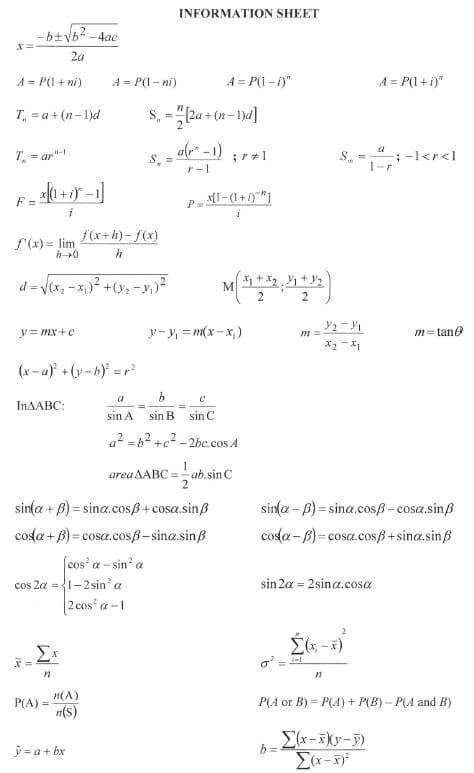
- An information sheet with formulae is included at the end of the question paper.
- Write neatly and legibly.
QUESTIONS
QUESTION 1
The amount of money, in rands, that learners spent while visiting a tuck shop at school on a specific day was recorded. The data is represented in the ogive below.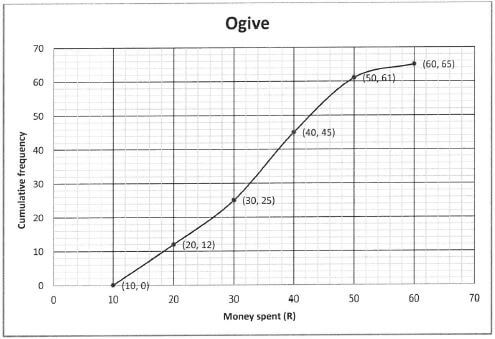
An incomplete frequency table is also given for the data.
| Amount of money (in R) | 10 ≤ x < 20 | 20 ≤ x < 30 | 30 ≤ x < 40 | 40 ≤ x < 50 | 50 ≤ x < 60 |
| Frequency | a | 13 | 20 | b | 4 |
1.1 How many learners visited the tuck shop on that day? (1)
1.2 Write down the modal class of this data. (1)
1.3 Determine the values of a and b in the frequency table. (2)
1.4 Use the ogive to estimate the number of learners who spent at least R45 on the day the data was recorded at the tuck shop. (2)
[6]
QUESTION 2
2.1 Mrs Smith has two classes, each having 30 learners. Their final marks (out of 100) for the year are represented in the box and whisker diagram below. 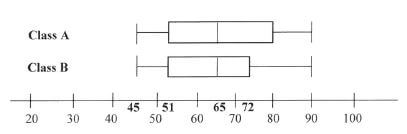
2.1.1 Determine the interquartile range of Class B. (2)
2.1.2 Explain the significance in the difference of the length of the boxes in the diagram. (2)
2.1.3 Mrs Smith studied the results and made the comment that there was no significant difference in the performance of the two classes. Give TWO reasons you think Mrs Smith will use to prove her statement. (2)
2.2 Eight couples entered a dance competition. Their performances were scored by two judges. The scores (out of 20) are given in the table below.
| COUPLE | 1 | 2 | 3 | 4 | 5 | 6 | 7 | 8 |
| JUDGE 1 | 18 | 4 | 6 | 8 | 5 | 12 | 10 | 14 |
| JUDGE 2 | 15 | 6 | 3 | 5 | 5 | 14 | 8 | 15 |
2.2.1 Determine the equation of the least squares regression line of the scores given by the two judges. (3)
2.2.2 A ninth couple entered late for the competition and received a score of 15 from JUDGE 1. Estimate the score that might have been assigned by JUDGE 2 to the nearest integral value. (2)
2.2.3 Are the judges consistent in assigning scores to the performance of the couples? Prove your answer and support it with relevant statistics. (2)
(13)
QUESTION 3
In the diagram, Q(3;0), R(10 ; 7), S and T(0; 4) are the vertices of parallelogram QRST. From T a straight line is drawn to meet QR at M(5; 2). The angles of inclination of TQ and RQ are a and β respectively. 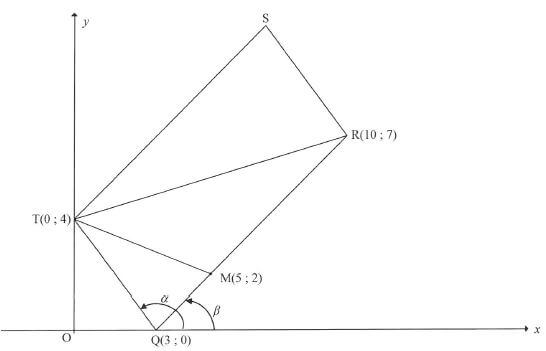
3.1 Calculate the gradient of TQ. (1)
3.2 Calculate the length of RQ. Leave your answer in surd form. (2)
3.3 F(k ; -8) is a point in the Cartesian plane such that T, Q and F are collinear. Calculate the value of k. (4)
3.4 Calculate the coordinates of S. (4)
3.5 Calculate the size of TSR. (6)
3.6 Calculate, in the simplest form, the ratio of:
3.6.1 MQ (3)
RQ
3.6.2 area of ΔTQM (3)
area of parallelogram RQTS
[23]
QUESTION 4
In the diagram, the circle, having centre T(0; 5), cuts the y-axis at P and R. The line through P and S(-3; 8) intersects the circle at N and the x-axis at M. NS = PS. MT is drawn. 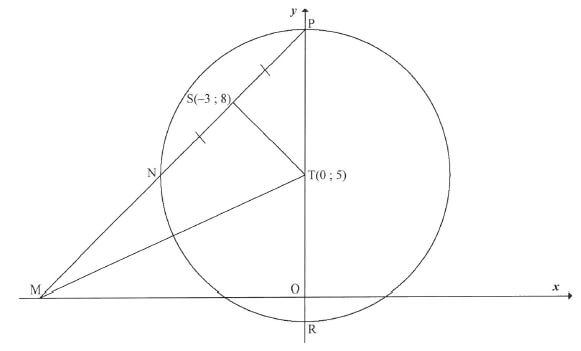
4.1 Give a reason why TS ⊥ NP. (1)
4.2 Determine the equation of the line passing through N and P in the form y = mx +c. (5)
4.3 Determine the equations of the tangents to the circle that are parallel to the x-axis. (4)
4.4 Determine the length of MT. (4)
4.5 Another circle is drawn through the points S, T and M. Determine, with reasons, the equation of this circle STM in the form (x - a)2 +(y - b)2 =r2. (5)
[19]
QUESTION 5
In the diagram, the graphs of the functions f(x)= a sin x and g(x) = tan bx are drawn on the same system of axes for the interval 0º ≤ x ≤ 225º. 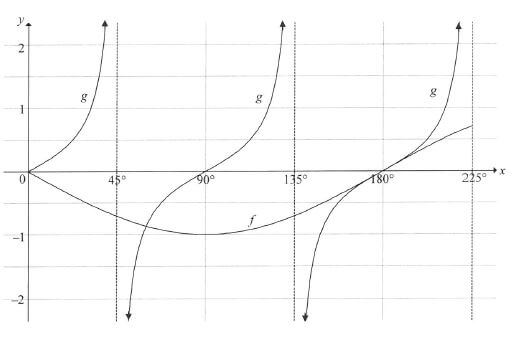
5.1 Write down the values of a and b. (2)
5.2 Write down the period of f(3x). (2)
5.3 Determine the values of x in the interval 90º ≤ x ≤ 225º for which f(x).g(x) ≤ 0. (3)
[7]
QUESTION 6
6.1 Without using a calculator, determine the following in terms of sin 36º:
6.1.1 sin 324º (1)
6.1.2 cos 72º (2)
6.2 Prove the identity: 1 - tan2θ = cos2θ (4)
1 + tan2θ
6.3 Use QUESTION 6.2 to determine the general solution of:
1 - tan2½x = 1/4
1 + tan2½x (6)
6.4 Given: cos(A - B) = cosAcosB + sinAsinB
6.4.1 Use the formula for cos(A - B) to derive a formula for sin(A - B). (4)
6.4.2 Without using a calculator, show that
sin( x + 64º) cos( x + 379º) + sin(x+19º) cos(x +244º) = 1/√2
for all values of x. (6)
[23]
QUESTION 7
In the diagram, B, E and D are points in the same horizontal plane. AB and CD are vertical poles. Steel cables AE and CE anchor the poles at E. Another steel cable connects A and C. CE = 8,6 m, BE = 10 m, AÊB = 40º, AÊC = 70º and CÊD = 27º. 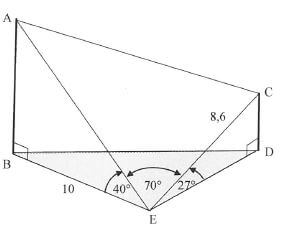
Calculate the:
7.1 Height of pole CD (2)
7.2 Length of cable AE (2)
7.3 Length of cable AC (4)
[8]
Give reasons for ALL statements and calculations in QUESTIONS 8, 9, 10 and 11.
QUESTION 8
In the diagram, PQRS is a cyclic quadrilateral. ST is a tangent to the circle at S and chord SR is produced to V. PQ = QR, Ŝ1 = 42º and Ŝ2 = 108º. 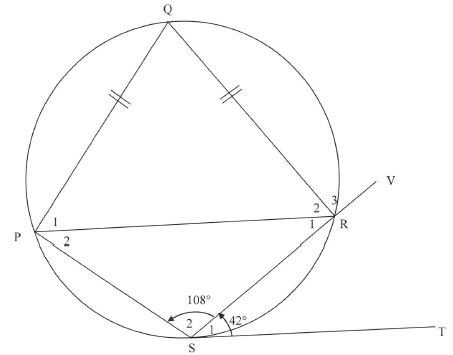
Determine, with reasons, the size of the following angles:
8.1 Q (2)
8.2 R2 (2)
8.3 P2 (2)
8.4 R3 (2)
[8]
QUESTION 9
In the diagram, PQRS is a quadrilateral with diagonals PR and QS drawn. W is a point on PS. WT is parallel to PQ with T on QS. WV is parallel to PR with V on RS. TV is drawn. PW: WS = 3:2. 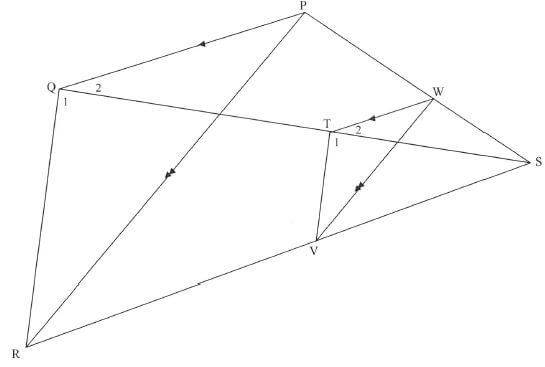
9.1 Write down the value of the following ratios:
9.1.1 ST (2)
TQ
9.1.2 SV (1)
VR
9.2 Prove that T1 = Q1. (4)
9.3 Complete the following statement: ΔVWS ||| Δ ... (1)
9.4 Determine WV: PR. (2)
[10]
QUESTION 10
10.1 In the diagram, O is the centre of the circle and P is a point on the circumference of the circle. Arc AB subtends AÔB at the centre of the circle and APB at the circumference of the circle. 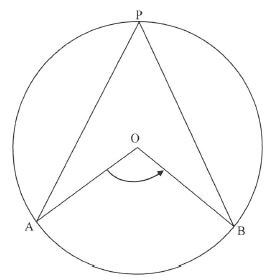
Use the diagram to prove the theorem that states that AÔB = 2APB. (5)
10.2 In the diagram, O is the centre of the circle and P, Q, S and R are points on the circle. PQ = QS and QŘS = y. The tangent at P meets SQ produced at T. OQ intersects PS at A. 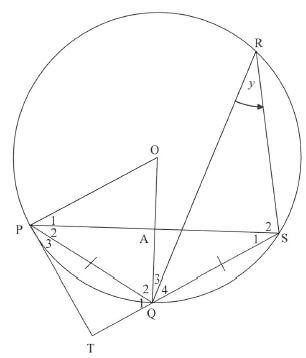
10.2.1 Give a reason why P2 = y (1)
10.2.2 Prove that PQ bisects TPS. (4)
10.2.3 Determine POQ in terms of y. (2)
10.2.4 Prove that PT is a tangent to the circle that passes through points P, O and A. (2)
10.2.5 Prove that OẬP = 90º. (5)
[19]
QUESTION 11
In the diagram, LK is a diameter of the circle with centre P. RNS is a tangent to the circle at N. T is a point on NK and TP ⊥ KL. PLN = x. 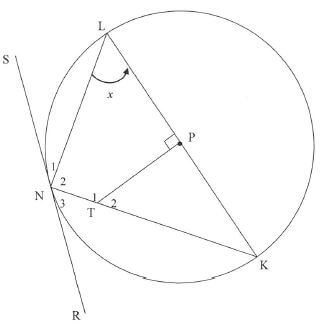
11.1 Prove that TPLN is a cyclic quadrilateral. (3)
11.2 Determine, giving reasons, the size of Ñ1 in terms of x. (3)
11.3 Prove that:
11.3.1 ΔKTP ||| ΔKLN (3)
11.3.2 KT. KN = 2KT2 – 2TP2 (5)
[14]
TOTAL: 150