GEOGRAPHY PAPER 2 GRADE 12 MEMORANDUM - NSC PAST PAPERS AND MEMOS FEBRUARY/MARCH 2017
Share via Whatsapp Join our WhatsApp Group Join our Telegram GroupGEOGRAPHY
PAPER 2
GRADE 12
NSC PAST PAPERS AND MEMOS
FEBRUARY/MARCH 2017
RESOURCE MATERIAL
- An extract from topographical map 2729BD VOLKSRUST.
- Orthophoto map 2729 BD 13 VOLKSRUST
- NOTE: The resource material must be collected by schools for their own use.
INSTRUCTIONS AND INFORMATION
- Write your EXAMINATION NUMBER and CENTRE NUMBER in the spaces on the cover page.
- Answer ALL the questions in the spaces provided in this question paper.
- You are provided with a 1 : 50 000 topographical map (2729BD VOLKSRUST) and an orthophoto map (2729 BD 13 VOLKSRUST) of a part of the mapped area.
- You must hand the topographical map and the orthophoto map to the invigilator at the end of this examination session.
- You may use the blank page at the end of this question paper for all rough work and calculations. Do NOT detach this page from the question paper.
- Show ALL calculations and formulae, where applicable. Marks will be allocated for these.
- Indicate the unit of measurement in the final answer of calculations.
- You may use a non-programmable calculator.
- The area demarcated in RED on the topographical map represents the area covered by the orthophoto map.
- The following English terms and their Afrikaans translations are shown on the topographical map:
ENGLISH
Aerodrome
Diggings
Furrow
Golf Course
Rifle Range
River
Sawmills
Sewerage Works
Silos
Weir
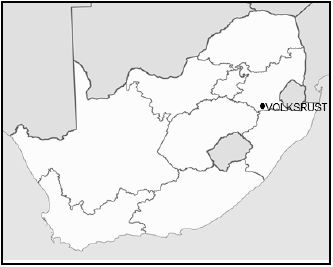
GENERAL INFORMATION ON VOLKSRUST Volksrust is a town in Mpumalanga on the border of KwaZulu-Natal. It is located 240 km southeast of Johannesburg. The town has important beef, dairy, maize, sorghum, wool and sunflower seed industries. Volksrust has an average annual rainfall of 648 mm, with the lowest rainfall (1 mm) in July and the highest rainfall (117 mm) in January. Most of the rain falls in the summer. The average midday temperatures for Volksrust range from 15,9 °C in June to 24,3 °C in January. June is the coldest period when the mercury can drop to an average of 0,5 °C during the night. FIGURE 1 |
MEMORANDUM
QUESTION 1: MULTIPLE-CHOICE QUESTIONS
The questions below are based on the 1 : 50 000 topographical map (2729BD VOLKSRUST) as well as the orthophoto map of a part of the mapped area. Various options are provided as possible answers to the following questions. Choose the answer and write only the letter (A–D) in the block next to each question.
1.1 Volksrust is situated in …
D. Mpumalanga. |
1.2 The photo index/code of the orthophoto map northwest of 2729 BD 13 VOLKSRUST is …
C.2729 BD 7. |
1.3 The direction of spot height 1634 in block H6 from spot height 1671 in block H7 on the topographical map is …
C. west-southwest. |
1.4 Volksrust is a …
B. town. |
1.5 Volksrust can be considered a …
B.central place town. |
1.6 The feature found at 27°20.2'S 29°54.4'E/27°20'12''S 29°54'24''E is a/an …
B. dam. |
1.7 The height at X in block F8 on the topographical map is ... metres.
C. 1 700 |
1.8 The feature in block B3 that was specifically developed to control the flow of water in the river is a …
D. weir. |
1.9 The … at W in block J5 indicates that rejuvenation has taken place.
B. incised meander |
1.10 The general direction of flow of the Buffelsrivier (Buffalo River) in block J5:
D. South-southeast |
1.11 The human-made feature at 7 on the orthophoto map:
B. Golf course |
1.12 The human-made feature at 2 on the orthophoto map:
D. Sewerage works |
1.13 In which urban land-use zone will the human-made feature at 2 on the orthophoto map be found?
B. Rural-urban fringe |
1.14 The straight-line distance between 4 and 9 on the orthophoto map is … kilometres.
A. 1,32 |
1.15 Feature 11 on the orthophoto map can be identified as trees due to its …
B. rough texture. |
(15 x 1)[15]
QUESTION 2: MAP CALCULATIONS AND TECHNIQUES
2.1 Refer to the magnetic declination on the topographical map and answer the questions that follow.
2.1.1 Calculate the current magnetic declination for Volksrust. Show ALL calculations. Marks will be awarded for calculations.
Difference in years = 2017 – 2010
= 7 years ✓
Mean annual change = 3'W ✓ [MUST indicate W]
Total change = 7 x 3'W
= 21'W ✓
Magnetic declination for 2017 = 20º37'W + ✓21'W
= 20º58'W ✓ (5 x 1) (5)
2.1.2 State the influence that the change in the magnetic declination from 2010 to 2017 will have on the direction of the magnetic north and the angle between true north and magnetic north.
Direction: The magnetic north will move in a westerly direction ✓
Angle: The angle between the true north and magnetic north will Increase/get bigger/larger ✓ (2 x 1) (2)
2.2 Refer to points 1 and 10 on the orthophoto map.
2.2.1 Calculate the average gradient between points 1 and 10 on the orthophoto map. Show ALL calculations. Marks will be awarded for calculations.
Formula: Gradient = vertical interval (VI)
horizontal equivalent (HE)
VI = 1725.7m – 1680 = 45.7m ✓
HE = 2.2cm (2.1cm – 2.3cm) x 100m = 220m ✓
(Range: 210 m to 230 m)
Gradient = 45.7 ✓ (Mark allocated for correct substitution)
220
= (45.7/ 45.7) ÷ (220/45.7 ) ✓ If this conversion calculation is not shown, add mark for calculation where the correct substitution is shown.
= 1 /4.8
= 1 : 4.8 / 1 in 4.8 ✓
(Range: 1 : 4.59/4.6 to 1 : 5) (5 x1) (5)
2.2.2 Is the average gradient between points 1 and 10 steep or gentle? Give evidence from the orthophoto map to substantiate the answer.
Steep ✓
The contour lines on the orthophoto map are close together ✓ (1 + 1) (2)
2.3 Refer to the area demarcated in RED on the topographical map which represents the area covered by the orthophoto map.
2.3.1 Calculate the area of the demarcated area in km². Show ALL calculations. Marks will be awarded for calculations.
Formula: Area = length x breadth
Length = 10.3 cm ✓ x 0,5 = 5.15 km Range: 5.1 km to 5.2 km
(10.2 cm - 10.4 cm)
Breadth = 9.9 cm ✓ x 0,5 = 4,95 km Range: 4.9 km to 5.0 km
(9.8 cm - 10.0 cm)
= 5.15 km ✓ x 4.95 km ✓
= 25.49 km² ✓ Range:24.99 km² to 26.00 km²
[Accept other formulae to calculate length and breadth] (5 x 1) (5)
2.3.2 The area demarcated in RED on the topographical map represents the area covered by the orthophoto map. Why do the features on the orthophoto map look larger than the same features on the topographic map?
- The scale of the orthophoto map is larger/bigger ✓
- The scale of the topographic map is smaller ✓
- The scale of the orthophoto map is 1 : 10 000 and the scale of the topographic map is 1 : 50 000 ✓
- The scale of the orthophoto map is five times larger than that of the topographic map ✓
- The scale of the topographic map is five times smaller than that of the orphophoto map ✓
(Any ONE) (1 x 1) (1)
[20]
QUESTION 3: APPLICATION AND INTERPRETATION
3.1 Refer to block B2.
3.1.1 What is the purpose of the fire break in block B2?
- To reduce/stop the risk of veld fires spreading ✓
- To protect cultivated lands/area from veld fires ✓
(Any ONE) (1 x 1) (1)
3.1.2 Explain why these fire breaks are especially necessary in July.
- Volksrust receives the lowest rainfall in July ✓✓
- Volksrust receives 1 mm of rainfall in July ✓✓
- Volksrust is very dry in July ✓✓
- Greater chance of veld fires ✓✓
- The area could experience warm dry berg winds which increases chances of veld fires ✓✓
- The soil is dry and lacks moisture ✓✓
- Vegetation is dry and can burn easily ✓✓
(Any ONE) (1 x 2) (2)
3.1.3 Identify a human-made drainage feature in block B2 that could be used to extinguish fires.
- Dams ✓ (1 x 1) (1)
3.1.4 Identify the economic sector that will be most affected by veld fires in block B2. Give a reason from the topographical map to substantiate the answer.
- Economic sector: Primary economic sector ✓
Reason: The major activity in block B2 is crop farming/cultivation ✓✓
(1 + 2) (3)
- Economic sector: Primary economic sector ✓
3.2 Refer to blocks D8 and H5 on the topographic map. Give a reason why there are a marsh and vlei in block D8 but not in block H5.
- The gradient is gentle (flat land) in D8 resulting in more infiltration and a greater chance of forming marshes and vleis ✓✓
- The gradient is steep in H5 resulting in more run-off and a smaller chance of forming marshes and vleis ✓✓
- (Clay) soil has poor drainage and can be easily saturated in D8 ✓✓
(Any ONE) (1 x 2) (2)
3.3 Refer to blocks D8 and D9 showing a marsh and vlei and cultivated lands.
3.3.1 Explain how the marsh and vlei affected the location of the cultivated lands.
AWAY FROM
- The cultivated lands are situated away from the marsh and vlei ✓✓
- The cultivated lands are situated around the marsh and vlei ✓✓
CLOSE TO
- Situated next to marsh and vlei ✓✓
(Any ONE) (1 x 2) (2)
- Situated next to marsh and vlei ✓✓
3.3.2 Give a reason for your answer to QUESTION 3.3.1.
AWAY FROM
- (Clay) soil could form which could result in almost impermeable soil ✓✓
- Heavy rainfalls could cause the marsh and vlei to expand and flood the cultivated lands adjacent to it ✓✓
- Land is over-saturated (water logged) and cannot be farmed ✓✓
CLOSE TO
- Accessibility to water supply for irrigation ✓✓
(Any ONE) (1 x 2) (2)
- Accessibility to water supply for irrigation ✓✓
3.4 Refer to the Volksrust urban area on the topographical and orthophoto maps.
3.4.1 The Burgess concentric model and the Hoyt sector model are two examples of models of urban structure. Which ONE of these two models compare the best to the Volksrust urban area?
- Hoyt sector model ✓ (1 x 1) (1)
3.4.2 Give ONE reason for your answer to QUESTION 3.4.1.
- The town developed in sectors along the transport routes/main roads and railway lines ✓✓
- The low income sector is next to the (heavy) industrial sector ✓✓
- The high income sector is a distance away from the low income sector/the (heavy) industrial sector ✓✓
(Any ONE) (1 x 2) (2)
3.4.3 Urban expansion of the Volksrust urban area is hindered (limited) in a southerly direction, although there is enough space to do so. What is the main reason for this?
- The provincial boundary found in the south will limit the expansion of Volksrust ✓✓ (1 x 2) (2)
3.5 Maize is one of the agricultural products that are farmed in the Volksrust area.
3.5.1 Refer to the information on page 3 and state how the distribution of rainfall throughout the year promotes the maize industry in the Volksrust area.
- Volksrust has a season of good rainfall in summer that coincides with the planting season of maize ✓
- Low rainfall allows for maize to dry during winter ✓
- High average rainfall of 648 mm ✓
(Any ONE) (1 x 1) (1)
3.5.2 Name ONE economic justice (benefit) for the inhabitants of Volksrust created by the maize industry.
- It creates employment ✓✓
- It improves the peoples GDP per capita ✓✓
- It brings in more investment to Volksrust ✓✓
- It improves the infrastructure/transport networks ✓✓
- Tax money generated allows for the improvement of services ✓✓
- Provides raw material for secondary industries/promotes industrial growth ✓✓
(Any ONE) (1 x 2) (2)
3.5.3 Describe an environmental injustice (damage to the natural environment) caused by maize farming.
- Natural vegetation is removed (deforestation) to plant maize ✓✓
- It involves monoculture farming and could increase soil erosion ✓✓
- Food webs/chains are destroyed ✓✓
- The natural habitat of the fauna/animals are destroyed ✓✓
- Decreases biodiversity ✓✓
- Contamination of groundwater supplies by pesticides and herbicides ✓✓
(Any ONE) (1 x 2) (2)
3.5.4 Explain a measure (step) that the government can take to prevent maize farming in the woodland areas in block C2.
- Woodland areas can be declared as protected areas which will stop maize farming from taking place ✓✓
- Buffering by putting a fence around the woodlands ✓✓
- Legislation to protect the woodland ✓✓
(Any ONE) (1 x 2) (2)
[25]
QUESTION 4: GEOGRAPHICAL INFORMATION SYSTEMS (GIS)
4.1 Refer to the image below.
|
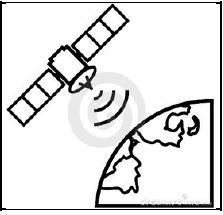
4.1.1 Which GIS method was used by the satellite above to gather information?
- Remote sensing ✓ (1 x 1) (1)
4.1.2 Data gathered by a satellite is not always user-friendly. Which GIS process is used to ensure that data can be used by all people?
- Data standardisation ✓
- Data processing ✓
- Data manipulation ✓
(Any ONE) (1 x 1) (1)
4.1.3 Images from the satellite were used to construct the topographical map. Explain how South African topographical maps are standardised.
- The symbols used on the topographic maps are standard/the same ✓✓
- The scale of 1 : 50 000 is used on all South African topographic maps ✓✓
- All South African topographic maps use the Gauss Conform Projection ✓✓
- The contour intervals are always 20 m ✓✓
- The sheet index is consistent ✓✓
- Linear scale evident on all maps ✓✓
- The magnetic declination for the map is always indicated ✓✓
- The use of alpha-numeric grid cells ✓✓
(Any TWO) (2 x 2) (4)
4.2 Answer QUESTION 4.2.1 in the blocks below. 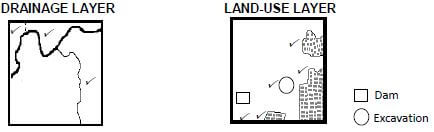
(Any ONE line feature) (Any ONE polygon feature)
4.2.1 Draw ONE example of the following layers in block G8 in the blocks above. Use the correct conventional signs (map symbols).
- Drainage layer as a line feature (Refer to sketch)
- Land-use as a polygon feature or an area feature (Refer to sketch)
(2 x 1) (2)
4.2.2 Identify ONE attribute of the drainage layer in block G8.
- Name of the stream/river (is Slang River) ✓
- Amount of tributaries joining the stream/river (5 tributaries join0 ✓
- Is the stream/river perennial or non-perennial (Main stream is perennial and tributaries are perennial and non-perennial) ✓
- Stream meanders ✓
- The topography over which the stream/river flows (is gentle) ✓
- The length and width of the stream/river (length of stream approximately 2 200 m) ✓
- The order of the stream/river ✓
- Direction of flow (general flow direction W/SW)✓
(Any ONE) (1 x 1) (1)
4.2.3 State ONE advantage of single data-layer maps.
- It can be used to create thematic maps ✓✓
- It makes it easier to use for specific purposes e.g. a map showing roads only makes it easier to interpret for traveling purposes ✓✓
- To solve a query dealing with a specific issue ✓✓
- Less confusing as there is less detail ✓✓
(Any ONE) (1 x 2) (2)
4.3 The urban and regional planner of the town wants to expand the golf course (7 on the orthophoto map). How can he/she use GIS to decide on the most suitable area for the development?
- The person can compare the topography of the different areas to find the topography that is most suitable ✓✓
- The person can compare the soil fertility of different areas ✓✓
- The person will look at the drainage of the different areas/Water for expansion ✓✓
- Can determine what impact the development will have on job opportunities ✓✓
- Can determine the accessibility/transport network of the newly planned development ✓✓
- The person can compare the existing aesthetic appeal of the areas of possible development ✓✓
(Any TWO) (2 x 2) (4)
[15]
TOTAL: 75