GEOGRAPHY PAPER 1 GRADE 12 ANNEXURE - NSC PAST PAPERS AND MEMOS FEBRUARY/MARCH 2017
Share via Whatsapp Join our WhatsApp Group Join our Telegram GroupGEOGRAPHY
PAPER 1
GRADE 12
NSC PAST PAPERS AND MEMOS
FEBRUARY/MARCH 2017
ANNEXURE
FIGURE 1.1: SYNOPTIC WEATHER MAP 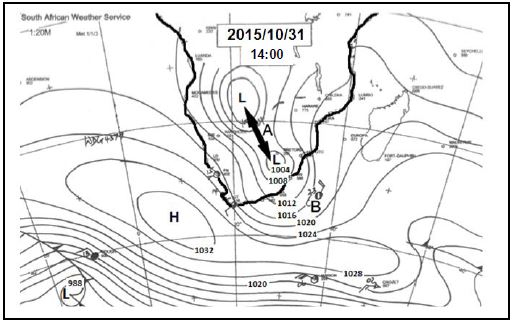
[Source: South African Weather Service]
FIGURE 1.3: MID-LATITUDE CYCLONE OVER THE USA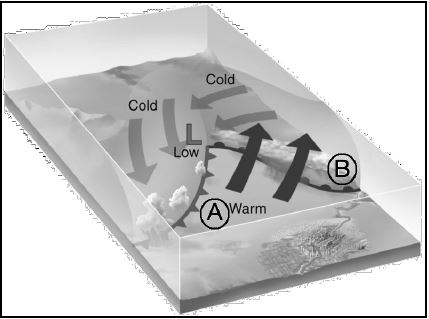
[Source: http://www.geog.ucsb.edu/~joel/g110_w08/lecture_notes/midlat_surface]
FIGURE 1.4: URBAN HEAT ISLAND 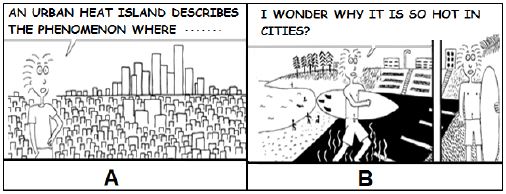
[Adapted from Stuart McMillencartoons.recombinant.records]
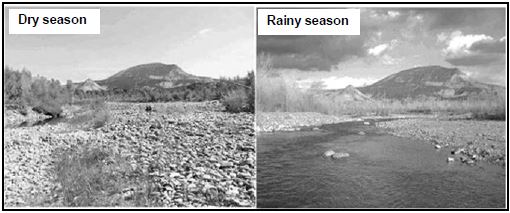
FIGURE 1.5: A RIVER
![]()
[Source: http://greatecology.com/restoring-ecosystems-lessons-science]
FIGURE 1.6: TYPES OF RIVER FLOW 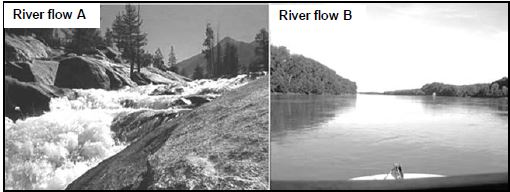
[Source: http://www.spikehampson.com/images/missouri_river_scenery.jpg]
FIGURE 2.2: DIFFERENT DRAINAGE PATTERNS 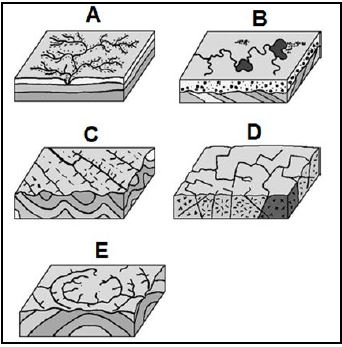
[Adapted from Geography GCSE]
FIGURE 2.3: TRACKS OF TROPICAL CYCLONES IN THE USA 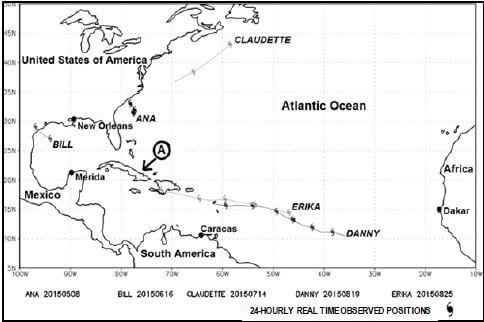
[Adapted from http://www.metoffice.gov.uk/data/tropicalcyclone/tctracks/nat15.gif]
FIGURE 2.4: ANTICYCLONES OVER SOUTHERN AFRICA 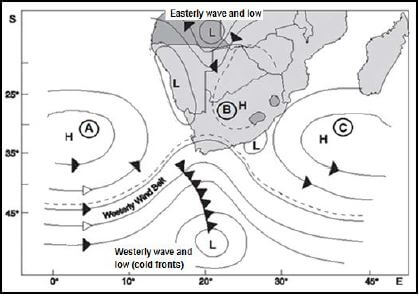
[Adapted from http://icesjms.oxfordjournals.org/content/62/1/33/F1.large.jpg]
FIGURE 2.5: RIVER REJUVENATION 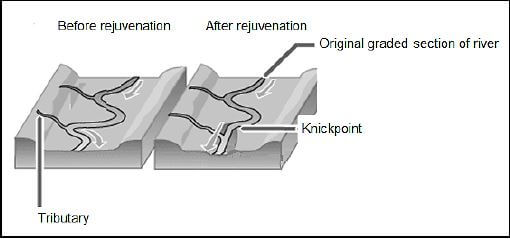
[Source: http://www.alevelgeography.com/wp-content/uploads/2013/11/inc2.gi]
FIGURE 2.6: CATCHMENT AREAS IN SOUTH AFRICA
CASE STUDY ON RIVER MANAGEMENT: SOUTH AFRICAN CATCHMENTS AREAS Covering many South African river basins, the 'Working for Catchments' programme operates in all major catchment areas. [Adapted from http://wwf.panda.org/about_our_earth/about_freshwater] |
FIGURE 3.2: TYPES OF INDUSTRIES 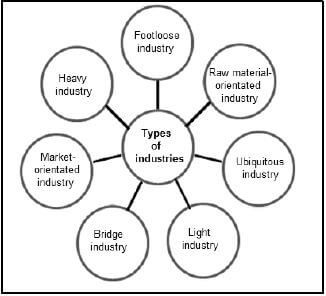
[Source: Examiner's own graphic]
FIGURE 3.3: SATELLITE IMAGE OF A RURAL SETTLEMENT SITUATED ON THE INTERIOR PLATEAU IN SOUTH AFRICA 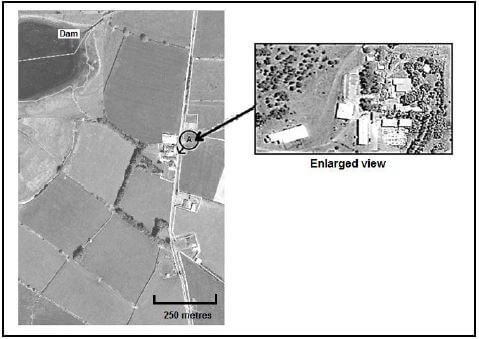
[Adapted from Google Earth]
FIGURE 3.4: DATA ON LAND RESTITUTION 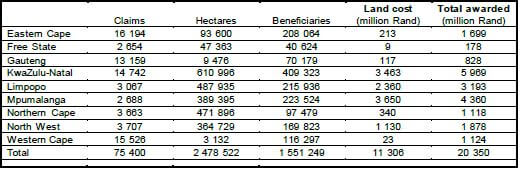
[Source: http://www.iea.org.uk/sites/default/files/publications/files/uldeconomicAffairs]
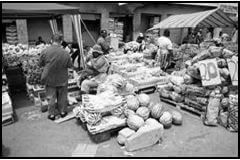
FIGURE 3.5: INFORMAL TRADING IN SOUTH AFRICA
INFORMAL TRADERS PLAY A BIG ROLE IN SOUTH AFRICA'S ECONOMY Contributed: by Farhaanah Mahomed, 12 February 2015 [Adapted from http://www.cnbcafrica.com/news/southern-africa/2014/10/29/smes-informal-sector] |
FIGURE 3.6: FOOD INSECURITY
ENDING GLOBAL HUNGER Toni Muir As many as 795 million people around the world suffer under food insecurity. The majority of these people live in developing countries. There are a lot of empty, rumbling bellies mainly in the rural areas of Asia and Africa. 75% of the world's hungry live in rural areas. 50% of the small-scale farmers grow subsistence crops relying on family labour. [Source: SAWUBONA, September 2015] |
FIGURE 4.3: RURAL-URBAN MIGRATION
HOPE Susanne Melda, 26 November 2012 Rural-urban migration is believed to affect various dimensions of migrants' well-being. Desires, such as the opportunity to improve the standard of living and better services, are not always met. [Adapted from www.migratingoutofpoverty.org] |
FIGURE 4.4: URBAN PROFILE 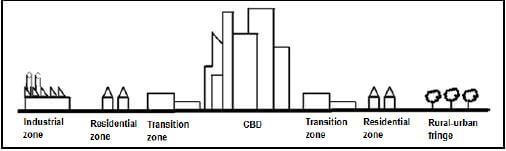
[Source: Examiner's own sketch]
FIGURE 4.5: SOUTH AFRICA'S DECLINING MINING SECTOR
PATEL: SA'S MINING SECTOR 'IN TROUBLE' 5 August 2015 11:03 Sarah Evans, Reuters Economic Development Minister Ebrahim Patel says South Africa's mining industry is 'in trouble' as it struggles to recover from 23 000 job losses since April, and falling commodity prices from key markets like China. 'Job growth over the last three months has been fairly vigorous, but the mining industry is in trouble,' Patel said in an interview on Talk Radio 702 on Wednesday. [Adapted from http://mg.co.za/article/2015-08-05g] |
FIGURE 4.6: SPATIAL DEVELOPMENT INITIATIVES 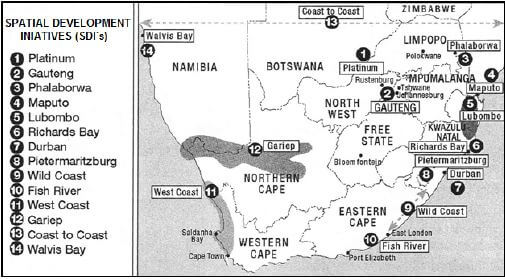
[Source: www.mindset.co.za]