LIFE SCIENCES SCHOOL BASED ASSESSMENT EXEMPLARS - CAPS GRADE 12 TEACHER'S GUIDE
Share via Whatsapp Join our WhatsApp Group Join our Telegram GroupLIFE SCIENCES
SCHOOL BASED ASSESSMENT EXEMPLARS - CAPS
GRADE 12
TEACHER GUIDE
| TABLE OF CONTENTS | |||
| Contents | Page | ||
| 1 | Introduction | 3 | |
| 2 | Aims of the project | 3 | |
| 3 | Programme of formal assessment in Life Sciences | 4 | |
| 3.1 | Practical tasks | 5 | |
| 3.2 | Research Project | 5 | |
| 3.3 | Assignment | 6 | |
| 3.4 | Tests and Examinations | 6 | |
| 4 | Scope of the project | 7 | |
| 5 | Quality assurance process followed | 7 | |
| 6 | Assessment tasks | 8 | |
| 6.1 | Practical Task 1 – Surveying human characteristics | 8 | |
| 6.2 | Practical Task 2 – Simulating natural selection | 10 | |
| 6.3 | Assignment 1 – Response to the environment | 13 | |
| 6.4 | Assignment 2 – Reproduction | 20 | |
| 6.5 | Test – Nucleic acids and meiosis | 25 | |
| 7 | Marking guidelines | 30 | |
| 7.1 | Practical Task 1 – Surveying human characteristics | 30 | |
| 7.2 | Practical Task 2 – Simulating natural selection | 32 | |
| 7.3 | Assignment 1 – Response to the environment | 34 | |
| 7.4 | Assignment 2 – Reproduction | 41 | |
| 7.5 | Test – Nucleic acids and meiosis | 48 | |
1. Introduction
Assessment is a continuous planned process of identifying, gathering and interpreting information about the performance of learners, using various forms of assessment. It involves four steps: generating and collecting evidence of achievement, evaluating this evidence, recording the findings and using this information to understand and assist in the learners’ development to improve the process of learning and teaching. Assessment should be both informal (Assessment for Learning) and formal (Assessment of Learning). In both cases regular feedback should be provided to learners to enhance the learning experience.
School-based assessment (SBA) forms part of the formal assessment component. It is a purposive collection of learners’ work that tells the story of the learners’ efforts, progress or achievement in attaining knowledge (content, concepts and skills) in the subject. The advantages of school-based assessment can be summarised as follows:
- It provides a more balanced and trustworthy assessment system, increasing the range and diversity of assessment tasks.
- It improves the reliability of assessment because judgements are based on many observations of the learner over an extended period of time.
- It empowers teachers to become part of the assessment process and enhances collaboration and sharing of expertise within and across schools.
- It has a professional development function, building up practical skills in teacher assessment which can then be transferred to other areas of the curriculum.
School-based assessment forms part of a year-long formal Programme of Assessment in each grade and subject. The assessment tasks should be carefully designed to cover the content of the subject as well as the range of skills and cognitive levels that have been identified in specific aims. Tests, practical tasks, assignments and projects make up the SBA component in Life Sciences.
Teachers should ensure learners understand the assessment criteria and have extensive experience using it for self- and peer assessment in informal situations before conducting a planned formal assessment activity. Teachers should also have used these criteria for informal assessment and teaching purposes before they conduct any formal assessment so that learners are familiar with the criteria and the assessment process.
2. Aims of the project
Through this publication it is envisaged that TEACHER capacity will be increased in respect of each of the following:
- Differentiating among the nature of the different types of assessment tasks (assignments, projects, practical tasks, tests and examinations)
- Developing assessment tasks that are balanced in terms of cognitive levels, topics and skills
- Developing a marking guideline that:
- Is appropriate to the task
- Clearly shows mark allocation and distribution
- Includes alternative answers
- Developing tasks that contain a variety of question types
Through this publication it is also envisaged that LEARNERS will benefit by:
- Developing an understanding of the differences amongst the nature of the various types of assessment tasks
- Being exposed to assessment tasks that are of the same standard as those that they are exposed to during the course of the year
3. Programme of formal assessment in Life Sciences
- This includes all assessment tasks that make up the formal programme of assessment for the year.
- Formal assessment tasks are marked and recorded by the teacher for promotion and certification purposes.
- All tasks must be subjected to pre- and post-moderation to ensure that appropriate standards are maintained.
- The table that follows shows the number and types of assessment tasks required in the Grade 12 year.
Formal, recorded, school-based assessment | Trial (Preliminary) examination | ||
Content | Practical | Two written examination papers (2½ hours + 2½ hours) | |
|
|
This examination must test:
| |
School-based assessment (during the year) | |||
Term 1 | Term 2 | Term 3 and Term 4 | |
|
|
| |
33⅓% | 33⅓% | 33⅓% | |
Convert to 50% | 50% | ||
SBA Total: 100 | |||
NOTE: The SBA mark must be converted to 25% and the external examination counts 75% of the final mark.
A description of the requirements for each of the different types of assessment tasks follows below.
3.1 Practical tasks
When designing the practical tasks, the Life Sciences teacher must ensure that:
- All 7 skills under Specific Aim 2 listed below are covered over the three practical tasks:
- Follow instructions
- Handle equipment or apparatus
- Make observations
- Record information or data
- Measure accurately
- Interpret information
- Design/Plan an investigation
- At least ONE of the practical tasks includes manipulation of apparatus and/or collection of data.
- Any ONE practical task assesses at least 3 of the 7 skills and must include skill 6 and/or 7.
- 20–40 marks are allocated to a practical task.
3.2 Research Project
At least ONE of the tasks across Grades 10–12 must be a research project.
When designing the research project, the Life Sciences teacher must ensure that it:
- Is a long-term task (at least 3 weeks of non-contact time)
- Has a maximum mark of 100
- covers Specific Aims 1, 2 and 3
- Is recorded in Term 3 even if it is given and assessed in Term 1 or Term 2
- Is an investigative task
- Focuses on accessing knowledge through literature research as well as through primary sources such as people
- Includes sub-skills such as:
- Formulating investigative questions and hypotheses
- Gathering information from a variety of sources
- Manipulating and processing information
- Analysing information
- Identifying patterns
- Evaluating data
- Drawing valid conclusions
- Communicating findings
3.3 Assignment
At least ONE of the tasks across Grades 10–12 must be an assignment.
When designing an assignment, the Life Sciences teacher must ensure that it:
- Is a short-term task (1½-2 hours under controlled conditions)
- Has a maximum mark of 100
- Covers Specific Aims 1, 2 and 3
- Is completed at school and not at home
- Is recorded in Term 3 even if it is given and assessed in Term 1 or Term 2
- Covers a variety of topics
- Includes as many as possible of the following:
- Analysing and interpreting data
- Making drawings
- Plotting graphs
- Drawing tables
- Performing calculations
- Justifying conclusions
3.4 Tests and Examinations
When designing the tests as well as the mid-year and trial examinations, the Life Sciences teacher must ensure that:
- The test is a minimum of 50 marks.
- The test in Term 1 covers all work done in that term.
- The tests in Term 2 and Term 3 cover at least half of the work covered in the respective terms.
- The mid-year examinations cover work completed in Term 1 and Term 2.
- The trial examinations cover all work completed in Terms 1, 2 and 3, and must include the section on ‘Human Impact’ from Grade 11.
- Mainly Specific Aims 1 and 3 are covered.
- Specific Aim 2 (knowledge and understanding of investigations and practical work) is also included, but in a smaller proportion compared to Specific Aims 1 and 3.
- Tests and examinations are balanced in terms of cognitive levels and topic weightings. In this regard weighting grids must be used.
- Tests and examinations are analysed diagnostically and appropriate remedial and intervention strategies are instituted.
- Tests and examinations follow the external examination in its design, rigour and format.
4. Scope of the project
This publication includes the following:
- Requirements for the Grade 12 Programme of Assessment for the Life Sciences CAPS curriculum
- A description of the various types of assessment tasks (assignment, project, practical task and test)
- Exemplar assessment tasks (assignment, practical task and test)
- Marking Guidelines for each assessment task
The following exemplars together with their marking guidelines have been included in this publication:
Type of assessment task included in this publication | Number included in this publication | Number required in the Grade 12 year | Term in which assessment task is required |
Assignment | 2 | 1 | Term 3 |
Practical task | 2 | 3 | Term 1, Term 2, Term 3 or 4 |
Test | 1 | 3 | Term 1, Term 2, Term 3 or 4 |
5. Quality assurance process followed
A team of experts comprised of teachers and subject advisors from provinces was appointed by the DBE to develop and compile assessment tasks. They were required to extract excellent examples of learner tasks from their respective schools and districts. The panel of experts spent a period of four days at the DBE, developing tasks based on guidelines and policies. Moderation and quality assurance of the tasks were undertaken by national and provincial examiners and moderators. The assessment tasks were further refined by the national internal moderators to ensure that they were in line with the CAPS document.
6. Assessment tasks
6.1 Practical Task 1 – Surveying human characteristics
| Topic | Genetics | ||
| Specific aim(s) | SA 2 | Type of activity | Individual |
| Marks | 30 | Duration | 90 minutes |
Task
Conduct a survey of the occurrence/frequency of dominant and recessive phenotypes for each of three traits/ characteristics (as shown in the pictures below) among the learners in your school.
- This task must be done individually.
- This practical must be completed at school.
Background information
Many characteristics in humans are controlled by one gene with two alleles, one dominant and one recessive. Three examples are shown below. 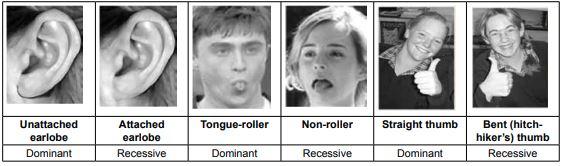
Method
- Select 20 learners that will form part of your sample.
- For every learner selected, record the phenotype for each characteristic.
- Record the information for each learner in a table. At the end of the table, include the percentage of learners displaying each phenotype for each of the three characteristics.
- Answer the questions set.
QUESTIONS
- List any FOUR planning steps for this investigation. (4)
- In terms of the investigation about the type of earlobe (free or attached), name the following:
2.1 The dependent variable (1)
2.2 The independent variable (1) - Formulate a hypothesis for the frequency of tongue-rollers as compared to non-rollers in your school. (3)
- Construct a table to show the results obtained in this investigation. (4)
- According to the results obtained, would you accept or reject the hypothesis formulated in QUESTION 3? (1)
- State TWO ways in which you could make the results of this investigation more reliable. (2)
- Using the same system of axes, draw a bar graph to represent the percentage of learners displaying each phenotype for each of the three characteristics. (8)
- Use the symbols R (tongue-roller) and r (non-roller) to represent the phenotypes and genotypes of offspring resulting from a cross between two heterozygous individuals. (6)
[30]
6.2 Practical Task 2 – Simulating natural selection
| Topic | Evolution | ||
| Specific aim(s) | SA 2 | Type of activity | Pair/ Individual |
| Marks | 30 | Duration | 60 minutes |
Task
Simulate ‘natural selection’ using a paper model.
- This task must be done in pairs but the questions must be answered individually.
- This practical must be completed at school.
Background information
A simulation allows one to demonstrate something that might sometimes be dangerous or that might sometimes require a lot of time, quickly and in a simple and safe way, using models.
The different parts that comprise the paper model in this task represent different components in nature. The sheet of newspaper and the sheet of white paper represent two different environmental conditions. The circles cut from white paper and from newspaper represent the different appearances/phenotypes of different individuals of the same species.
Aim
You are required to investigate the survival of the organisms with the two different phenotypes under different environmental conditions.
Materials required
- A sheet of white paper (preferably A3 size) to use as background
- A sheet of newspaper (cut to A3 size) to use as background
- Forceps/tweezers
- Clock with a second hand/stopwatch
- Scissors
- 30 x 2 cm diameter circles cut from another sheet of newspaper
- 30 x 2 cm diameter circles cut from another sheet of white paper
- Ruler
Method
- Place the sheet of white paper on the table.
- Spread 30 white paper circles and 30 newspaper circles randomly over the surface of the white paper.
- Ask your partner to use a pair of forceps/tweezers to pick up as many circles as he/she can in a period of 15 seconds.
- Count the number of each type of circle that has been picked up. Record this in the table provided.
- Now repeat steps 1–4 using the sheet of newspaper instead of the sheet of white paper.
Question 1.
- Formulate a hypothesis for the above investigation when using the sheet of white paper as background. (3)
- For this investigation, name:
2.1 The dependent variable (1)
2.2 The independent variable (1)
2.3 Any TWO fixed variables (2) - Copy and record your results in the following table: (2)
DIFFERENT
BACKGROUNDSSTARTING POPULATION
NUMBER OF CIRCLES
PICKED UP ON DIFFERENT BACKGROUNDSWhite paper circles
Newspaper circles
White paper circles
Newspaper circles
White paper
30
30
Newspaper
30
30
Draw a bar graph on the same system of axes to represent the results of your investigation. (8)
Explain the difference in results obtained for the two types of circles when using the sheet of white paper. (3)
State ONE way in which you could improve the reliability of the results. (1)
- State a conclusion for the above investigation when the newspaper was used as a background. (3)
- Based on the results obtained, will you accept or reject the hypothesis you formulated in QUESTION 1? (1)
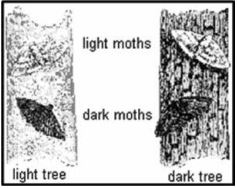
- Explain how this investigation and the results of this investigation simulate natural selection as it occurs in the peppered moth. Use the picture below to help you make a comparison. (5)

[30]
6.3 Assignment 1 – Response to the environment
| Topic | Response to the environment | ||
| Specific aim(s) | SA 1, SA 2, SA 3 | Type of activity | Individual |
| Marks | 100 | Duration | 90 minutes |
Instructions and information
- Answer ALL questions.
- Number the answers correctly according to the numbering system used in this question paper.
- Draw diagrams and flow charts ONLY when requested to do so.
- This assignment is to be done under controlled conditions and must be handed in at the end of the session.
NOTE: If it is not possible to schedule a single 90-minute session for this assignment, then SECTION A can be done on one day in a 45-minute session and SECTION B the following day in another 45-minute session.
________________________________________________________________________
SECTION A
QUESTION 1
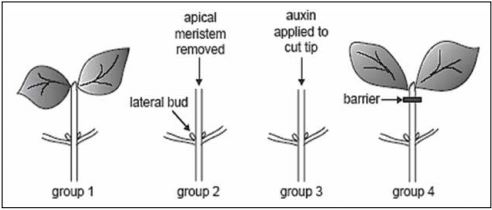
An investigation was conducted to study apical dominance in bean plants. Four groups of plants were used. The diagram below illustrates the process.
 |
The results are shown in the table below.
Group 1 | Group 2 | Group 3 | Group 4 | |
Treatment given | Untreated | Apical meristem removed | Apical meristem removed and auxin applied to the cut tip | Apical meristem intact but a barrier to the movement of substances was placed under the tip |
Response to treatment given | Growth of apical meristem but not of lateral buds | Growth of lateral buds | No growth of lateral buds | Growth of lateral buds |
1.1 For this investigation, state the: (1)
1.1.1 Independent variable (1)
1.1.2 Dependent variable (2)
1.1.3 Any TWO fixed variables (3)
1.2 Formulate a possible hypothesis for the above investigation. (4)
1.3 Explain the difference in results for Groups 3 and 4. (1)
1.4 Do the results allow you to accept or reject the hypothesis you formulated in QUESTION 1.2? [12]
QUESTION 2
The diagrams below show some stages in an investigation involving germinating bean seeds, kept in an evenly warm, damp environment. 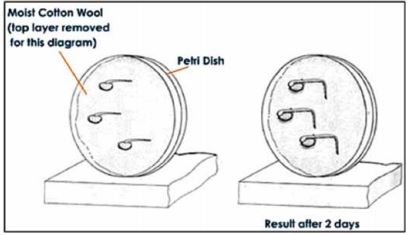
2.1 What physical stimulus leads to the response above? (1)
2.2 Using the information in the diagram and your own knowledge, describe how the tip of the root grows in the direction that it does after two days. (6)
2.3 State TWO functions (other than growth movements and apical dominance) of the hormone responible for the growth movement illustrated above. (2)
2.4 Will the same results be obtained if the investigation is carried out in a dark cupboard? (1)
2.5 Explain your answer to QUESTION 2.4. (2)
2.6 Explain why the cotton wool was kept moist. (2)
[14]
QUESTION 3
Read the passage below and answer the questions that follow.
DIABETES MELLITUS Diabetes mellitus is a disorder relating to the role of insulin. There are two forms of the condition: insulin-dependent diabetes (IDDM) and a non-insulin dependent form (NIDDM). |
The normal plasma glucose level is 100 mg/100 ml. The glucose tolerance test was conducted for three adults and the plasma glucose level (mg/100 ml) was recorded for two hours at 30-minute intervals. The results are shown below.
Time (minutes) | 0 | 30 | 60 | 90 | 120 | |
Plasma glucose levels (mg/100 ml) | Adult 1 | 85 | 125 | 100 | 85 | 80 |
Adult 2 | 130 | 215 | 250 | 260 | 240 | |
Adult 3 | 100 | 210 | 180 | 170 | 160 |
3.1 State how the glucose tolerance response test above is used to decide if a person is suffering from diabetes. (2)
3.2 Adult 1 is not diabetic.
3.2.1 Describe the changes expected in insulin secretion in Adult 1 during the period 30 minutes to 90 minutes after the glucose drink.
3.2.2 Explain your answer to QUESTION 3.2.1. (2)
3.3 Draw two line graphs on the same set of axes to show the glucose tolerance of Adults 1 and 2. (9)
3.4 What was the percentage increase in glucose level when the glucose was at its maximum in Adult 2? Show all working. (3)
3.5 Write down the plasma glucose level of the three adults after two hours as a ratio in simple whole numbers. Show all working. (2)
3.6 Suggest, with reasons, what would happen to insulin secretion for Adult 2:
3.6.1 If the condition was IDDM (2)
3.6.2 If the condition was NIDDM (2)
[24]
TOTAL SECTION A: 50
SECTION B
QUESTION 4
Read the passage and information below and answer the questions that follow.
STIMULUS AND RESPONSE The eagle and the rabbit are dependent for their survival on their nervous system response rate. Their eye, ear and skin sensors send messages along sensory neurons to the central nervous system. The message is transferred by interneurons to provide a response along motor neurons demanding that the muscles move quickly. |
Two learners conducted an investigation in the following way to determine which sense organ sends the message fastest to the brain: the eye, the ear or the skin (sight, hearing, or touch):
- Vusi held a meter stick between his thumb and index finger just above the 100 cm mark, while Mary placed her thumb and forefinger at the 0 mark on both sides of the stick with just the thumb touching it.
- As Vusi dropped the meter stick Mary attempted to catch it by closing her thumb and forefinger. The distance on the meter stick that the stick fell before Mary caught it was recorded and the procedure was repeated three times.
- They repeated the investigation to determine hearing and skin responses. For the hearing response, Mary was blindfolded and reacted to Vusi shouting ‘DROP’ when he let go of the stick. For the skin response, Mary was blindfolded again. Vusi tapped Mary’s free hand when he let go of the stick.
The results they obtained are shown in the following table:
Trial number | Distance on meter stick (cm) | ||
Sight | Hearing | Touch | |
1 | 2 | 5 | 10 |
2 | 3 | 6 | 8 |
3 | 2 | 6 | 9 |
Average distance (cm) | 2,3 | X | 9 |
4.1 Name the path that is described in the passage. (2)
4.2 In relation to this path, what term is used to describe each of the following in terms of the role they play?
4.2.1 The muscles (1)
4.2.2 Skin sensors (1)
4.3 Why should you advise the two learners to repeat the procedure more than three times for each investigation? (2)
4.4 Identify the following in their investigation:
4.4.1 The dependent variable (1)
4.4.2 The independent variable (1)
4.5 Calculate the average distance that the meter stick fell when doing the ‘hearing’ investigation. Show all working. (3)
4.6 Study the graph below showing how the distance on the meter stick can be converted to reaction time in milliseconds. 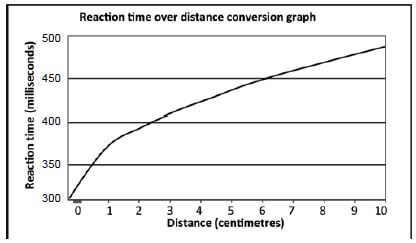
Use the reaction time over distance conversion graph to determine:
4.6.1 The actual reaction time if the meter stick dropped 9 centimetres (2)
4.6.2 The distance the ruler will drop for a reaction time of 400 milliseconds (2)
[15]
QUESTION 5
The graph shows the speed of a nerve impulse along neurons with different diameters, measured in micrometres (μm).
|
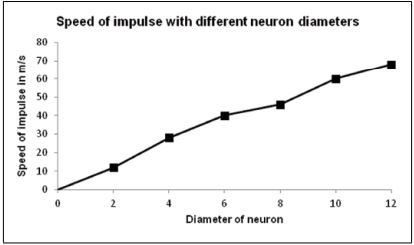
5.1 Describe the relationship between the diameter of a neuron and the speed of an impulse travelling along the neuron. (2)
5.2 Use the graph to estimate how fast an impulse would travel along a neuron with a diameter of 5 μm. (2)
5.3 Name the functional gap found between two neurons across which impulses are transmitted. (1)
5.4 Explain the significance of the myelin sheath that covers the neurons. (2)
5.5 Draw a diagram to illustrate the structure of a motor neuron. Indicate the direction of the impulse by means of an arrow in the diagram. (7)
[14]
QUESTION 6
A person sitting in a darkened room covers one eye. A dim electric bulb, positioned at varying distances from the person, is switched on at one-minute intervals for a period of 9 seconds. During this period the diameter of the pupil of the eye is measured. The results obtained are shown in the table below. Study the table and answer the questions that follow.
Time interval | 1 | 2 | 3 | 4 | 5 | 6 | 7 | 8 | 9 |
Diameter of pupil (mm) | 2 | 4 | 5 | 5 | 8 | 7 | 3 | 1 | 6 |
6.1 Name the structure in the eye that controls the size of the pupil. (1)
6.2 Between which TWO time intervals did the following changes in the diameter of the pupil occur?
6.2.1 Smallest increase (2)
6.2.2 Biggest decrease (2)
6.3 State why the size of the pupil changes from interval 8 to interval 9. (2)
6.4 Describe how the size of the pupil changes from interval 8 to interval 9. (4)
6.5 Why is the response in QUESTION 6.3 referred to as a ‘reflex’? (1)
6.6 What is the significance of this reflex? (1)
6.7 At which time interval was the bulb the furthest from the eye? (1)
6.8 Explain your answer to QUESTION 6.7. (2)
6.9 State TWO ways in which the investigator could ensure that the results of this investigation are reliable. (2)
6.10 State THREE things that must be kept constant in this investigation to ensure that it is valid. (3)
[21]
TOTAL SECTION B: 50
GRAND TOTAL: 100
6.4 Assignment 2 – Reproduction
| Topic | Reproduction | ||
| Specific aim(s) | SA 1, SA 2, SA 3 | Type of activity | Individual |
| Marks | 100 | Duration | 90 minutes |
Instructions and information
- Answer ALL questions.
- Number the answers correctly according to the numbering system used in this question paper.
- Draw diagrams and flow charts ONLY when requested to do so.
- This assignment is to be done under controlled conditions and must be handed in at the end of the session.
NOTE: If it is not possible to schedule a single 90-minute session for this assignment, then SECTION A can be done on one day in a 45-minute session and SECTION B the following day in another 45-minute session.
________________________________________________________________________
SECTION A
QUESTION 1
Read the text below and then answer the questions that follow.
REPRODUCTIVE STRATEGIES OF THE BULLFROG Most amphibians spend at least part of their lives in moist surroundings, and their fragile, jelly-like eggs are usually laid in water. |
1.1 State the type of fertilisation (external or internal) that occurs in bullfrogs and describe how it occurs. State whether reproduction in bullfrogs is viviparous, oviparous or ovoviviparous.(3)
1.2 Explain your answer to QUESTION 1.2. (1)
1.3 Describe TWO characteristics of a frog’s egg. (2)
1.4 Give TWO reasons suggested in the article for bullfrog eggs to be laid in water. (2)
1.5 Frog eggs are vulnerable to predators, since there is little or no parental protection. (2)
1.6 Explain THREE strategies that ensure a good survival rate of tadpoles.
[16]
QUESTION 2
The electron micrograph below is that of the human sperm. Study the micrograph and answer the questions that follow.
|
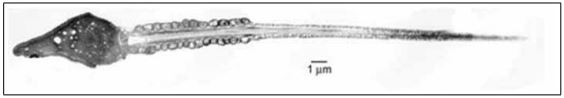
2.1 Draw a labelled line diagram of the human sperm represented in the electron micrograph. (6)
2.2 Use the scale line provided to calculate the width of the sperm at its widest point. (4)
2.3 Explain THREE ways in which the sperm is structurally suited for its role in fertilisation. (6)
[16]
QUESTION 3
Records of human fertility for the period 1941 to 1990 have shown changes in the sperm counts of normal men. The table below summarises the changing percentages of men with high or low sperm counts over a period of 50 years.
TIME PERIOD | MEN WITH HIGH SPERM COUNTS (%) | MEN WITH LOW SPERM COUNTS (%) |
1941–1950 | 50 | 4 |
1951–1960 | 45 | 5 |
1961–1970 | 28 | 11 |
1971–1980 | 21 | 14 |
1981–1990 | 15 | 18 |
3.1 During which time period was there:
3.1.1 The highest percentage of men with low sperm counts? (1)
3.1.2 The lowest percentage of men with high sperm counts? (1)
3.1.3 The greatest difference between men with high sperm counts and men with low sperm counts? (1)
3.2 Describe the trend for men with low sperm counts, and compare it with those with high sperm counts over the period of 50 years. (2)
3.3 Calculate the percentage increase in men with low sperm counts from 1971 to 1990. (2)
3.4 Suggest TWO reasons for the trend described in QUESTION 3.2. (2)
[9]
QUESTION 4
The table below shows the results of a survey on the use of contraceptives by a sample of women in a rural area.
CONTRACEPTIVE | NUMBER OF WOMEN |
Sterilisation | 34 |
Pill | 38 |
Condom | 22 |
Rhythm method | 30 |
None | 76 |
TOTAL | 200 |
Draw a pie chart to show the results of the survey. Show all working. [9]
TOTAL SECTION A: 50
SECTION B
QUESTION 5
The diagram below shows the changes in the ovary, uterus and level of hormones during a 28-day menstrual cycle. Study the diagram and answer the questions that follow.
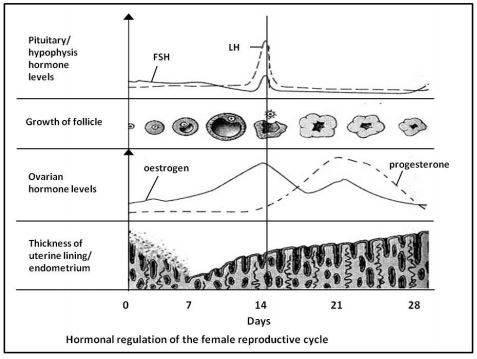 |
5.1 Which hormone is responsible for:
5.1.1 Ovulation (1)
5.1.2 Primary (first) thickening of the endometrium (1)
5.2 According to the graph, on which day(s) does each of the following occur:
5.2.1 Menstruation (1)
5.2.2 Ovulation (1)
5.3 Two structures in the ovaries are responsible for the secretion of two female hormones.
5.3.1 Name the TWO structures and the hormones they secrete. (4)
5.3.2 Give evidence from the graph to support your answer to QUESTION 5.3.1. 4)
5.4 Explain the interaction that occurs between the hormones FSH and progesterone and why it is necessary. (3)
5.5 Is the female, whose cycle is represented in the diagram, pregnant? (1)
5.6 Give TWO reasons from the graph for your answer to QUESTION 5.5. (2)
[18]
QUESTION 6
The table below shows the average human foetal length of males and females over a 40-week gestation period.
Time (weeks) | Foetal length (cm) | |
Male | Female | |
8 | 1 | 1 |
13 | 7 | 7 |
16 | 14 | 13 |
24 | 33 | 31 |
36 | 46 | 43 |
40 | 51 | 49 |
6.1 Draw TWO sets of bar graphs on the same system of axes to compare male and female foetal length over time. (9)
6.2 State TWO conclusions that could be drawn from the results in the graph. (4)
[13]
QUESTION 7
John and Mary have two children. The oldest is Patrick, followed by Anne, a girl. Mary is pregnant again.
7.1 By representing a genetic cross, show the percentage probability of them having another daughter. (7)
7.2 Mary and John’s first child is a haemophiliac and they are afraid that their third child may also have the disorder. Mary is a carrier of haemophilia and John has the normal clotting factor. An ultrasound scan shows that Mary is expecting a girl. (7)
Show, using a genetic cross, the percentage probability of their third child having haemophilia.
7.3 Use the following symbols to construct a simple pedigree diagram showing the inheritance of haemophilia in this family: 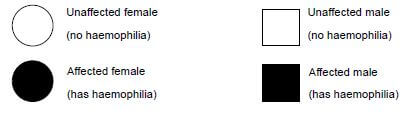 (5)
(5)
[19]
TOTAL SECTION B: 50
6.5 Test – Nucleic acids and meiosis
| Topic | Nucleic acids and meiosis | ||
| Specific aim(s) | SA 1, SA 3 | Type of activity | Individual |
| Marks | 50 | Duration | 60 minutes |
Instructions and information
- Answer ALL questions.
- Number the answers correctly according to the numbering system used in this question paper.
- Draw diagrams and flow charts ONLY when requested to do so.
- This test is to be done under controlled conditions and must be handed in at the end of the session.
SECTION A
QUESTION 1
1.1 Various possible options are provided as answers to the following questions. Choose the answer and write only the letter (A–D) next to the question number (1.1.1–1.1.5) in the ANSWER BOOK, for example 1.1.6 D.
1.1.1 All nucleic acids are made up of …
- deoxyribose sugars, nitrogenous bases and phosphates.
- sugars, nitrogenous bases and phosphates.
- ribose sugars, nitrogenous bases and phosphates
- sugars, nitrogenous bases and sulphates.
1.1.2 If a DNA molecule contains 20 000 base molecules, of which 20% are cytosine, how many adenine molecules will be present?
- 1 000
- 2 000
- 6 000
- 8 000
1.1.3 DNA replication ensures that all daughter cells formed as a result of …
- mitosis, have identical genetic material.
- meiosis, have identical genetic material.
- mitosis, have half the number of chromosomes as the parent cell.
- meiosis, have half the number of chromosomes as the parent cell.
1.1.4 In individuals with normal haemoglobin, the mRNA for haemoglobin includes the codon GAA. This sequence is changed in individuals with sickle cell anaemia so that their mRNA has a codon GUA at the same location. This suggests that the DNA has undergone a mutation involving a change of base sequence from ...
- CAA to TAA.
- CTT to CAT.
- CUU to CAT.
- CTT to CTA.
1.1.5 The result of profiling various DNA samples in a criminal investigation is shown below. 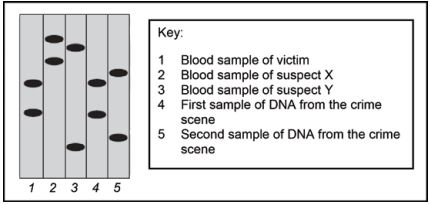
Which conclusion about the crime could the DNA analyst draw?
- Only suspect X was involved.
- Only suspect Y was involved.
- Suspects X and Y were both involved.
- Neither suspect X nor suspect Y was involved. (5 x 2) (10)
1.2 Give the correct biological term for each of the following descriptions. Write only the term next to the question number (1.2.1–1.2.4) in the ANSWER BOOK.
1.2.1 Specific lengths of DNA which carry codes for specific characteristics of organisms
1.2.2 The part of protein synthesis taking place in the nucleus
1.2.3 The bonds between the two strands of a DNA molecule
1.2.4 The chromosome condition/ploidy of a somatic cell (4)
1.3 Indicate whether each of the statements in COLUMN I applies to A only, B only, both A and B or none of the items in COLUMN II. Write A only, B only, both A and B, or none next to the question number (1.3.1–1.3.3) in the ANSWER BOOK.
COLUMN I | COLUMN II | ||
1.3.1 | Chromatids separate and move to the poles. | A: B: | Anaphase I Anaphase II |
1.3.2 | The strand of DNA that provides the code during replication. | A: B: | Template Complementary strand |
1.3.3 | Contain bases that are complementary to that of DNA. | A: B: | Codon Anticodon |
(3 x 2) (6)
TOTAL SECTION A: 20
SECTION B
QUESTION 2
Study the diagram below showing a process that takes place in all living cells. 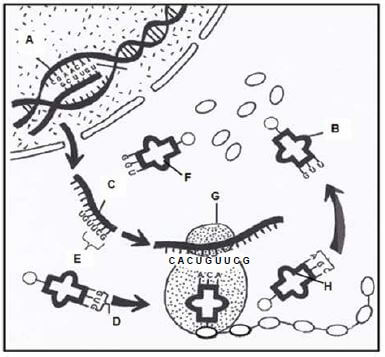
2.1 Identify the process represented in the above diagram. (1)
2.2 Name the specific part of the process mentioned in QUESTION 2.1 that occur at the organelle labelled G. (1)
2.3 Describe the process named in answer to QUESTION 2.2. (5)
2.4 State TWO similarities in structure between molecules B and C. (2)
2.5 The table below indicates the amino acids that are carried by different tRNAs.
tRNA BASES | AMINO ACID | tRNA BASES | AMINO ACID | tRNA BASES | AMINO ACID |
GUU | Glutamine | CUA | Aspartate | GAU | Leucine |
GCG | Arginine | GGU | Proline | UAU | Isoleucine |
CCG | Glycine | ACA | Cysteine | GUG | Histidine |
CUU | Glutamate | AGC | Serine | ACC | Tryptophan |
Identify the amino acids which will be brought to organelle G according to the code provided by the mRNA found on G. (3)
2.6 Write down the triplet of DNA bases that correspond to each of the molecules B, F and H, respectively. (3)
[15]
QUESTION 3
Study the diagrams below that represent different phases of Meiosis I. 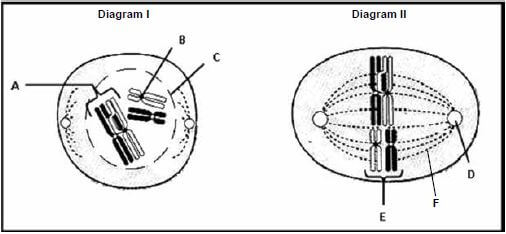
3.1 Identify the structures labelled B and E. (2)
3.2 State TWO functions of the structure labelled F. (2)
3.3 Describe the process shown at A in Diagram I. (2)
3.4 Tabulate TWO ways in which a cell in the phase shown in Diagram II would differ from a cell in the same phase in Meiosis II. (5)
3.5 How many chromosomes will be present in each cell at the end of meiosis? (1)
3.6 If the above cell division occurred in a human being, describe the events leading to the formation of an offspring with Down syndrome. (3)
[15]
TOTAL SECTION B: 30
GRAND TOTAL: 50
7. Marking guidelines
7.1 Practical Task 1 – Surveying human characteristics
-
- Seek permission✓ to conduct the investigation.
- Decide how the learners are to be selected✓ for your sample.
- Identify the 20 learners✓ who will form a part of the sample.
- Arrange a date✓/time/venue for surveying the different characteristics.
- Design a table✓ for recording information.
- Study the different phenotypes for each characteristic✓ in order to correctly identify them. (4) (any 4)
-
2.1 Number of learners ✓ that have free or attached ear lobes (1)
2.2 Characteristic✓/type of ear lobe/attached or unattached earlobes (1) -
- There are more✓ learners✓ in the school that are tongue rollers than non-rollers✓
- There are more✓ learners✓ in the school that are non-rollers than tongue rollers✓
- The number of learners✓ in the school that are tongue rollers is equal✓ to the number of non-rollers✓ (any 1 x 3) (3)
- Allocation of marks for the construction of the table
Criterion
Elaboration
Mark
Caption
Includes both variables: 'number of learners' and 'different characteristics'
1
Appropriate column headings
Includes names of learners as well as dominant and recessive phenotypes for each characteristic
1
Data entered
Information on the observed phenotypes entered per learner for each characteristic
1
Percentage of learners
Shown at the end of the table for the different phenotypes for each characteristic
1
(4)
- Support✓(if the results obtained are in line with the hypothesis stated by the learner in Question 3)
OR
Reject✓ (if the results obtained contradict the hypothesis stated by the learner in (Question 3) (1) -
- Increase the sample size✓
- Repeat the investigation✓ (2)
- Allocation of marks for the graph
Criterion
Elaboration
Mark
Same system of axes
Bar graphs drawn on the same system of axes
1
Caption
Includes both variables: 'number of learners' and 'different characteristics'
1
X-axis
Correct label (phenotypes of each characteristic) Correct scale (equal width and interval of bars)
1
1
Y-axis
Correct label (percentage of learners)
Correct scale
1
1
Plotting of bars
1 mark: 1-5 bars plotted correctly
2 marks: all 6 bars plotted correctly
2
(8)
-
Allocate marks for the following labels:Key Tongue roller: R Non-roller: r P1 phenotype Tongue roller x Tongue roller✓ genotype Rr x Rr✓ meiosis G1 R , r x R , r✓ fertilisation F1 genotype RR ; Rr ; Rr; rr✓ phenotype 3 tongue rollers 1 non-roller ✓
P1/parents and F1/offspring✓
Meiosis and fertilisation✓ (any 6) (6)
[30]
7.2 Practical Task 2 – Simulating natural selection
- More✔ white circles✔ than newspaper circles✔ will be picked up from the white sheet
OR
More✔ newspaper circles✔ than white circles✔ will be picked up from the white sheet
OR
An equal number✔ of newspaper circles✔ and white circles✔ will be picked up from the white sheet 2. (3) -
2.1 Number of circles picked up✔ on different backgrounds (1)
2.2 Different backgrounds✔ (1)
2.3- Same size of newspaper and white paper used as a background✔
- Same size of white and newspaper circles✔
- Same number of white and newspaper circles at the start✔
- Same amount of time allowed for picking up the circles✔
- Same forceps/tweezers used throughout the investigation✔
- Same person used to pick up circles throughout the investigation✔
- Same hand used to pick up circles throughout the investigation✔ (any 2) (2)
- Allocation of marks for table entries
Criterion
Mark
Results not entered
0
Some results entered
1
All results entered
2
(2)
- Allocation of marks for the graph
Criterion
Elaboration
Mark
Same system of axes
Bar graphs drawn on the same system of axes
1
Caption
Includes both variables: 'number of circles' and 'different backgrounds'
1
X-axis
Correct label (Different backgrounds)
Correct scale (equal width and interval of bars)1
1Y-axis
Correct label (number of circles picked up)
Correct scale1
1Plotting of bars
1 mark: 1-3 bars plotted correctly
2 marks: all 4 bars plotted correctly2
(8)
- Fewer✔ white circles✔ were picked up from the white paper, because white circles are not easily seen against the white paper✔
OR
More✔ newspaper circles✔ were picked up from the white paper, because newspaper circles are easily seen against the white paper✔ (3) -
- Increase number of attempts✔ and work out the average number picked
- Repeat the investigation ✔ (any 1) (1)
- More✔ white circles✔ than newspaper circles✔ were picked up from the newspaper background (3)
- Support✓ (if the results obtained are in line with the hypothesis stated by the learner in Question 1)
OR
Reject✓ (if the results obtained contradict the hypothesis stated by the learner in Question 1) (1) -
- The white sheet represents the light tree✓
- and the newspaper sheet represents the dark tree✓.
- The circles represent the moths.✓
- Picking up the circles represents birds feeding on the moths✓.
- More circles of one type rather than the other type being picked up✓ represents natural selection✓ (any 5) (5)
[30]
7.3 Assignment 1 – Response to the environment
QUESTION 1
1.1
1.1.1 Presence/absence of auxins✔ (1)
1.1.2 Growth of lateral buds✔ (1)
1.1.3
- Use bean plants of the same species✔
- Conduct investigation under same environmental conditions✔
- Use bean plants of the same height/age✔ (any 2) (2)
1.2 Auxins✔ at the growing tip of the stem stimulate✔ the growth of lateral buds✔
OR
Auxins✔ at the growing tip of the stem inhibit✔ the growth of lateral buds✔
OR
Auxins✔ at the growing tip of the stem have no effect✔ on the growth of lateral buds✔ (3)
1.3
- Auxin present✔ in Group 3 as it was applied to the tip and therefore it inhibited✔ the growth of the lateral buds
- Auxins not present✔ in rest of stem in Group 4 due to the barrier so lateral buds grew✔/ growth of lateral buds was not inhibited (4)
1.4 Support✓ (if the results obtained are in line with the hypothesis stated by the learner in Question 1.2)
OR
Reject✓ (if the results obtained contradict the hypothesis stated by the learner in Question 1.2) (1)
[12]
QUESTION 2
2.1 Gravity✔ (1)
2.2
- Due to gravity, auxins accumulate✔
- on the lower side of the root✔.
- A high concentration of auxins in the lower part of the root inhibits✔ growth.
- Cells on the upper part of the root grow faster✔
- where the auxin concentration is lower✔.
- The root curves downwards✔.
- It is said to be positively geotropic✔. (any 6) (6)
2.3 Cell division ✔; cell elongation✔; the development of fruit✔; the abscission of leaves and fruit✔; the development of adventitious roots in stem cuttings ✔ (any 2) (2)
2.4 Yes ✔ (1)
2.5 The growth is in response to gravity✔ and not light✔ (2)
2.6 Moisture is essential✔ for germination✔. (2)
[14]
QUESTION 3
3.1 Patient is diabetic if blood glucose level is above 200 mg/100 ml✔ for up to two hours after the glucose test drink✔. (2)
3.2
3.2.1 Insulin level will increase between 30 and 60 minutes✔ and then decrease✔. (2)
3.2.2 The level would initially increase when glucose level is higher than normal✔then decrease when the level of glucose decreases✔. (2)
3.3 Changes in the plasma glucose level during a glucose test over a period of time 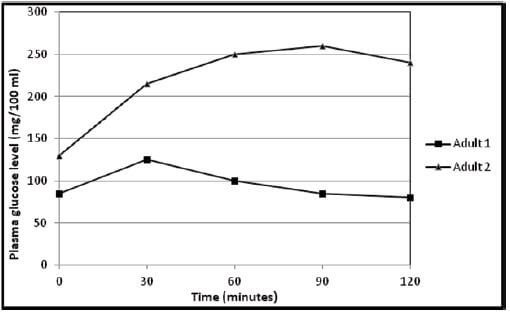
Allocation of marks for the graph
Criterion | Elaboration | Mark |
Same system of axes | Both line graphs drawn on the same system of axes | 1 |
Caption | Includes both variables: ‘time’ and ‘plasma glucose levels’ | 1 |
Key for graphs | Key provided or each graph labelled for Adult 1 and Adult 2 | 1 |
X-axis | Correct label and units (Time in minutes ) Correct scale | 1 1 |
Y-axis | Correct label and units (Plasma glucose level in mg/100 ml) Correct scale | 1 1 |
Plotting of points | 1 mark: 1-9 points plotted correctly 2 marks: all 10 points plotted correctly | 2 |
(9)
3.4
(260 mg/100 ml – 130 mg/100 ml) = 130 ✔
130/130 X 100✔
= 100%✔ (3)
3.5 Adult 1: Adult 2: Adult 3 = 80 :240 :160✔ = 1 :3 :2✔
3.6.1 IDDM - no insulin is produced✔ because the pancreatic cells responsible for insulin secretion are not functioning✔/do not produce insulin. (2)
3.6.2 NIDDM – insulin secretion will increase✔ since the pancreas is not affected✔/cells that normally respond become less sensitive to insulin (2)
[24]
TOTAL SECTION A: 50
SECTION B
QUESTION 4
4.1 Reflex arc ✓ ✓ (2)
4.2
4.2.1 Effectors✓ (1)
4.2.2 Receptors✓ (1)
4.3 To improve ✓the reliability✓ of the investigation (2)
4.1
4.4.1 Distance on meter stick/reaction time ✓ (1)
4.4.2 Different senses (sight/hearing/touch) ✓ (1)
4.5
5 cm + 6 cm + 6 cm = 17 cm ✓
17 cm = 5,7 cm ✓
3 ✓ (3)
4.6
4.6.1 475 ✓ milliseconds ✓ (2)
4.6.2 3✓ cm✓
[15]
QUESTION 5
5.1 As the diameter of the neuron increases✔ the speed of the impulse increases✔ (2)
5.2 35✔m/s✔ (2)
5.3 Synapse✔ (1)
5.4 It provides electrical insulation✔ thus increasing the speed of impulse transmission✔ (2)
5.5 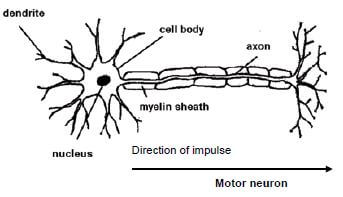
Allocation of marks for the drawing
Caption | 1 |
Label lines do not cross | 1 |
Any four correct labels | 4 |
Direction of impulse correctly shown | 1 |
(7)
[14]
QUESTION 6
6.1 Iris✔ (1)
6.2
6.2.1 2✔to 3✔ (2)
6.2.2 6✔ to 7✔ (2)
6.3 Dim light conditions✔ causes pupil to adjust so that more light can enter✔ the eye (2)
6.4
- Radial muscles✔ of iris contract✔
- Circular muscles✔of iris relax✔
- Pupil dilates✔ (any 4) (4)
6.5 It occurs automatically✔/involuntarily/without the control of the will (1)
6.6 It protects✔ the eye from damage in bright conditions (1)
6.7 Interval 5✔ (1)
6.8 Diameter of the pupil✔ was at its widest✔ (2)
6.9
- Repeat the investigation✔
- Take more than one reading at each time interval✔
- Increase the time of exposure to light at each time interval✔ (any 2) (2)
6.10
- Use the same light bulb✔
- Same eye must be covered✔ throughout the entire investigation
- Same person must be used✔ for the entire investigation (3)
[21]
TOTAL SECTION B: 50
GRAND TOTAL: 100
7.4 Assignment 2 – Reproduction
SECTION A
QUESTION 1
1.1 Fertilisation occurs externally ✔ (1)
Eggs are released into the water and then male releases sperms✔ which fertilise eggs in the water✔ (2) (3)
1.2 Oviparous✔ (1)
1.3
- Eggs are laid✔
- and the embryos develop outside the mother’s body within the eggs✔ (2)
1.4
- Eggs are small ✔
- Eggs are protected by a gelatinous mass and membranes✔ (2)
1.5
- Prevents drying out✔
- Easier for frog sperm to reach the eggs✔ (2)
1.6
- Large numbers of eggs are produced✔ because many are eaten✔
- Eggs hatch into tadpoles within 3-5 days✔ which ensures that they can swim away from predators✔
- Nearby plant matter shelters hatching tadpoles✔ preventing them from being eaten✔ (6)
[16]
QUESTION 2
2.1 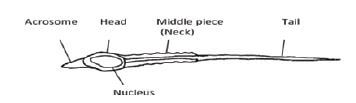 (6)
(6)
Allocation of marks for the drawing
Criterion | Mark |
Size and proportion | 1 |
Caption | 1 |
Any 4 correct labels | 4 |
2.2
1 µm = 4 mm✔
Width of sperm = 12 mm✔ = X µm
1 µm = 4 mm
X µm = 12 mm ✔
X = 3 µm ✔ (4)
2.3
- The acrosome produces enzymes ✔ which help the sperm to penetrate the ovum ✔
- The middle piece of the sperm contains mitochondria ✔ that supply the energy for the sperm’s activity✔
- A tail is present✔ to move the sperm through the seminal fluid✔ (6)
[16]
QUESTION 3
3.1
3.1.1 1981–1990 ✔ (1)
3.1.2 1981–1990 ✔ (1)
3.1.3 1941–1950 ✔ (1)
3.2 Men with low sperm counts have increased ✔ while men with high sperm counts have decreased ✔ (2)
3.3
% increase = 18- 14 ✔
= 4 ✔ % (2)
3.4
- Changed diets✔/eating more processed foods by men have caused the change
- Increased stress✔/changed lifestyle has caused the change (2)
[9]
QUESTION 4
CALCULATIONS:
34÷200 x 360 = 61,2º (rounded down to 61º)
38÷200 x 360 = 68,4º (rounded down to 68º)
22÷200 x 360 = 39,6º (rounded up to 40º)
30÷200 x 360 = 54º
76÷200 x 360 = 136,8º (rounded up to 137º) 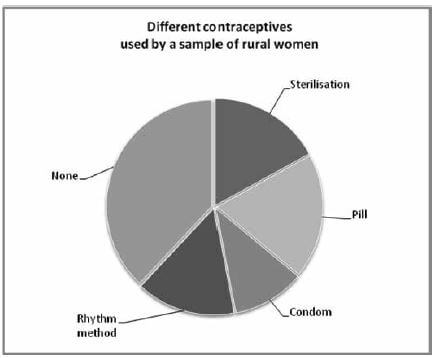
Allocation of marks for the graph
Criterion | Elaboration | Mark |
Calculations/working to determine the correct proportions | 3 marks: All five calculations correct | 3 |
Caption | Includes both variables: ‘contraceptives’ and ‘number of rural women’ | 1 |
Proportions accurate for each sector labelled | 5 marks: All five sectors correct (1 x mark/sector) | 5 |
[9]
TOTAL SECTION A: 50
SECTION B
QUESTION 5
5.1
5.1.1 LH ✔ (1)
5.1.2 Oestrogen ✔ (1)
5.2
5.2.1 0–7 days ✔ (1)
5.2.2 Day 14 ✔ (1)
5.3
5.3.1
- Graafian follicle ✔ - oestrogen ✔
- Corpus luteum ✔ - progesterone ✔ (4)
5.3.2
- When Graafian follicle is formed ✔
- there is an increase in oestrogen ✔
- When corpus luteum is formed ✔
- there is an increase in progesterone✔ (4)
5.4
- An increase in progesterone level ✔
- inhibits the release of FSH✔
- to prevent FSH from stimulating the development of an ovum✔
- since no further ova are required if pregnancy results✔ (any 3) (3)
5.5 No ✔ (1)
5.6
Corpus luteum has degenerated ✔
Progesterone has decreased✔
FSH started to increase at the end of the cycle✔ (any 2) (2)
[18]
QUESTION 6
6.1 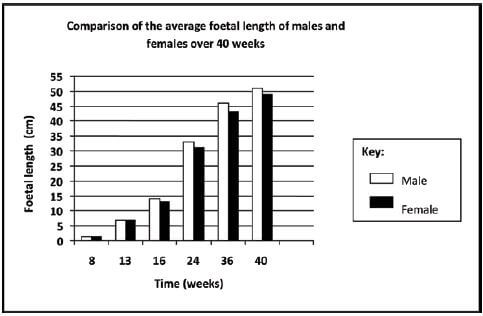
Allocation of marks for the graph
Criterion | Elaboration | Mark |
Same system of axes | Bar graph drawn on the same system of axes | 1 |
Caption | Includes both variables: ‘time’ and ‘foetal length’ | 1 |
Key for graphs | Key provided or each graph labelled for ‘males’ and ‘females’ | 1 |
X-axis | Correct label and units (Time in weeks) Correct width and interval of bars | 1 1 |
Y-axis | Correct label and units (Foetal length in cm) Correct scale | 1 1 |
Plotting of bars | 1 mark: 1-11 bars plotted correctly 2 marks: all 12 bars plotted correctly | 2 |
6.2
- Average foetal length of both males and females✓ are the same from 8 to 13 weeks✓ (9)
- Average foetal length of males is greater✓ than the average foetal length of females from 16 to 40 weeks✓
- Average foetal length increases for males and females✓ over the 40-week period ✓ (any 2 x 2) (4)
[13]
QUESTION 7
7.1
Key | Male: XY | Female: XX | |
| P1 phenotype | Male | x | Female✓ |
| genotype | XY | x | XX✓ |
| meiosis | |||
| G1 | X , Y | x | X✓ |
| fertilisation | |||
| genotype | XX ; XY✓ | ||
| F1 phenotype | 1 Male : 1 Female✓ | ||
| 50% probability of being a female✓* | |||
Allocate marks for the following labels:
P1/parents and F1/offspring✓
Meiosis and fertilisation✓ (1 compulsory* + 6 others) (7)
7.2
Key | Normal: H | Haemophiliac : h | |||
| P1 phenotype | Normal father | x | Normal mother✓ | ||
| genotype | XHY | x | XHXh ✓ | ||
| meiosis | |||||
| G1 | XH ; Y | x | XH ; Xh ✓ | ||
| fertilisation | |||||
| F1 genotype | XH XH | XH Xh | XH Y | Xh Y ✓ | |
| phenotype | 2 normal daughters | 1 normal son | 1 son with haemophilia | ||
| 0% probability✓* of a child with haemophilia | |||||
(1 compulsory* + 6 others)
(7)
7.3 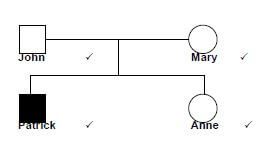
(5)
[19]
TOTAL SECTION B: 50
GRAND TOTAL: 100
7.5 Test – Nucleic acids and meiosis
SECTION A
QUESTION 1
1.1
1.1.1 B✓✓
1.1.2 C✓✓
1.1.3 A✓✓
1.1.4 B✓✓
1.1.5 D✓✓ (5 x 2) (10)
1.2
1.2.1 Genes✓
1.2.2 Transcription✓
1.2.3 Weak hydrogen bonds✓
1.2.4 Diploid✓ (4)
1.3
1.3.1 B only✓✓
1.3.2 A only✓✓
1.3.3 A only✓✓ (3 x 2) (6)
TOTAL SECTION A: 20
SECTION B
QUESTION 2
2.1 Protein synthesis✔ (1)
2.2 Translation✔ (1)
2.3
- According to the mRNA codons✓
- tRNA with matching anticodons✓
- bring the required amino acids✓ to the ribosome
- The amino acids become attached by peptide bonds✓
- to form the required protein✓ (any 5) (5)
2.4
- Both are single-stranded
- Both are made up of ribose sugar
- Presence of cytosine, guanine, adenine and uracil (any 2) (2)
2.5 Histidine ✔ cysteine ✔ serine ✔ (3)
2.6 GTT ✔ GGT ✔ AGC ✔ (3)
[15]
QUESTION 3
3.1
B – centromere✔ (2)
E – homologous chromosomes✔/bivalent
3.2
- They allow for attachment of chromosomes✔ (2)
- They contract to pull the chromosomes/chromatids to the poles✔
3.3 Crossing over✔ takes place Chromatids overlap✔
Segments of chromatids are exchanged✔ (any 2) (2)
3.4
Meiosis I | Meiosis II |
1. Chromosomes line up in their homologous pairs at the equa tor✔ | 1. Single chromosomes line up at the equator✔ |
Table ✔ (5)
3.5 Two✔ (1)
3.6
- Chromosome number 21 fails to separate✔
- during anaphase 1✔
- Gametes will be formed with 24 chromosomes/one extra copy of chromosome number 21✔
- If such a gamete fuses with a normal gamete with 23 chromosomes✔
- The resulting zygote will have 47 chromosomes✔ (any 3) (3)
[15]
TOTAL SECTION B: 30
GRAND TOTAL: 50