GEOGRAPHY SCHOOL BASED ASSESSMENT EXEMPLARS - CAPS GRADE 12 TEACHER'S GUIDE
Share via Whatsapp Join our WhatsApp Group Join our Telegram GroupGEOGRAPHY
SCHOOL BASED ASSESSMENT EXEMPLARS - CAPS
GRADE 12
TEACHER'S GUIDE
| TABLE OF CONTENTS | ||||
| 1 | Introduction | 3 | ||
| 2 | Objectives/Aims of the project | 4 | ||
| 3 | Assessment tasks as outlined by CAPS | 5 | ||
| 4 | Programme of assessment tasks | 6 | ||
| 4.1 | Types of tasks | 6 | ||
| 4.2 | Compliance with CAPS requirements | 6 | ||
| 4.3 | Assessment of skills | 6 | ||
| 4.4 | Guidelines for research tasks | 7 | ||
| 4.4.1 | Teachers’ guidelines for conducting research | 7 | ||
| 4.4.2 | Guidelines for research | 7 | ||
| 4.4.3 | Compiling a bibliography for a research task | 10 | ||
| 4.4.4 | Proposed cover page for a research task | 11 | ||
| 5 | Quality assurance processes followed | 12 | ||
| 6 | Assessment tasks | 12 | ||
| 6.1 | Research tasks | 12 | ||
| 6.1.1 | Exemplar: Research task 1 | 12 | ||
| 6.1.2 | Exemplar: Research task 2 | 14 | ||
| 6.1.3 | Proposed marking rubric for research tasks | 16 | ||
| 6.2 | Data-handling tasks | 20 | ||
| 6.2.1 | Exemplar: Data-handling task 1 | 19 | ||
| 6.2.2 | Exemplar: Data-handling task 2 | 23 | ||
| 6.2.3 | Marking memoranda/Guidelines for data-handling tasks | 27 | ||
| 7 | Conclusion | 31 | ||
1. Introduction
Assessment is a continuous planned process of identifying, gathering and interpreting information about the performance of learners, using various forms of assessment. It involves four steps: generating and collecting evidence of achievement; evaluating this evidence; recording the findings and using this information to understand and assist with the learners’ development to improve the process of learning and teaching. Assessment should be both informal (assessment for learning) and formal (assessment of learning). In both cases regular feedback should be provided to learners to enhance the learning experience.
School-based assessment (SBA) is a purposive collection of learners’ work that tells the story of learners’ efforts, progress or achievement in given areas. The quality of SBA tasks is integral to learners’ preparation for the final examinations. This booklet serves as a resource of four exemplar SBA tasks to schools and subject teachers of Geography. SBA marks are formally recorded by the teacher for progression and certification purposes. The SBA component is compulsory for all learners. Learners who cannot comply with the requirements specified according to the policy may not be eligible to enter for the subject in the final examination.
The formal assessment tasks provide the teacher with a systematic way of evaluating how well learners are progressing. This publication includes tests, a project and a case study. Formal assessment tasks form part of a year-long formal programme of assessment. These tasks should not be taken lightly and learners should be encouraged to submit their best possible efforts for final assessment.
The teachers are expected to ensure that assessment tasks are relevant to and suitable for the learners being taught. Teachers should adapt the tasks to suit learners’ level of understanding and should be context-bound; however, they should also take cognisance of the requirements as set out in the Curriculum and Assessment Policy Statement (CAPS) document.
This publication comprises four tasks that address the demands of the Grade 12 Geography curriculum. It is expected that these tasks will serve as a valuable resource to:
- Geography teachers, providing examples of the types and standard of school-based assessment tasks that would be appropriate for their learners
- Grade 12 Geography learners, providing material that will assist them in their preparation for the CAPS examinations in Geography
2. Objectives/Aims of the project
- School-based assessment provides a more balanced and trustworthy assessment system, increasing the range and diversity of assessment tasks.
- The exemplar tasks are aimed at reflecting the depth of the curriculum content appropriate for Grade 12.
- They reflect the desired cognitive demands as per Bloom’s revised taxonomy: remembering, understanding, applying, analysing, evaluating and creating.
- School-based assessment improves the validity of assessment by including aspects that cannot be assessed in formal examination settings.
- It improves the reliability of assessment because judgements are based on many observations of the student over an extended period of time.
- There is a beneficial effect on teaching and learning, not only in relation to the critical analysis and evaluation of Geography information and creative problem-solving, but also on teaching and assessment practices.
- It empowers teachers to become part of the assessment process and enhances collaboration and sharing of expertise within and across schools.
- It has a professional development function, building up teachers’ skills in assessment practices which can then be transferred to other areas of the curriculum.
- The tasks focus on the content of the National Curriculum Statement (NCS) , and contain exposure to all aspects of the new content of the Curriculum and Assessment Policy Statement (CAPS) effective from 2014.
The distinctive characteristics of SBA (and its strengths as a relatively small component of a coherent assessment system) have implications for its design and implementation, in particular the nature of the assessment tasks and the role of the teacher in standardisation procedures. These implications are summarised as follows:
- The assessment process should be linked to and be a logical outcome of the normal teaching programme, as teaching, learning and assessment should be complementary parts of the whole educational experience (i.e. the SBA component is not a separate once-off activity that can be timetabled or prepared for as if it were a separate element of the curriculum).
- The assessment process should provide a richer picture of what learners can do than that provided by the external examination, by taking more samples over a longer period of time and by more closely approximating real-life and low-stress conditions (i.e. the SBA component is not a once-off activity done under pseudo-examination conditions by unfamiliar assessors).
- The formative/summative distinction exists in SBA, but is much less rigid and fixed than in a testing culture, i.e. learners should receive constructive feedback and have opportunities to ask questions about specific aspects of their progress after each planned SBA assessment activity, which both enhances Geography skills and helps learners prepare for the final external examination (i.e. the SBA component is not a purely summative assessment).
- The SBA process, to be effective, has to be highly contextualised, dialogic and sensitive to learners’ needs, i.e. the SBA component is not and cannot be treated as identical to an external exam in which texts, tasks and task conditions are totally standardised and all contextual variables controlled. To attempt to do so would be to negate the very rationale for SBA, hence schools and teachers must be granted a certain degree of trust and autonomy in the design, implementation and specific timing of the assessment tasks.
Teachers should ensure that learners understand the assessment criteria and their relevance for self- and peer assessment. Teachers should also use these criteria for informal assessment and teaching purposes before they conduct any formal assessment, so that they are familiar with the criteria and the assessment process.
The project provides exemplar tasks that are aimed at:
- Reflecting the depth of the Geography curriculum content appropriate for Grade 12
- Reflecting the desired cognitive demands as per Bloom’s revised taxonomy: remembering, understanding, applying, analysing, evaluating and creating
- Containing questions and sub questions that reflect appropriate degrees of challenge: easy, medium and difficult
- Focusing on the content of the National Curriculum Statement (NCS), effective in 2013, and containing exposure to all aspects of the new content of the Curriculum and Assessment Policy Statement (CAPS), effective from 2014.
3. Assessment tasks as outlined by CAPS
Term 1 | Term 2 | Term 3 | Term 4 |
|
|
| |
|
|
|
|
SBA mark which comprises 25% of final mark (100 marks) | 75% of final mark (300 marks) |
Term | Task | Total | SBA weight | Total | |
1 | Data handling | 60 | 20 | 100 (25%) | |
Standardised test | 100 | 10 | |||
2 | Mapwork task | 60 | 20 | ||
June Paper 1 | 200 | 300 | 10 | ||
June Paper 2 | 100 | ||||
3 | Research/Essay writing task | 60 | 20 | ||
Standardised test | 100 | 10 | |||
Trial Paper 1 | 225 | 300 | 10 | ||
Trial Paper 2 | 75 | ||||
4 | External Paper 1 | 225 | 300 | 300 (75%) | |
External Paper 2 | 75 | ||||
4. Programme of assessment tasks
4.1 Types of tasks
- Research tasks (one task to be completed)
- Data handling (one task to be completed)
4.2 Compliance with CAPS requirements
The types of tasks and number of tasks are fully compliant with CAPS. Compliancy is outlined under point 3. The content covered by each of these tasks is indicated with each task. The content covered by each task is included in the curriculum and may be tested in any external examination.
4.3 Assessment of skills
The following skills are assessed. Some/All of these skills may be tested in any external examination.
- Gathering data
- Interpreting data
- Analysing data
- Comparing different sets of data
- Representing data in written, graphic or mapped format
- Problem-solving
- Drawing conclusions
- Hypothesis statements
4.4 Guidelines for research tasks
4.4.1 Teachers’ guidelines for conducting research
Research framework for assessment (Guideline on administration of research task)
RESEARCH ACTIVITIES | STEPS | MARKS | LENGTH | TIMEFRAME |
Formulate the hypothesis | 1 | 5 | No more than 50 words | One week |
Background information about the study area | 2 | 6 | A4 size or smaller | |
Mapping | 3 | 5 | 75 to 100 words | |
Data collection | 4 | 6 | 75 to 100 words | Two weeks |
Analysis and synthesis of data | 5 | 15 | 300 to 450 words | One week |
Recommendations and possible solutions | 6 | 6 | 75 to 100 words | |
Conclusion – accept or reject the hypothesis | 7 | 5 | No more than 50 words | One week |
Bibliography | 8 | 4 | ||
Cover page | 3 | |||
Presentation | 5 | |||
TOTAL | 60 | |||
Submission | 9 | Due date | ||
In choosing a topic for research, isolate topics in specific areas in the Geography NCS/CAPS content, for example human-environment interactions.
- Human-environment interaction in rural settlements
- Human-environment interaction in urban settlements
4.4.2 Guidelines for research
Research Task
Step 1: Formulating a hypothesis/problem statement
As Geographers we seek to understand and explain the interactions amongst humans, and between humans and the environment in space and time. This is achieved by asking questions or making informed geographical decisions. This entails the development of a hypothesis or a problem statement to be tested.
- You have to choose a specific area of study where a geographical problem exists.
- During this stage, a geographical question showing a problem is asked.
- Identify the problem from a local area.
- Formulate a hypothesis or a problem statement. (Hypothesis research is used to prove that certain variables are dependent on or independent of each other. Problem statement research is only to highlight that a specific problem exists in a specific community.)
- You should then follow the steps of research to ensure that the geographical question is answered.
A possible hypothesis in Settlement Geography: Rural-urban migration 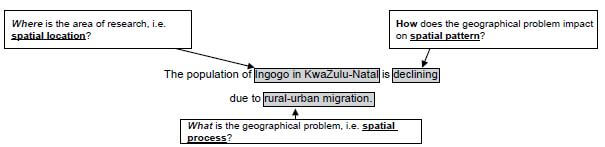
A possible hypothesis in Geomorphology: Catchment and river management 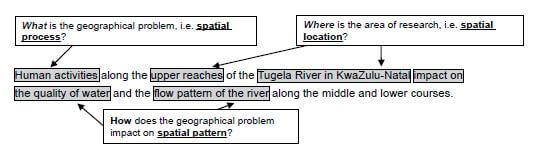
Other possible hypothesis-type research examples:
- The value of property along north-facing slopes is higher than the value of property along south-facing slopes in Meyersdal, Gauteng (choose local area).
- The cause of rural-urban migration in Ndwedwe, KwaZulu-Natal (choose local area), is the lack of service delivery in the health sector.
- Climate change will impact negatively on grape farming and related industries in the Western Cape.
- The closing down of many primary schools in Lusikisiki (Eastern Cape) (choose a local area) is due to a decline of the population in the age group 7 to 15 years.
- The poor condition of roads (specify the names of the roads) leading to/in Harrismith, Free State (choose local area), is due to the lack of proper planning by the local municipality.
- The impact of building a dam along the Jukskei River in Gauteng (choose local area) upstream of Alexandra will reduce flooding and the subsequent loss of life in Alexandra.
- The e-toll system will impact negatively on the economic position of people using private transport in Gauteng.
- The e-toll system will impact positively on traffic flow to the major urban centres in Gauteng.
- Informal settlements in the Vhembe district of Limpopo have low levels of development due to the lack of provision of basic needs (choose ONE informal settlement in your local area.)
- Overcrowding of informal settlements is due to the lack of proper planning by the local government (choose local area).
Step 2: Background information about an area of study
- You must explain where in South Africa the study area is located. (This can be indicated on the map.)
- Describe the study area in terms of its exact position (degrees, minutes and seconds).
- Provide relevant information about the area, for example population of the area or climate of the area.
Step 3: Mapping
- You must provide a map of the area in question.
- During this stage you must create a buffer zone around the area where the geographical problem exists.
- The map should have a clear legend/key and must be drawn to scale. The scale must be indicated on the map.
- If the map used covers a wider area, buffer zones around the area of study should be created.
- The map used should be the most recent map of the study area.
Step 4: Methods of data collection
- PRIMARY DATA SOURCES
- The use of questionnaires
- Interviews
- Observations
- Field trips
- SECONDARY DATA SOURCES
- Newspaper articles
- Government department statistics
- Books
- Internet
Step 5: Analysis and synthesis of data
- Learners must use collected data now to formulate a discussion around the existing geographical problem.
- At this stage learners should represent some of the information graphically where necessary, for example graphs and sketches.
- Learners must analyse graphic information during this stage.
Step 6: Recommendations and possible solutions
- Learners should now make recommendations to solve the geographical problem in question.
- Learners should present their original and realistic opinions as far as they possibly can.
Step 7: Conclusion – accept or reject the hypothesis
- Learners should now take a decision to either ACCEPT or REJECT the hypothesis.
- Learners must give reasons for either ACCEPTING or REJECTING the hypothesis.
Step 8: Bibliography
- Learners must include a comprehensive bibliography.
- Learners must list websites in full.
- Learners must include annexures of questionnaires and interviews conducted.
Step 9: Submission
- Learners must include graphs, tables, diagrams and pictures where necessary.
- On submission, learners must ensure that a suitable cover page is included.
4.4.3 Compiling a bibliography for a research task
- For a book:
Author (last name, initials). Title of Book (Publishers, Date of publication).
Example:
Dahl, R. The BFG. (Farrar, Straus & Giroux, 1982).
- For an encyclopaedia:
Encyclopaedia Title, Edition date. Volume number, ˈArticle Titleˈ, page number(s).
Example:
Encyclopaedia Britannica, 1997. Volume 7, ˈGorillasˈ, pp. 50–51.
- For a magazine:
Author (last name first), ˈArticle Titleˈ. Name of Magazine. Volume number, (Date): page number(s).
Example:
Jordan, Jennifer, ˈFilming at the Top of the Worldˈ. Museum of Science Magazine. Volume 47, No. 1, (Winter 1998): p. 11.
- For a newspaper:
Author (last name first), ˈArticle Titleˈ. Name of Newspaper. City, state publication. (Date): Edition if available, Section, page number(s).
Example:
Powers, Ann, ˈNew Tune for the Material Girlˈ. The New York Times. New York, NY. (3/1/98): Atlantic Region, Section 2, p. 34.
- For a website:
Quote the name of the website in full and underline.
Example:
http://www.sahistory.org.za/topic/womens-struggle-1900-1994
- For a person:
Full name (last name first). Occupation, date of interview.
Example:
Smeckleburg, Sweets. Bus driver. 1 April 1996.
- For a film/documentary:
Title, Director, Distribution, Year.
Example:
Braveheart, Director Mel Gibson, Icon Productions, 1995.
4.4.4 Proposed cover page for a research task
NAME OF SCHOOL | |
NAME OF LEARNER | |
SUBJECT | |
RESEARCH TOPIC | |
CURRICULUM CONTENT | |
Design cover suitable for research topic and place here
| |
STATEMENT OF AUTHENTICITY
I hereby declare that ALL pieces of writing contained in this research task are my own original work and that if I made use of any source, I have duly acknowledged it.
Learner’s signature: __________________________________ Date: _____________
5. Quality assurance processes followed
A team of subject/curriculum experts were selected by the Department of Basic Education. This team met and compiled a set of research tasks and data-handling tasks. These tasks were set in such a way that they would be suitable to use for the CAPS. On completion of the setting of these tasks, all tasks were moderated and adjusted accordingly. Once the moderation and adjustments had been completed, a panel consisting of national examiners and internal moderators was compiled to ensure that the quality of the tasks met all the requirements for the CAPS.
6. Assessment tasks
6.1 Research tasks
6.1.1 Exemplar: Research task 1
- Curriculum content: Key human-environment interactions in urban areas: People and places – inner-city problems
- Compliant with CAPS.
- May be tested in the CAPS final external examination.
- One (1) research task must be done.
CRIME IN THE INNER CITY South African cities attract thousands of new residents every year in search of work and a better life. The housing shortage, along with a shortage of housing subsidies, means that for many South Africans there is no alternative but to live in informal housing and shack settlements. The rapid increase in informal settlements around the cities in South Africa has resulted in an increase in crime rates in the inner city. |
Step 1: Formulate the hypothesis/problem statement
- Formulate your own hypothesis based on a problem you have identified, for example:
The increasing number of informal settlements (choose localised informal settlement) in and around urban areas in South Africa has resulted in higher crime rates within the inner city due to higher unemployment. (Focus: More people in surrounding informal settlements result in unemployment causing people to turn to crime.) |
Step 2: Background information about the study area
Give a brief introduction and description (background information) of the city (study area) you have selected in terms of:
- Historical background
- Population
- Description of the location of informal settlements in relation to the inner city
- Other relevant statistical information
Step 3: Mapping
- Provide a map showing the position of the informal settlement in relation to the city that you have identified for your research task. (It is easier to choose your local area as an area of study.)
- The map should clearly indicate buffer zones where informal settlements are located.
- The map should include areas of the city that are regarded as crime ˈhotspotsˈ.
- The map must have a clear legend/key.
- The scale of the map must be indicated.
Step 4: Data collection
Collect data using at least THREE methods, for example:
- Questionnaires
- Interviews
- Field trips
- Photographs and maps
- Literature research (newspapers, magazines, books, et cetera)
- Internet research
Step 5: Analysis and synthesis of data
- Analyse the data that you have collected, and formulate a report on your findings. Support your findings with graphs, photos, et cetera.
- Briefly discuss how the existence of informal settlements contributes to crime in the inner city.
- Briefly discuss the contribution of high unemployment rates in the informal settlements to crime in the inner city.
Step 6: Recommendations and solutions
- Provide suitable recommendations and solutions to the problem.
Step 7: Conclusion – accept or reject the hypothesis
- Based on your findings in Step 5, you may either ACCEPT or REJECT the hypothesis.
- Give reasons for your conclusion.
Step 8: Bibliography
- Compile a bibliography for your research. If you have done any Internet research, you must provide the website(s) that you have used in full.
Step 9: Submission
- Collate all your information.
- Include a table of contents.
- Ensure that you include a copy of the questionnaire and/or questions asked in your interviews as annexures.
- Design a suitable cover sheet.
- Submit your research.
6.1.2 Exemplar: Research task 2
- Curriculum content: Physical Geography (fluvial processes)
- Compliant with CAPS.
- May be tested in the CAPS final external examination.
- One (1) research task must be done.
THE IMPACT OF HUMAN ACTIVITIES ON RIVERS Rivers obtain water from surface run-off and ground water of their drainage basins. Activities taking place in the drainage basin affect the quality of water in the river. |
Choose a river close to your school or where you live as an area of study, and conduct your research by following the steps outlined below.
Step 1: Formulate the hypothesis/problem statement
- Formulate your own hypothesis based on a problem you have identified, for example:
Human activities impact negatively on the quality of water and the flow pattern in the upper reaches/course of the Blood River in Limpopo. |
Step 2: Background information about the river under study
- Describe the provincial location of the river.
- Climate – particularly the amount of rainfall that is received.
- Vegetation
- Relief and topography
- Underlying rock structure
- Specify the river type, for example permanent, periodic.
- Describe the river stage (youth, mature or old age) at your study area.
Step 3: Mapping
- Provide a map showing the river being studied and the adjacent settlements.
- Create a clear buffer zone at the part of the river that is being studied.
- The map should have a clear key/legend.
- Indicate the scale of the map.
Step 4: Data collection
Collect data using at least THREE methods, for example:
- Questionnaires
- Interviews
- Field trips
- Photographs and maps
- Literature research (newspapers, magazines, books, et cetera)
- Internet research
Step 5: Analysis and synthesis of data
- Analyse the data that you have collected, and formulate a report on your findings. Support your findings with graphs, photos, et cetera.
- Use the above sets of data collected to determine the extent to which the river is affected by human activities.
- Explain in detail how the identified human activities impact on the quality of water and the flow pattern of the river.
Step 6: Recommendations and solutions
- In your opinion as a researcher, what would be the possible solution(s) to the negative impact caused by human activities in the river?
- Make long-term recommendations to the government department(s) leading to legislature to protect the river.
Step 7: Conclusion – accept or reject the hypothesis
- Based on your findings in Step 5, you may either ACCEPT or REJECT the hypothesis.
- Give reasons for your conclusion.
Step 8: Bibliography
- Compile a bibliography for your research. If you have done any Internet research, you must provide the website(s) that you have used in full.
Step 9: Submission
- Collate all your information.
- Include a table of contents.
- Ensure that you include a copy of the questionnaire and/or questions asked in your interviews as annexures.
- Design a suitable cover sheet.
- Submit your research.
6.1.3 Proposed marking rubric for research tasks
NAME OF LEARNER: _________________________________________________________GRADE: __________
CURRICULUM TOPIC: __________________________________________________________________________
RESEARCH TOPIC: __________________________________________________________________________
MARK
| 1 | 2–3 | 4–5 | Teacher Mark | Moderator Mark | |||
Step 1
|
|
|
| |||||
MARK
| 1 | 2–3 | 3–4 | 5–6 | Educator Mark | Moderator Mark | ||
Step 2
|
|
|
|
| ||||
MARK
| 1 | 2 | 3 | 4 | 5 | Educator Mark | Moderator Mark | |
Step 3 |
|
. |
|
|
| |||
| MARK | 1 | 2–3 | 4–5 | 6 | Teacher Mark | Moderator Mark | ||
| Step 4 Data collection |
|
|
|
| ||||
| MARK | 1–3 | 4–6 | 7–9 | 10–12 | 13–15 | Teacher Mark | Moderator Mark | |
| Step 5 Analysis and synthesis of data |
|
|
|
|
| |||
| MARK | 1 | 2–3 | 4–5 | 6 | Teacher Mark | Moderator Mark | ||
| Step 6 Recommendations and solutions |
|
|
|
| ||||
| MARK | 0 | 1–3 | 4–5 | Teacher Mark | Moderator Mark | |||
| Step 7 Conclusion |
|
|
| |||||
| MARK | 0 | 1–3 | 4 | Teacher Mark | Moderator Mark | |||
| Step 8 Bibliography |
|
|
| |||||
| MARK | 0 | 1–2 | 3 | Teacher Mark | Moderator Mark | |||
| Step 9 Cover page |
|
|
| |||||
| MARK | 1–4 | 5 | 5 | Teacher Mark | Moderator Mark | |||
| Step 10 Presentation |
|
|
| |||||
| Teacher Mark | Moderator Mark | |||||||
| TOTAL: 60 | ||||||||
| SBA MARK: 60 ÷ 3 = 20 | ||||||||
TEACHER NAME: ______________________________DATE OF ASSESSMENT: __________________
MODERATOR NAME: ______________________________DATE OF MODERATION: __________________
6.2 Data-handling tasks
6.2.1 Exemplar: Data-handling task 1
- Curriculum content: Physical Geography (tropical cyclones, subtropical anti-cyclones and drainage basins)
- Compliant with CAPS.
- May be tested in the CAPS final external examination.
- One (1) data-handling task must be done.
GRADE 12 SBA (CAPS 2014)
DATA-HANDLING TASK
PHYSICAL GEOGRAPHY
TIME: 1 hour (60 minutes)
MARKS: 60
QUESTION 1
1.1 Refer to FIGURE 1A showing a synoptic weather map of Tropical Cyclone Irina.
1.1.1 Determine the number of tropical cyclones, including Irina, that has occurred during this tropical cyclone season. (1 x 2) (2)
1.1.2 Give a reason to support your answer to QUESTION 1.1.1. (1 x 2) (2)
1.1.3 Describe the surface air circulation within Tropical Cyclone Irina. (1 x 2) (2)
1.2 Refer to FIGURE 1B showing a satellite image of Tropical Cyclone Irina and FIGURE 1C showing the projected path of Tropical Cyclone Irina.
1.2.1 Using the satellite image, determine in which stage of development Tropical Cyclone Irina is. (1 x 2) (2)
1.2.2 Give evidence from the satellite image to support your answer to QUESTION 1.2.1 . (1 x 2) (2)
1.2.3 Discuss TWO socio-economic impacts of Tropical Cyclone Irina on areas along the east coast of southern Africa. (2 x 2) (4)
1.2.4 Draw a labelled cross-section of Tropical Cyclone Irina as depicted on the satellite image from X to Y. Clearly indicate the position of the eye and the cumulonimbus clouds on your cross-section. (2 x 2) (4)
1.2.5 State the reason for the use of the words, ‘projected path’ when describing the path of Tropical Cyclone Irina. (1 x 2) (2)
1.3 Refer to FIGURE 1A.
1.3.1 Identify the high-pressure cells labelled P and Q. (2 x 2) (4)
1.3.2 Use evidence from the map to explain whether wind speed will be greater in area P or area Q. (3 x 2) (6)
[30]
QUESTION 2
2.1 Refer to FIGURE 2A showing cross-sections of the Tugela River along its course in its drainage basin shown in FIGURE 2B.
2.1.1 Define the term drainage basin. (1 x 2) (2)
2.1.2 Which of FIGURE 2A and FIGURE 2B shows a longitudinal and transverse profile respectively? (2 x 2) (4)
2.1.3 Match each of cross-sections A, B and C (FIGURE 2A) with positions (i), (ii) and (iii) (FIGURE 2B). (3 x 2) (6)
2.1.4 Briefly explain the difference in the width of the river channel at A and C. (2 x 2) (4)
2.2 Refer to FIGURE 2B showing the drainage basin of the Tugela River from its upper to the middle to the lower course.
2.2.1 Determine the stream order of the Tugela River at point X along its course. (1 x 2) (2)
2.2.2 Identify and explain ONE of the stream channel patterns of the Tugela River at (ii) along its course. (3 x 2) (6)
2.2.3 Draw a labelled free-hand cross-section through the river channel along line T–S, showing the position of and the difference in shape between a slip-off slope and an undercut slope. (2 x 2) (4)
2.2.4 Give ONE reason why the Tugela River is more likely to flood in the vicinity of (iii). (1 x 2) (2)
[30]
GRAND TOTAL: 60
FIGURE 1A: TROPICAL CYCLONE IRINA 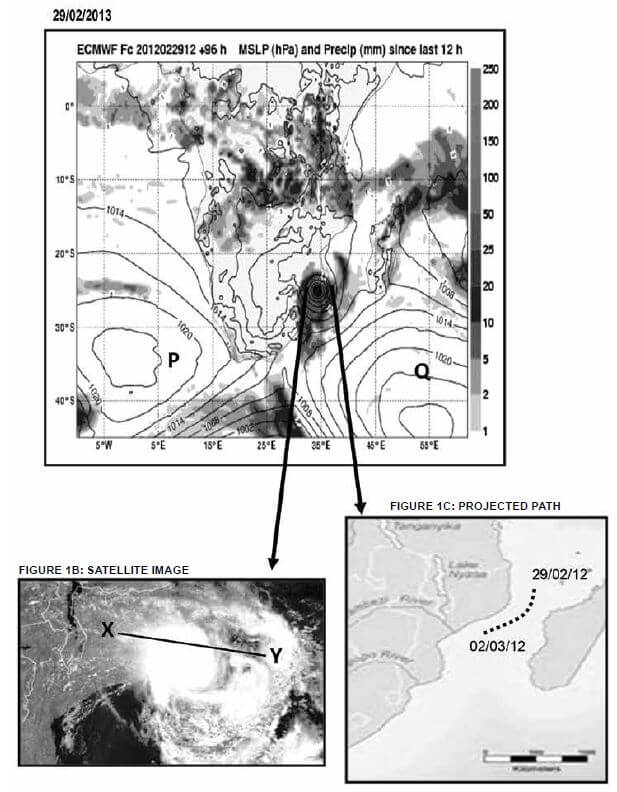
FIGURE 2A: CROSS-SECTIONS OF THE TUGELA RIVER ALONG VARIOUS POINTS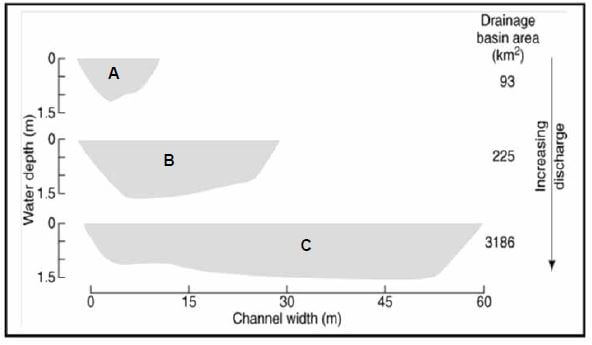
FIGURE 2B: SCHEMATIC PLAN VIEW OF THE DRAINAGE BASIN OF THE TUGELA RIVER 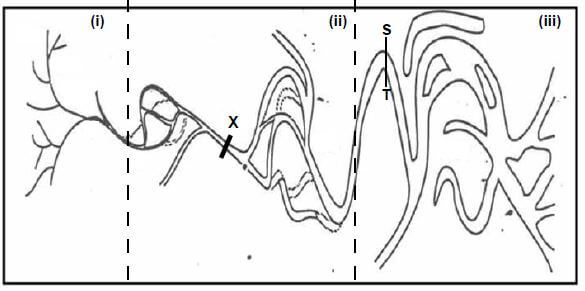
6.2.2 Exemplar: Data-handling task 2
- Curriculum content: People and their needs (gross domestic product, industrial areas, industrial development zones [IDZ])
- Compliant with CAPS.
- May be tested in the CAPS final external examination.
- One (1) data-handling task must be done.
GRADE 12 SBA (CAPS 2014)
DATA-HANDLING TASK
PEOPLE AND THEIR NEEDS
TIME: 1 hour (60 minutes)
MARKS: 60
QUESTION 1
1.1 Refer to FIGURES 1A and 1B and answer the questions that follow.
1.1.1 Define the following terms:
- Gross domestic product (1 x 2) (2)
- Balance of trade (1 x 2) (2)
1.2 Identify the largest and the smallest contributor to the South African GDP. (2 x 2) (4)
1.3 Use FIGURE 1B to describe the trend of the South African GDP from 2010 to 2012. (1 x 2) (2)
1.4 How will the trend mentioned in QUESTION 1.3 affect South Africa’s Balance of Trade? (1 x 2) (2)
1.5 Which economic activity (primary, secondary or tertiary) in FIGURE 1A accounts for the existing trend mentioned in QUESTION 1.3? (1 x 2) (2)
1.6 Discuss the relationship between the percentage contributed by agriculture to the South African GDP and food security in the country. (2 x 2) (4)
1.7 FIGURE 1A indicates that the agricultural sector contributes a very small percentage to the GDP.
Write a short paragraph (approximately 12 lines) in which you account for the small contribution of the agricultural sector to the South African GDP. (6 x 2) (12)
[30]
QUESTION 2
Refer to FIGURE 2 before answering the questions below.
2.1 Write down the correct names for the industrial areas marked B and D. (2 x 2) (4)
2.2 Identify the largest of the four industrial areas visible in FIGURE 2. (1 x 2) (2)
2.3 Explain any TWO factors that have led to the growth and development of the industrial area referred to in QUESTION 2.2. (2 x 2) (4) [10]
QUESTION 3
Refer to FIGURE 3 before answering the questions below.
3.1 What is an IDZ? (1 x 2) (2)
3.2 Name the province in which the Coega IDZ is located. (1 x 2) (2)
3.3 Briefly describe TWO aims for the development of the Coega IDZ. (2 x 2) (4)
3.4 As a manufacturer of heavy earth-moving equipment for sale in Asia, explain what would encourage you to open a factory in the Coega IDZ. (2 x 2) (4)
3.5 Suppose you are a South African government official responsible for economic development. State FOUR incentives you would use to attract foreign investors to the Coega IDZ. (4 x 2) (8)
[20]
GRAND TOTAL: 60
FIGURE 1A: PERCENTAGE CONTRIBUTION OF MAIN SECTORS TO THE GDP 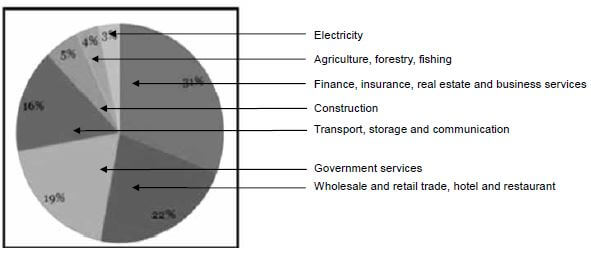
FIGURE 1B: SOUTH AFRICAN GDP 
FIGURE 2: INDUSTRY AND MINING IN SOUTH AFRICA
Industry And Mining |
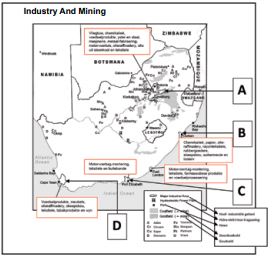
FIGURE 3: COEGA IDZ
THE COEGA INDUSTRIAL DEVELOPMENT ZONE The Coega Development Corporation (CDC) is a state-owned entity formed in 1999. It was mandated to develop and operate the Coega Industrial Development Zone (IDZ), which is located adjacent to the modern deep-water port facility, Port of Ngqura. |
6.2.3 Marking memoranda/Guidelines for data-handling tasks
MEMORANDUM – Data-handling task 1
TIME: 1 hour (60 minutes)
MARKS: 60
QUESTION 1
1.1
1.1.1 9 cyclones (2) 1x2 (2)
1.1.2 Tropical cyclones are named alphabetically - ‘I’ is the 9th letter of the alphabet (2) 1x2 (2)
1.1.3 Surface circulation is in a clockwise direction (2) 1x2 (2)
1.2
1.2.1 Mature stage (2) 1x2 (2)
1.2.2
The extent/diameter of the cloud cover is large (2)
The cyclone is still approaching the land (2)
Situated over warm ocean (2)
[Any ONE] 1x2 (2)
1.2.3
Damage to transportation networks (2)
Damage to buildings (2)
Loss of life (2)
Disruption of communication networks (2)
Destruction of topsoil/soil erosion (2)
Crops destroyed (2)
Livestock drowned (2)
Decrease in economic activities (2)
Disruption in exporting and importing activities at the harbour (2)
Drop in food security (2)
Increase in food insecurity (2)
Outbreak of waterborne diseases (2)
[Any TWO. Accept other reasonable answers] 2x2 (4)
1.2.4 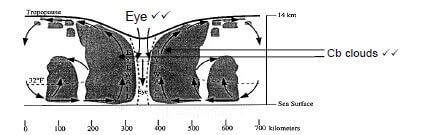 2x2 (4)
1.2.5 A tropical cyclone follows an erratic path and therefore it is difficult to predetermine its exact path (2) [Concept] 1x2 (2)
1.3
1.3.1
P - South Atlantic/St Helena High Pressure Cell (2)
Q – South Indian/Mauritius High Pressure Cell (2) 2x2 (4)
1.3.2 P (2)
Steeper pressure gradient/isobars closely spaced (2)
The steeper the pressure gradient the stronger the winds (2) 3x2 (6) [30]
QUESTION 2
2.1
2.1.1 The total area drained by a river system and all its tributaries (2)
[Concept] 1x2 (2)
2.1.2
2A - transverse profile (2)
2B - longitudinal profile (2) 2x2 (4)
2.1.3
A - (i) (2)
B - (ii) (2)
C - (iii) (2) 3x2 (6)
2.1.4
A - mainly downward erosion therefore narrow river channel (2)
C - river weaves from side to side thus lateral erosion and wide river channel (2) 2x2 (4)
2.2
2.2.1 3rd order stream 1x2 (2)
2.2.2
Meandering stream channel pattern (2)
The gradient becomes gentle and there is a reduction in the velocity of the river (2)
To overcome excess energy, stream starts weaving from side to side (2)
[Any ONE reason]
OR
Braided stream channel pattern (2)
The gradient becomes gentle and there is a reduction in the velocity of the river (2)
The river deposit sediments on the riverbed and the water flows around the deposited material (2)
[Any ONE reason] 2x2 (4)
2.2.3 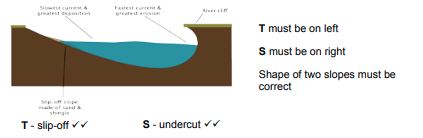
T - slip-off ✔✔ S - undercut ✔✔
T must be on left
S must be on right
Shape of two slopes must be correct 2x2 (4)
2.2.4
River shallow due to deposition and water will overflow easily (2)
Wide, flat floodplain allows overflowing water to spread easily (2)
Large volume of water that cannot be contained by the river channel (2)
[Any ONE] 1x2 (2)
[30]
GRAND TOTAL: 60
MEMORANDUM – Data-handling task 2
TIME: 1 hour (60 minutes)
MARKS: 60
QUESTION 1
1.1.1 The total value of goods and service produced in a country in one year. [Concept] 1x2 (2)
1.1.2 Balance of Trade refers to the difference between the value of imports and exports of goods produced in a country/Value of exports minus imports in a country (2)
[Concept] 1x2 (2)
1.2 Largest - Wholesale and retail trade, hotel and restaurants (2) Smallest - Electricity (2) 2x2 (4)
1.3 Increasing trend/upward trend/economic improvement (2) 1x2 (2)
1.4 Positive Balance of Trade/Positive Trade Balance (2) 1x2 (2)
1.5 Tertiary Activities/Services (2) 1x2 (2)
1.6
Low agricultural production means there will be less food produced (2)
This will lead to a shortage of food (2)
Food security is threatened/food Insecurity (2)
[Any TWO] 2x2 (4)
1.7
Low and unreliable South African rainfall (2)
Soil quality is generally poor in South Africa (2)
High frequency of drought (2)
Hail that often occurs in the Highveld impacts negatively on crop production (2)
Dual agricultural system/existence of subsistence and commercial farmers (2)
Fluctuating prices of agricultural products both locally and internationally (2)
High prevalence of HIV/Aids lowers production on farms (2)
Pests and insects destroy crops and fruit (2)
Growing importance of secondary sector (2)
Greater income from exporting processed goods (2)
Growing importance of tertiary sector (2)
[Any SIX. Accept any other reasonable answer] (6x2) (12) [30]
QUESTION 2
2.1
B - EThekwini metropolitan region/Durban-Pinetown region (2)
D - South-Western Cape region (2) 2x2 (4)
2.2 Gauteng Industrial Region/PWV (2) 1x2 (2)
2.3
Market - Large cities and towns in the region form markets for manufactured goods (2) Ever-increasing population in the region forms excellent market for locally manufactured goods (2)
Transport - Good transport system connects Gauteng Industrial region to various sources of raw materials and harbours to facilitate exports and imports (2)
Raw materials - Large deposits of minerals stimulate the development of industries in this area (2)
Power - Available coal in Gauteng and Mpumalanga used to generate electricity (2) Easy access to power produced by ESKOM attracted many industries to the region (2)
Water - Availability of water from water transfer schemes much needed by industries (2)
[Any TWO. Must explain and not only list/mention] (2x2) (4) [10]
QUESTION 3
3.1 An area close to an airport or port intended to attract investment, increases exports and the competitiveness of South African products (2) [Concept] 1x2 (2)
3.2 Eastern Cape (2) 1x2 (2)
3.3
To stimulate economic growth in the region (2)
Provision of skills (2)
Job creation (2)
Alleviate poverty (2)
Improve infrastructure (2)
To encourage export of manufactured goods (2)
[Any TWO. Accept other reasonable answer] 2x2 (4)
3.4
Break-of-bulk point (2)
Availability of harbour to export the equipment (2)
Presence of cheap water transport (2)
Availability of skilled/unskilled labour (2)
Coega IDZ is on the eastern coast - closer to Asian market (2)
[Any TWO. Accept other reasonable answer] 2x2 (4)
3.5
Develop world class infrastructure specially designed to attract investors (2)
Provide access to latest information technology for global communication (2)
Duty-free benefits on raw materials for imports (2)
Subsidised electricity supply rates (2)
Tax rebates (2)
Tax holidays (2)
Reduced cost for water supplies (2)
Develop direct links to an international port and airport for exports (2)
Subsidise training for workers (2)
[Any FOUR. Accept other] 4x2 (8)
[20]
GRAND TOTAL: 60
7. CONCLUSION
This document provides teachers with a framework within which to work and develop their own research and data handling tasks.
A clear guideline has been developed on how to conduct research. This guideline can be applied to any topic within the CAPS in which learners wish to conduct research. The marking rubric that has been included also provides teachers and learners with a clear guide on the time that should be spent on the various phases of doing the research.
The high standard of these tasks will provide a platform for learners to develop skills such as research, interpretation of resources, integration of resources and graphs, all skills required for the final external Geography examination. These are also skills that can be put to use at a later stage in their lives.