GEOGRAPHY PAPER 2 GRADE 12 MEMORANDUM - NSC PAST PAPERS AND MEMOS NOVEMBER 2016
Share via Whatsapp Join our WhatsApp Group Join our Telegram GroupGEOGRAPHY PAPER 2
GRADE 12
MEMORANDUM.
NATIONAL SENIOR CERTIFICATE
NOVEMBER 2016
RESOURCE MATERIAL
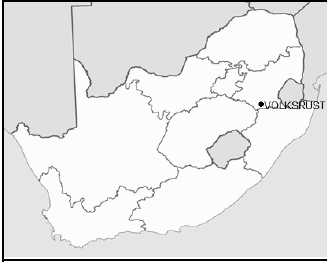
- An extract from topographical map 2729BD VOLKSRUST.
- Orthophoto map 2729 BD 13 VOLKSRUST
- NOTE: The resource material must be collected by schools for their own use.
INSTRUCTIONS AND INFORMATION
- Write your EXAMINATION NUMBER and CENTRE NUMBER in the spaces on the cover page.
- Answer ALL the questions in the spaces provided in this question paper.
- You are provided with a 1 : 50 000 topographical map (2729BD VOLKSRUST) and an orthophoto map (2729 BD 13 VOLKSRUST) of a part of the mapped area.
- You must hand the topographical map and the orthophoto map to the invigilator at the end of this examination session.
- You may use the blank page at the end of this question paper for all rough work and calculations. Do NOT detach this page from the question paper.
- Show ALL calculations and formulae, where applicable. Marks will be allocated for these.
- Indicate the unit of measurement in the final answer of calculations.
- You may use a non-programmable calculator.
- The area demarcated in RED on the topographical map represents the area covered by the orthophoto map.
- The following English terms and their Afrikaans translations are shown on the topographical map:
ENGLISH AFRIKAANS
Aerodrome Vliegveld
Diggings Uitgrawings
Furrow Voor
Golf Course Gholfbaan
Rifle Range Skietbaan
River Rivier
Sawmills Saagmeule
Sewerage Works Rioolwerke
Silos Graansuiers
GENERAL INFORMATION ON VOLKSRUST Volksrust is a town in Mpumalanga on the border of KwaZulu-Natal. It is located 240 km southeast of Johannesburg. The town has important beef, dairy, maize, sorghum, wool and sunflower seed industries. Volksrust has an average annual rainfall of 648 mm, with the lowest rainfall (1 mm) in July and the highest rainfall (117 mm) in January. Most of the rain falls in the summer. The average midday temperatures for Volksrust range from 15,9 °C in June to 24,3 °C in January. June is the coldest period when the mercury can drop to an average of 0,5 °C during the night.
|
QUESTION 1: MULTIPLE-CHOICE QUESTIONS
The questions below are based on the 1 : 50 000 topographical map (2729BD VOLKSRUST) as well as the orthophoto map of a part of the mapped area. Various options are provided as possible answers to the following questions. Choose the answer and write only the letter (A–D) in the block next to each question.
1.1 The map index/reference of the orthophoto map to the south of Volksrust is …
B✓
1.2 The true bearing of 2 in the centre of the sewerage works from trigonometrical station 152 at point 1 on the orthophoto map is …
D✓
1.3 The feature causing environmental problems at 3 on the orthophoto map:
C✓
1.4 The feature at 4 on the orthophoto map is a/an …
C✓
1.5
The stream order of the river at K in block A6 on the topographical map is …
B✓
1.6 If you follow the N11 in a southerly direction, you will cross the provincial border into …
A✓
1.7 The stream pattern that dominates the area covered by blocks A9/10 and B9/10 is …
B✓
1.8 The dominant street pattern at L in blocks D3/4 on the topographical map is a … pattern.
C✓
1.9 The type of farming at 27°24'30''S 29°53'30''E / 27°24,5'S 29°53,5'E is ... farming.
B✓
1.10 The slope from spot height 1606, M in block I6, to N in block I7 on the topographical map is a … slope.
D✓
1.11 The fluvial landform at Y in block F6 is an indication that … has taken place.
B✓
1.12 A factor responsible for the location of the industrial area at O in block D4 on the topographical map is …
A/C✓
1.13 The land-use zone in block D2 on the topographical map in which Jubapark is situated, is known as the …
D✓
1.14 Which natural feature assists in purifying the water before it reaches the dam in block D9?
B✓
1.15 Volksrust is an example of a … town.
C✓
(15 x 1)
[15]
QUESTION 2: MAP CALCULATIONS AND TECHNIQUES
2.1 The magnetic bearing between two points on the topographical map was 326°37' for the year 2010.
2.1.1 Will the magnetic bearing for 2016 between the same two points be larger or smaller?
Larger✓
Accept Bigger/Increasing (1 x 1) (1)
2.1.2 Give a reason for your answer to QUESTION 2.1.1.
The mean annual change in the magnetic declination for Volksrust is 3' West/Westwards ✓ (1 x 1) (1)
2.2 Calculate the area of the cultivated lands, area P in block F4 on the topographical map, in km². Show ALL calculations. Marks will be awarded for calculations. Clearly indicate the unit of measurement in your answer.
Formula: area = length (L) × breadth (B)
1 (cm) ✓ x 0.5 = 0.5 km
(0,9 cm to 1.1 cm)
10mm x 0.05 = 0,5 km
[Range: 0.45 km – 0.55 km]
0.6 (cm) ✓ x 0.5 = 0.3 km
(0.5 cm to 0,7 cm)
6mm x 0,05 = 0,3 km
[Range: [0.25 km – 0.35 km)
0.5 km ✓ x 0.3 km ✓ = 0.15 km²✓
[Range: [0.11 km² – 0.19 km²]
Measurement in mm/ Position of the tick to be altered.
[Accept any other formulas/methods for calculating the length and breadth] (5 x 1) (5)
2.3 Two gradients, 1: 24 and 1: 58, represent slopes 5 and 6 respectively on the orthophoto map.
2.3.1 Match the gradients 1:24 and 1:58 with slopes 5 and 6 on the orthophoto map.
Slope 5: 1 : 58 ✓
Slope 6: 1 : 24 ✓ (2 x 1) (2)
2.3.2
- Which ONE of the two gradients, 1: 24 or 1: 58, is the steeper?
1 : 24 ✓ (1 x 1) (1) - Interpret the ratio of the gradient selected in QUESTION 2.3.2(a).
For every unit one moves vertically, one moves 24 units horizontally ✓
Over a short horizontal distance one rises quickly ✓
The ratio between the vertical distance and horizontal distance is smaller ✓
[CONCEPT] (1 x 1) (1)
2.4 Refer to the cross-section from Q in block E7 to R in block D9 on the topographical map.
2.4.1 Indicate the following features on the cross-section using the key indicated in brackets next to the feature:
- Δ235 (T)
- Secondary road (S)
- Marsh and vlei (M) (3 x 1) (3)
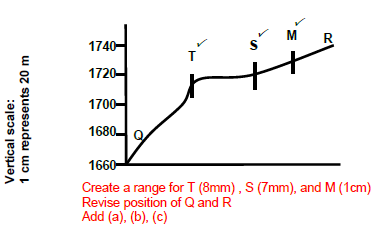
2.4.2 Give ONE reason why a person standing at Q will NOT be visible to a person standing at R.
There are obstruction between Q and R ✓
The feature at T forms an obstruction between Q and R ✓
The slope is convex ✓
Scarp slope between Q and T ✓
An area above the intervisibilty line ✓
[ANY ONE] (1 x 1) (1)
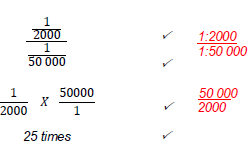
2.4.3 Vertical exaggeration (VE) is calculated to indicate relief differences of a cross-section.
- Give the vertical scale of the cross-section as a ratio scale.
1 : 2 000 ✓ (1 x 1) (1) - Determine the vertical exaggeration (VE) of the cross-section. Show ALL calculations. Marks will be awarded for calculations.
Formula: vertical exaggeration = vertical scale
horizontal scale
[Accept other methods] (4 x 1) (4)
[20]
QUESTION 3: APPLICATION AND INTERPRETATION
3.1 Refer to the valley between spot height 1709 in block H9 and trigonometrical station 241 in block G10 on the topographical map.
3.1.1 Why did the farmer select site V to grow his/her crops?
It has flat land/gentle slope
Floodplain ✓
It is close to the river/water source ✓
Fertile soil/alluvium ✓
Road for transport /infrastructure✓
(Any ONE) (1 x 1) (1)
3.1.2 Crops are stored in local silos. Is this a primary, secondary or tertiary activity?
Tertiary activity ✓ (1 x 1) (1)
3.1.3 The suitability of site V for cultivation may be reduced by flooding. Explain this statement.
Area V is within the meander loop of the Slang river ✓✓
Due to area V being flat it could easily be flooded if the river overflows its banks during heavy rainfall ✓✓
It is on the floodplain and during heavy rainfall the water will flow down the slopes flooding area V ✓✓
The crops will be washed away ✓✓
The fertile soils will be eroded ✓✓
Low lying area ✓✓
(Any ONE) (1 x 2) (2)
3.1.4 The farmer at V noticed that early morning mist in winter starts to clear from the bottom of the valley, as indicated in the sketches below. Explain why this happens.
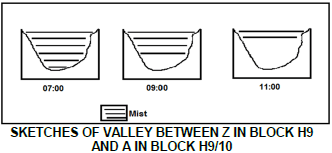
Between 09:00 and 11:00, the sun heats up the slopes of the valley. ✓✓
Terrestrial radiation starts happening/ Warm air rising ✓✓
Thus causing the moist air to evaporate from below (resulting in the appearance of the mist lifting) ✓✓
Most of the mist evaporates at around 11:00 and the valley is almost clear ✓✓
(Any TWO) (2 x 2) (4)
3.2 Refer to the perennial stream in block B10 and state the general direction in which this perennial stream flows. Give TWO reasons for your answer.
Direction: Southerly ✓
Reason:
Dam wall is on the southern section of the dam ✓✓
Contour lines show decrease in height in a southerly direction ✓✓
Spot heights show decrease in height in a southerly direction ✓✓
The bend of the contour lines in the river valley point to increasing height/V shape points upstream ✓✓
The water accumulates north of the dam wall ✓✓
(Any ONE) (1 + 2) (3)
3.3 Compare the settlements marked S in block B7 and T in block J3, using the criteria below. Complete the table.
3.3.
| S | T | |
| Settlement pattern | Isolated/dispersed ✓ | Nucleated/clustered ✓ |
| Dominating type of primary activity in the area | Crop Farming/ Agriculture/Ploughing/Cultivation/Cultivated land ✓ | Forestry/Woodland ✓ |
(4 x 1) (4)
3.3.2 Give TWO points of evidence on the topographical map that suggests that the primary activity at T is practised extensively.
The area has large forest around it e.g. Amajuba Forest /Large farm area/Langsnek is a large farm✓
It has the necessary infrastructure ✓ e.g. sawmills ✓, electricity ✓
and transport/railway line✓
Large labour pool ✓
(Any TWO) (2 x 1) (2)
3.4 Refer to blocks F3 and G3.
3.4.1
- Give the general shape of the built-up areas Charlestown and Clavis.
Linear/Line/Ribbon ✓ (1 x 1) (1) - Give ONE reason for this general shape.
It developed along the road (N11)/railway line ✓
On flat land between hills/high lying areas ✓
Limited with the surrounding hills/ Narrow valley✓
The developments follow the shape/pattern of the river ✓
[ANY ONE] (1 x 1) (1)
3.4.2 State ONE factor that could have influenced the location of Charlestown and Clavis.
River /Availability of water✓✓
Built on flat land ✓✓
They are situated between hills ✓✓/sheltered sites✓✓
They are situated close to transport networks✓✓ / roads (N11)✓✓
/ railway✓✓ / infrastructure ✓✓
Dry point ✓✓/ Situated away from river ✓✓
(Any ONE) (1 x 2) (2)
3.5 Volksrust serves as a central place town to the surrounding rural areas.
3.5.1 Give ONE point of evidence on the topographical map that indicates that Volksrust is a central place town.
Volksrust has transport routes linking it to the surrounding rural areas ✓
It has many urban services ✓ (Candidates can give examples e.g.
church ✓ clinic ✓ school ✓ shop ✓ recreation ✓)
(Any ONE) (1 x 1) (1)
3.5.2 How may the many roads passing through Volksrust impact on the sphere of influence of the town?
The sphere of influence extends/larger/bigger/expands
[CONCEPT] (1 x 1) (1)
3.5.3 Explain your answer to QUESTION 3.5.2.
The roads will increase the accessibility of Volksrust attracting more customers ✓✓
People will travel from further away to obtain goods and services in
Volksrust ✓✓
The roads increase accessibility from different directions ✓✓
The threshold population increases ✓✓
The range would increase ✓✓
(Any ONE) (1 x 2) (2)
[25]
QUESTION 4: GEOGRAPHICAL INFORMATION SYSTEMS (GIS)
4.1 Refer to the orthophoto map and answer the questions that follow.
4.1.1 Define the term database.
It is the storage/collection of data/information that is organised so that it can be organised/updated in a central place ✓
(Concept) (1 x 1) (1)
4.1.2 An urban and regional planner wants to examine the building density of Volksrust. He/She decides to use an orthophoto map in the local council's database. Give TWO reasons for his/her choice.
The orthophoto map has a good spatial resolution/high degree of clarity/detail ✓✓
The orthophoto map is a photo/image of the area/realistic view/primary source ✓✓
It gives him/her a clear plan view of the building density/distance between buildings ✓✓
It gives updated information ✓✓
The local community data base will have updated information ✓✓
Orthophoto map has a larger scale ✓✓
(Any TWO) (2 x 2) (4)
4.2 Refer to block B5, which consists of a number of data layers.
4.2.1 Use the THREE data layers below to create a paper GIS in the block provided.
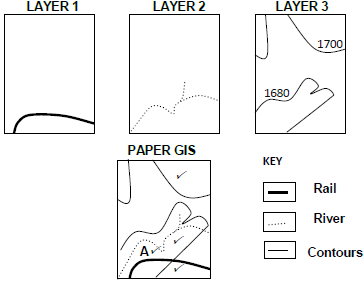
4.2.2 Candidate must draw all THREE contour lines
4.2.4 A will be correct if it is near the railway line (north or south) and the river (3x1)(3)
4.2.2 Which GIS process was used to produce the paper GIS in QUESTION 4.2.1?
Data layering/Data integration /Over layering/Thematic layering/layering
Can explain the process/ Write a description ✓ (1 x 1) (1)
4.2.3 Which data storage method (vector or raster) did you use to create the paper GIS in QUESTION 4.2.2? Give ONE reason for your answer.
Storage method: Vector ✓
Reason: Lines were used to create the paper GIS ✓✓ (1 + 2) (3)
4.2.4 Use the letter A to indicate the most suitable site for a heavy industrial area on the paper GIS in the block (QUESTION 4.2.1). Give a reason for your choice of site.
Site in block: Indicate the site on the paper GIS block (QUESTION 4.2.1).
Reason:
It is situated on flat land ✓✓
It is near the railway line ✓✓
It is near the river ✓✓
[ANY ONE] (1 + 2) (3)
[15]
TOTAL: 75