GEOGRAPHY PAPER 1 GRADE 12 MEMORANDUM - NSC PAST PAPERS AND MEMOS NOVEMBER 2021
Share via Whatsapp Join our WhatsApp Group Join our Telegram GroupMARKING GUIDELINES
SECTION A
QUESTION 1: CLIMATE AND WEATHER
1.1
1.1.1 B (1)
1.1.2 D (1)
1.1.3 B (1)
1.1.4 C (1)
1.1.5 C (1)
1.1.6 A (1)
1.1.7 D (1)
1.1.8 A (1) (8 x 1) (8)
1.2
1.2.1 terrestrial (1)
1.2.2 night (1)
1.2.3 katabatic (1)
1.2.4 B (1)
1.2.5 frost (1)
1.2.6 thermal belt (accept inversion layer) (1)
1.2.7 night (1) (7 x 1) (7)
1.3
1.3.1 GIVE ONE PIECE OF EVIDENCE FOR S HEM
- Date /January indicates summer (1)
- Mozambique (1)
- Madagascar (1)
- Beira (in Mozambique) (1)
- South-westerly movement (1)
- Clockwise circulation symbol (1)
- Located over the South Indian Ocean (1)
- Mozambique channel (1)
- Tropical Cyclone (Eloise) (1)
- Map of Southern Africa (1)
[ANY ONE] (1 x 1) (1)
1.3.2 STATE TWO WEATHER CONDITIONS IN THE INFOGRAPHIC
- Heavy rainfall / Rainfall of 250mm in 24 hours (1)
- Wind speeds up to 140-160 km/hr (1)
(2 x 1) (2)
1.3.3 GIVE ONE REASON FOR DECREASE IN WIND SPEED
- Increased frictional drag (2)
- System moves over land (2)
- Decrease in latent heat (2)
- Decrease in moisture levels (2)
[ANY ONE] (1 x 2) (2)
1.3.4 ACCOUNT FOR INCREASE IN WIND SPEED
- Movement over the warm Mozambique channel (2)
- Less friction over Warm Mozambique channel/ ocean (2)
- High temperatures/warm ocean results in increased evaporation (2)
- Increased condensation results in the release of latent heat (2)
- Latent heat drives the system and increases the wind speed (2)
[ANY TWO] (2 x 2) (4)
1.3.5 THREE STRATEGIES TO REDUCE IMPACT
PRECAUTIONARY MEASURES AND MANAGEMENT STRATEGIES
- Early warning systems put in place (2)
- Sandbags to reduce flooding (2)
- Reinforcing existing infrastructure (2)
- Awareness and education programmes (2)
- Evacuation protocols and drills (2)
- Stocking up of emergency supplies and necessities (2)
- Identify high lying areas to evacuate people (2)
- Build above flood lines/ coastal zoning (2)
- Tracking the movement of the tropical cyclone
- Good forecasting/ Use of media to update regularly (2)
- Improve accessibility to evacuate people (2)
- Move people to higher ground (2)
- Development of good rescue and emergency services (2)
- Storage/ provision of clean water and food supplies (2)
- Rescue personnel, police, medical personnel on standby (2)
- Maintain coastal vegetation to act as a buffer against storm surges (2)
- Request National and international aid if necessary (2)
[ANY THREE- ACCEPT EXAMPLES] (3 x 2) (6)
1.4
1.4.1 IDENTIFY LOW PRESSURE A
- Thermal low (1)
- Accept heat low (1) (1 x 1) (1)
1.4.2 GIVE A REASON FOR THE FORMATION
- High temperatures (2)
- Rising warm air creates low pressure system (2)
[ANY ONE] (1 x 2) (2)
1.4.3 GIVE EVIDENCE FOR RIDGING
- Elongation of isobars (2)
- Bending of the isobars towards the low-pressure (2)
- Outward extension/bulge of isobars away from the high pressure centre (2)
[ANY ONE] (1 x 2) (2)
1.4.4 WHY DOES RIDGING RESULT IN ONSHORE WINDS
- Anticlockwise circulation (from the high pressure) (2)
- Ridge extends towards the land (low pressure) (2)
- Elongation of isobars occurs towards the coastline (2)
[ANY TWO] (2 x 2) (4)
1.4.5 DESCRIBE WEATHER CONDITIONS AT PE
- Results in SSE winds (anti-clockwise circulation from the high pressure) (2)
- Increase in wind speeds/strong /gale force winds (2)
- Precipitation in the form of rainfall (2)
- Possibility of drizzle (2)
- Overcast conditions (increase in cloud cover) (2)
- Increasing humidity (small difference between air temperature and dew point temperature) (2)
- Decrease in air temperature (as air advects onto the land) (2)
[ANY THREE] (3 x 2) (6)
1.5
1.5.1 NAME TWO PRESSURE SYSTEMS TO SET UP BERG WINDS
- Kalahari High (1)
- Coastal low (1) Accept Mid-latitude cyclone (1)
(2 x 1) (2)
1.5.2 DETERMINE HIGHEST TEMP
- Accept in the range 43.9°C to 44,1 °C (1) (1 x 1) (1)
1.5.3 WHAT ROLE DID THE ESCARPMENT PLAY IN INCREASING THE TEMP
- The escarpment has a greater vertical height (elevation) (2)
- Greater frictional drag as air moves down the escarpment (increases temperature) (2)
- Air has a greater vertical descent down the escarpment (1200m-0m) and heats up more (2)
- Increased heating (DALR at 1°C/100m) due to vertical distance of the escarpment (2)
[ANY TWO] (2 x 2) (4)
1.5.4 PARAGRAPH
EXPLAIN THE IMPACT OF BERG WIND ON PHYSICAL ENVIRO
- Plants (Natural vegetation / Pasture) dry out due to the hot dry winds (2)
- Reduction of biodiversity (fauna and flora) within the natural environment (2)
- Declining ecosystems will disrupt food chains and food web networks (2)
- Higher evaporation reduces soil moisture content (2)
- Increased loss of moisture in soil will accelerate soil erosion (2)
- The land is left bare and vulnerable and accelerates soil erosion reducing soil fertility (2)
- Higher levels of carbon dioxide will increase atmospheric pollution (2)
- Water from shallow pools, small non-perennial water bodies can evaporate (2)
- Natural vegetation is destroyed by veld fires (2)
- Loss of habitat/damage to ecosystems due to veldfires (2)
- Increase in carbon dioxide as a result of veldfires impacts negatively on physical environment (2)
- Ash of veldfires act as fertilisers for the development and growth of new vegetation (2)
- Veldfires can promote seed germination (2)
[ANY FOUR] (4 x 2) (8)
[60]
QUESTION 2: GEOMORPHOLOGY
2.1
2.1.1 B (1)
2.1.2 C (1)
2.1.3 D (1)
2.1.4 C (1)
2.1.5 C (1)
2.1.6 D (1)
2.1.7 B (1)
2.1.8 B (1) (8 x 1) (8)
2.2
2.2.1 X (1)
2.2.2 Y (1)
2.2.3 X (1)
2.2.4 Y (1)
2.2.5 X (1)
2.2.6 X (1)
2.2.7 X (1) (7 x 1) (7)
2.3
2.3.1
- A Trellis (1)
- B Dendritic (1) (2 x 1) (2)
2.3.2 DIFFERENTIATE
- A Alternate layers of hard and soft rock/ folded rock structure (2)
- B Rock that is uniformly resistant to erosion (2) (2 x 2) (4)
2.3.3 WHY ARE TRIBUTARIES OF MAIN STREAM PARALLEL
- The streams flow in relation to the folds of the rock (2)
- The streams flow over softer rock of the syncline (valley) (2)
- Interfluves are parallel (2)
[ANY ONE] (1 x 2) (2)
2.3.4 3rd (order) (2) (1 x 2) (2)
2.3.5 Higher (1) (1 x 1) (1)
2.3.6 DESCRIBE THE RELATIONSHIP
- The low rainfall will result in a lower drainage density (2)
- The steep gradient will result in a higher drainage density (2)
(2 x 2) (4)
2.4.1 Deposition (1) (1 x 1) (1)
2.4.2 Gentle/ flat/ level (2) (1 x 2) (2)
2.4.3 GIVE TWO REASONS FOR WIDE FLOODPLAIN AT X
- Increased deposition of silt/alluvium/sand on the floodplain (2)
- River is shallow resulting in more deposition (2)
- Many tributaries deposit sediment (2)
- The gentle slope reduces the velocity of the river and the amount of sediment carried (2)
- Regular flooding in the area (2)
[ANY TWO] (2 x 2) (4)
2.4.4 PARAGRAPH
EXPLAIN PHYSICAL IMACT OF FLOODING ON FLOODPLAIN
- The deposition of silt increases the width of the floodplain (2)
- The deposition of fertile soil materials improves the nature and amount of vegetation available on the floodplain (2)
- Deposition of alluvium increases the quality of the soil (2)
- Levees form on the floodplain as flooding occurs (2)
- Create wetlands which are habitats for living organisms (2)
- Increases soil moisture content that supports vegetation/ improves biodiversity (2)
- Allows floodwaters to spread out and excess water is stored (2)
- Continuous flooding purifies water/increase water quality (2)
- The water table rises resulting in marshes and vlei's/ wetlands on the floodplain (2)
- The waterlogged soils reduce access to parts of the floodplain (2)
- The level of infiltration along the floodplain increases the saturation level of soil (2)
- The biodiversity of the floodplain alters to adapt to the changing conditions (2)
- Continuous flooding or submergence negatively impacts on the natural vegetation/floodplain (2)
[ANY FOUR] (4 x 2) (8)
2.5
2.5.1 DEFINE
- When a more energetic river captures the headwaters of a less energetic river (2)
[CONCEPT] (1 x 2) (2)
2.5.2 STATE
ONE CONDITION
- A steeper gradient (on the one side of the watershed) (2)
- More rainfall (on one side of the watershed) (2)
- Less resistant/softer rock (on the one side of the watershed) (2)
[ANY ONE] (1 x 2) (2)
2.5.3 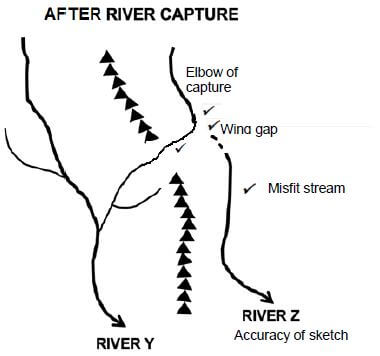
Marks allocated as follows:
- Accuracy of sketch- any one of two tributaries can be used (1)
- Wind gap (1)
- Elbow of capture (1)
- Misfit stream (1) (1 + 3) (4)
2.5.4 River Y (1) (1 x 1) (1)
2.5.5 River Y has an increased volume of water (2) (1 x 2) (2)
REASON
- Accuracy of sketch
- Misfit stream
- Wind gap
- Elbow of capture
2.5.6 EXPLAIN THE IMPACT OF THE CHANGE IN THE CAPTOR STREAM
- Increased vertical erosion due to the increased volume of water in river Y (2)
- The active erosion of the river cuts into the valley forming terraces (2)
- The softer rock in the valley erodes faster resulting in layers/terraces (2)
- New valleys form in a valley due to increased river discharge (2)
- Terraces form due to recurrent rejuvenation in several valleys (2)
- Meanders will become incised/entrenched (2)
- A knickpoint can develop along the profile of the river (2)
- Increased flooding because of greater volume of water (2)
- Increased velocity of water in the river channel because of greater volume of water (2)
- The captor stream will be able to carry a greater load/less deposition (2)
[ANY TWO] (2 x 2) (4)
[60]
SECTION B
QUESTION 3: GEOGRAPHICAL SKILLS AND TECHNIQUES
3.1
3.1.1 Limpopo (1) (1 x 1) (1)
3.1.2 A (1) (1 x 1) (1)
3.1.3 C (1) (1 x 1) (1)
3.1.4
- Area = Length (L) x Breadth (B)
Area = [2 cm x 100] x [1.6 (1) cm x 100] [Range: Breadth (1,5 – 1,7 cm]
= 200 (1) m x 160 (1) m [Range: 150m – 170m]
= 32 000 m ² (1) [Range: 30 000 m² – 34 000 m²]
(4 X 1) (4)
3.1.5 WHY FEATURE IS LARGER ON ORTHOPHOTO
- The scale of the orthophoto map is (5 times) larger than the scale of the topographic map (1)
- (Accept) The scale of the topographic map is (5 times) smaller than the scale of the orthophoto map (1)
[ANY ONE] (1 x 1) (1)
3.1.6 190° (Range: 189 ° - 191°) (1) (1 X 1) (1)
3.1.7
- MB = TB + MD
MB = 190° + 17°10'
= 207°10′ (1) (R '- ')
(1 x 1) (1)
3.2
3.2.1
- Winter (1) (1 x 1) (1)
TYPE OF RIVER - Non-perennial rivers (1)
Accept Periodic (1)
[ANY ONE] (1 x 1) (1)
STATE ONE STRATEGY - Perennial water (2)
Accept dams (2)
Reservoirs (2)
[ANY ONE] (1 x 2) (2)
3.2.2 WIND DIRECTION
- The orientation of the landing strip (2)
- Planes take off and land according to the prevailing wind directions (2) [ANY ONE] (1 x 2) (2)
3.2.3 D (1) (1 x 1) (1)
3.2.4 B (1) (1 x 1) (1)
3.2.5 B (1) (1 x 1) (1)
3.2.6 West north west / North west/ (1) (1 x 1) (1)
3.2.7 HOW TRIBUTARIES IDENTIFY DIRECTION
- Tributaries join the main river at acute angles (2) (1 x 2) (2)
3.3
3.3.1 Vector (1) (1 x 1) (1)
3.3.2 A (1) (1 x 1) (1)
3.3.3 GIVE EVIDENCE TO DEMARCATE
- A wall (black line) was used to demarcate the area around the rivers (2)
- No buildings in the demarcated area (2)
- No human activity/ no development (2)
- No cultivation visible (2)
[ANY ONE] (1 x 2) (2)
3.3.4 IDENTIFY LAYERS
- Rivers (1) Accept Drainage (1)
- Roads (1) Accept Infrastructure (1)
- Buildings (1) Accept Land-use (1)
- Contour lines (1) Accept Relief/Topography (1)
- Rock/soil structure (1) Accept Geology (1)
[ANY TWO] (2 x 1) (2)
3.3.5 WHY WAS IT IMPORTANT TO UTILISE THE LAYERS
- To determine the level of drainage/waterlogging (2)
- To assess the possibility of flooding (2)
- To determine the accessibility of the landing strip (2)
- To determine the availability of open spaces (2)
- To determine the nature of the gradient (2)
- To determine the nature of the soil (2)
- To determine the (stability of the) geological structure of the underlying rock (2)
[ANY ONE] (1 x 2) (2)
[30]
TOTAL: 150