GEOGRAPHY PAPER 2 GRADE 12 MEMORANDUM - NSC PAST PAPERS AND MEMOS SEPTEMBER 2016
Share via Whatsapp Join our WhatsApp Group Join our Telegram GroupGEOGRAPHY P2
GRADE 12
MEMORANDUM
NATIONAL SENIOR CERTIFICATE
SEPTEMBER 2016
Marking Guideline
The following marking guidelines have been developed to standardise marking in the province.
Marking
- ALL questions must be marked, irrespective of whether it is correct or incorrect
- A clear, neat tick must be used:
- If ONE mark is allocated, ONE tick must be used:
- If TWO marks are allocated, TWO ticks must be used:
- The tick must be placed at the FACT that a mark is being allocated for
- Ticks must be kept SMALL, as various layers of moderation may take place
- Incorrect answers must be marked with a clear, neat cross:
- Use MORE than one cross across a discussion style questions to indicate that all facts have been considered
- Do NOT draw a line through an incorrect answer
- Do NOT underline the incorrect facts
- Where the maximum marks have been allocated in the first few sentences of an answer, place an M over the remainder of the text to indicate the maximum marks have been achieved.
For the following action words, ONE word answers are acceptable: give, list, name, state, identify
For the following action words, a FULL sentence must be written: describe, explain, evaluate, analyse, suggest, differentiate, distinguish, define, discuss, why, how
The following action words need to be read within its context to determine whether a ONE word answer or FULL sentence is required: provide, what, tabulate
Totalling and transferring of marks
- Each question must be totalled
- Each question paper has four questions, therefore four sub-totals per question paper is required
- Question totals to be written in right hand margin at the end of the sub-section and underlined
- Totals must be written legibly
- Leave room to write in moderated marks on different levels
- Question totals must be transferred to cover of answer book
Moderation
Marking on each level of moderation is done in the same way as the initial marking. All guidelines for marking must be adhered to.
If a mark for a question is changed after moderation, the moderator must strike through the marker’s mark and write down the new mark. 14 16
The total for the question paper must be re-calculated, and similarly be struck off and the new total to be written down. 32 36
RESOURCE MATERIAL
- An extract from topographic map 2820CB AUGRABIES.
- Orthophoto map 2820CB 7 AUGRABIES.
- NOTE: The resource material must be collected by schools for their own use.
INSTRUCTIONS AND INFORMATION
- Write your NAME in the space provided on the cover page.
- Answer ALL the questions in the spaces provided in this question paper.
- You are provided with a 1 : 50 000 topographic map (2820CB AUGRABIES) and an orthophoto map (2820CB 7 AUGRABIES) of a part of the mapped area.
- You must hand the topographic map and the orthophoto map to the invigilator at the end of this examination session.
- You must use the blank page at the back of this paper for all rough work.
DO NOT detach this page from the question paper. - Show ALL calculations and formulae, where applicable. Marks will be awarded for these.
- Indicate the unit of measurement in the final answer of calculations. Ensure that units are maintained throughout ALL your calculations and final answer.
- You may use a non-programmable calculator.
- A glossary of some of the English and Afrikaans words and their translations appears below.
GLOSSARY
(SOME OF THESE ENGLISH TERMS OR THEIR AFRIKAANS TRANSLATIONS MAY APPEAR ON THE MAPS.)
| ENGLISH | AFRIKAANS |
Canal / Furrow Island Hiking trail River North National park Weir Butte Augrabies Falls | Kanaal / Voor Eiland Voetslaanpad Rivier Noord Nasionale Park Keerwal Butte Augrabiesvalle |
QUESTION 1: MULTIPLE-CHOICE QUESTIONS
The questions below are based on the 1 : 50 000 topographic map 2820CB AUGRABIES, as well as the orthophoto map of a part of the mapped area. Various options are provided as possible answers to the following questions. Choose the answer and write only the letter (A–D) in the block next to each question.
1.1 The map to the south-west of the map 2820CB Augrabies is ...
A ✓
1.2 At what altitude would you be walking if you are at I along the hiking track, in block D8, on the topographic map?
C✓
1.3 The feature, Waterval, labelled J, in block B7, on the topographic map is a …
B✓
1.4 The Orange River is an example of a … river.
D✓
1.5 The general direction of flow of stream K, in block G2, on the topographic map is …
A✓
1.6 The true bearing of trigonometrical beacon, in block G9 from spot height 637, on the topographic map in block F11 is …
D✓
1.7 The stream order at L in blocks E12, on the topographic map is …
C✓
1.8 The human-made feature, labelled 1 on the orthophoto map is a/an …
A✓
1.9 The landform between 2 and 3 on the orthophoto map is a …
A✓
1.10 The drainage pattern of the area marked M, on the topographic map is ...
A✓
1.11 The location (grid reference) of Omdraai labelled N, in block E9, on the topographic map is …
D✓
1.12 The type of rural settlement pattern found at N in block E9 on the topographic map is …
A✓
1.13 The land use found at 4 on the orthophoto map is a ...
C✓
1.14 Augrabies marked O, in block G11, on the topographic map, is an example of a ... town.
A✓
1.15 P in block C4 on the topographic map is a/an …
D✓
(15 x 1) (15)
[15]
QUESTION 2: MAPWORK CALCULATIONS AND TECHNIQUES
2.1 Consult the topographic map and answer the following questions. You may use the orthophoto map.
2.1.1 Calculate the area in km² of the orthophoto map highlighted in red.
Show ALL calculations. Marks will be awarded for calculations.
L = 9,8 cm ✓ x 0,5 (98 mm ✓x 50 000) x (58 mm✓x 50 000)
= 4,9 1 000 000 1 000 000
B = 5,8 cm ✓ x 0,5 OR = 49 x 29
100 100
= 2,9 km
L x B = 4,9 ✓ x 2,9 ✓ = 4,9 x 2,9 ✓
= 14,21 km² ✓ = 14,21 km² ✓
(9,6 x 5,6) – (10 x 60) (Range: 13,44 km² – 15,0 km²)
(5 x 1) (5)
2.1.2 Why does the area covered by the orthophoto map look smaller on the topographic map?
Scale of orthophoto map is larger than topographic map ✓
Scale of orthophoto map is 1 : 10 000 and scale of topographic map is 1 : 50 000. ✓
[Any ONE] (1 x 1) (1)
2.2
2.2.1 Calculate the average gradient between spot height 658 and spot height 627, in block C5.
Show ALL calculations. Marks will be awarded for calculations.
Formula: Gradiet = Vertical Interval(VI)
Horizontal Equivalent(HE)
VI = 658 m – 627 m VI = 658 m – 627 m
= 31 m ✓ = 31 m ✓
HE = 2,7cm x 50 000 [2,5 cm – 2,9 cm] HE = 2,7 cm x 500
100
= 1 350 m ✓ [1 250 m – 1 450 m] = 1 350 m ✓
Gradiet = 31m ✓ = 31m ✓
1350m 1350m
= 1 : 43,5 ✓ = 1 : 43,5 ✓
[Range: 40,3 – 46,8]
(4 x 1) (4)
2.2.2
- Is the gradient, answer to QUESTION 2.2.1, a true reflection of the actual gradient between spot height 627 and spot height 658?
No ✓ (1 x 1) (1) - Give a reason for your answer to QUESTION 2.2.2(a).
- We are calculating the average gradient and not the actual gradient. ✓
- Between spot heights there is a gorge (steep slope). ✓
- Along the river there is steep gradient / contour lines close together. ✓ [Any ONE] (1 x 1) (1)
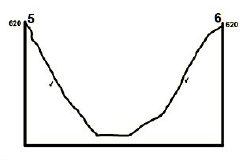
2.3 Study the area between the contour line indicated as 5 (620 m) and 6 (620 m) on the orthophoto map.
2.3.1 Draw a rough cross profile (not to scale) of the valley between 5 and 6, below.
 (2 x 1) (2)
2.3.2 Determine the intervisibility between 5 and 6.
There is a valley between 5 and 6.✓
5 and 6 same height (620 m) ✓
No obstruction / high lying area in between. ✓
[Any ONE] (1 x 1) (1)
2.4 Using the information on the topographic map, determine the magnetic declination for the year 2016.
Show ALL calculations. Marks will be awarded for calculations.
Difference in years: 2016 – 1991
= 25 years ✓
Total change: 25 x 5' ✓
= 125ˈ / 2°05ˈW ✓
Magnetic declination for 2016: 19°25' W + ✓ 125' W (2°05' W)
= 21°30' W ✓
(5 x 1) (5)
[20]
QUESTION 3: APPLICATION AND INTERPRETATION
3.1 Refer to block C6 on the topographic map showing rejuvenation.
3.1.1 Define the term rejuvenation.
When a river in the middle or lower course starts eroding actively downwards again. ✓
[Concept] (1 x 1) (1)
3.1.2 Give evidence from the topographic map showing rejuvenation.
- Waterfall/knickpoint ✓✓
- Gorge ✓✓
- Deep, steep sided valley ✓✓
- Incised meander ✓✓
[Any ONE] (1 x 2) (2)
3.2 In the mapped area the Orange River is in its middle course. Give TWO pieces of evidence from the map to support this statement.
- A lot of meanders ✓✓
- Braided pattern ✓✓
- Flood plain starts widening ✓✓
[Any TWO] (2 x 2) (4)
3.3
3.3.1 Give TWO reasons evident on the topographic map, which indicates that the mapped area receives limited rainfall.
- Limited vegetation ✓✓
- Numerous non-perennial rivers ✓✓
- Large areas uncultivated ✓✓
- Presence of windpumps ✓✓
[Any TWO]
(2 x 2) (4)
3.3.2 State ONE method that the rural settlement in block D11, implemented to supplement the limited water available.
Windpump ✓ (1 x 1) (1)
3.4 Evaluate the effect that the Orange River had on the construction of transport routes.
- Only one main road crosses the river ✓✓
- Braided river makes road construction difficult-floods ✓✓
- Expensive to build bridges ✓✓
- Roads are constructed along the river ✓✓
[Any TWO] (2 x 2) (4)
3.5 Study the agricultural area in the vicinity of the area numbered Q, on the topographic map.
3.5.1 Name TWO agricultural activities found in this area.
- Orchards or vineyards (examples) ✓
- Crop farming (examples) ✓
- Fruit farming (examples) ✓
[Any TWO] (2 x 1) (2)
3.5.2 Suggest TWO reasons evident on the topographic map, that favoured farming in the vicinity of Q.
- Flat land/Flood plain ✓✓
- Availability of water ✓✓
- Irrigation possible – canals/furrows ✓✓
- Fertile soil – alluvial ✓✓
[Any TWO] (2 x 2) (4)
3.6 List TWO services offered by the town of Augrabies, labelled O, on the topographic map.
- Schools / educational ✓
- Store / shops / retail ✓
- Church / worship ✓
- Police station / security ✓
[Any TWO] (2 x 1) (2)
3.7 What evidence suggests that conservation is taking place on the mapped area?
Augrabies Falls National Park ✓✓ (1 x 2) (2)
[25]
QUESTION 4: GEOGRAPHICAL INFORMATION SYSTEMS (GIS)
4.1 Choose the correct answer from those given between brackets.
4.1.1 An aerial photograph uses (raster/vector) data.
Raster ✓ (1 x 1) (1)
4.1.2 A spot height on a topographic map represents data in the form of a (polygon/point/line).
Point ✓ (1 x 1) (1)
4.1.3 (Spatial/Spectral) resolution is the number of pixels used in digital image.
Spatial ✓ (1 x 1) (1)
4.1.4 An orthophoto map that contains vector and raster data is an example of data (integration/fragmentation).
Integration ✓ (1 x 1) (1)
4.2 GIS is useful in disaster management. The Augrabies Municipality is concerned about developments which may be too close to the river or the natural floodplain in block G11, on the topographic map.
4.2.1 What is a geographical database?
Digitally recorded information from sources such as maps, photographs, satellite images etc. ✓
[Concept] (1 x 1) (1)
4.2.2 Evaluate the suitability of using satellite images in obtaining geographical information in an event of the Orange River flooding the floodplain.
- Satellite images / photos can be used to analyse the impact of flooding ✓✓
- Comparing photos we will see the expansion of flooding ✓✓
- Can be used to assess impact of flooding in areas that are inaccessible ✓✓
- Previous satellite images ✓✓
[Any TWO] (2 x 2) (4)
4.2.3 Explain the role of buffering in protecting the floodplain.
Create a buffer zone next to the river where no development may take place. ✓✓ (1 x 2) (2)
4.2.4 Explain how GIS could assist the local authorities with planning after flooding in the Augrabies area.
- Check service delivery shortfalls after a flood ✓✓
- Route planning to supply relief✓✓
- Analyse the quality of service ✓✓
- Relief coordination ✓✓
- Prioritising relief ✓✓
- Satellite pictures to assess the destruction ✓✓
[Any TWO]
(2 x 2) (4)
[15]
TOTAL: 75