Geography Paper 1 Questions - Grade 12 June 2021 Exemplars
Share via Whatsapp Join our WhatsApp Group Join our Telegram GroupINSTRUCTIONS AND INFORMATION
- This question paper consists of FOUR questions.
- All questions are COMPULSORY.
- All diagrams and maps are included in the ANNEXURE.
- Number the questions correctly according to the numbering system used in this question paper.
- Leave a line between subsections of questions answered.
- Start EACH question on a NEW page.
- Do NOT write in the margins of the ANSWER BOOK.
- Illustrate your answers with labelled diagrams, where possible.
- Mark allocation is as follows: (2 x 1) = (2) means that TWO facts are required for ONE mark each (2 x 2) = (4) means that TWO facts are required for TWO marks each
- If words/action verbs like Name, Identify, Provide, Classify, are used in a question, ONE-word answers are acceptable.
If words/action verbs like Discuss, Define, Explain, Comment, Evaluate, Justify, Suggest and Substantiate are used in a question, FULL sentences or phrases are required.
All paragraph questions must be answered in FULL sentences. - In SECTION B you are provided with a 1: 50 000 topographical map (3419 AB CALEDON) and an orthophoto map (3419AB 24 CALEDON) of a part of the mapped area.
- Show ALL calculations. Marks will be allocated for these.
- Indicate the unit of measurement in the final answer of calculations, for example 10 km, 4°C.
- You may use a non-programmable calculator and a magnifying glass.
- The area demarcated in RED/BLACK on the topographical map represents the area covered by the orthophoto map.
- Write neatly and legibly.
QUESTIONS
SECTION A
QUESTION 1: WEATHER AND CLIMATOLOGY
1.1 FIGURE 1.1 illustrate the development and weather characteristics of a tropical cyclone. Choose the correct concept/term from those given between brackets to make the statements TRUE. Write only the word(s) next to the question number (1.1.1–1.1.5) in the ANSWER BOOK.
1.1.1 (Stratus/Cumulonimbus) clouds forms part of the upper cloud in the sketch.
1.1.2 This tropical cyclone developed in the (southern/northern) hemisphere.
1.1.3 The (easterly/westerly) global wind belt causes tropical cyclones to generally move in a westerly direction.
1.1.4 (Heavy rainfall/Clear skies) dominate the area at A.
1.1.5 This tropical cyclone will develop (inside/outside) 5° north and south latitudes. (5 x 1) (5)
1.2 FIGURE 1.2 shows an urban heat island. Choose the correct word(s)/ numbers from those given between brackets. Write only the word(s)/numbers next to the question number (1.2.1–1.2.5) in the ANSWER BOOK.
1.2.1 Lines representing temperature are called (isohyets/isotherms).
1.2.2 The difference in temperature between A and B is (10°C/12°C).
1.2.3 Evaporation rates are higher in the (CBD/rural area).
1.2.4 Frequency of rainfall is more in the (CBD/rural area).
1.2.5 The general flow of air during the day will be from (A to B/B to A). (5 x 1) (5)
1.3 FIGURE 1.3 is a synoptic weather map.
1.3.1 What do isobars represent on a synoptic weather map? (1 x 1) (1)
1.3.2 FIGURE 1.3, illustrates typical winter conditions. Give ONE reason evident on the map to substantiate this statement. (1 x 1) (1)
1.3.3 Explain the influence of high-pressure cell A on the position of the inversion layer in winter. (2 x 2) (4)
1.3.4 Refer to the mid-latitude cyclone B.
- In which direction does this mid-latitude cyclone move? (1 x 1) (1)
- Sketch a cross profile of front C. Indicate the following on the cross profile:
- Type of clouds
- Gradient of the front
- Warm and cold air masses (4 x 1) (4)
- Why is there a difference in wind direction between weather stations D and E? (2 x 2) (4)
1.4 FIGURE 1.4 shows the development of a moisture front.
1.4.1 What is a moisture front? (1 x 2) (2)
1.4.2 In which season does a moisture front mainly develop? (1 x 1) (1)
1.4.3 How does pressure systems A and B influence the development of the moisture front? (2 x 2) (4)
1.4.4 In a paragraph of approximately EIGHT lines, explain how the weather from cloud type C, will impact farming in the interior of South Africa. (4 x 2) (8)
[40]
QUESTION 2: GEOMORPHOLOGY
2.1 FIGURE 2.1 shows a drainage basin. Choose the correct concept/term/ number from those given between brackets to make the statements TRUE. Write only the concept/term/number next to the question number (2.1.1–2.1.5) in the ANSWER BOOK.
2.1.1 This drainage pattern is known as (trellis/dendritic).
2.1.2 The tributaries in the drainage basin join the mainstream at (right angles/acute angles).
2.1.3 (Uniform/Varied) resistance to erosion is a characteristic of the underlying rock structure of this drainage pattern.
2.1.4 The stream order at A is (2/3).
2.1.5 A/An (interfluve /watershed) can be found at B. (5 x 1) (5)
2.2 Refer to FIGURE 2.2 and write only the correct type of flow (laminar or turbulent) next to the statement number (2.2.1–2.2.5) below.
2.2.1 This type of flow generally dominates the lower course of a river
2.2.2 Erosion is the main geomorphological process
2.2.3 This type of flow will promote the development of floodplains
2.2.4 This type of flow usually occurs in the upper course of the river
2.2.5 The outer bank of a river experiences this type of flow (5 x 1) (5)
2.3 FIGURE 2.3 shows the process of river capture.
2.3.1 What is a watershed? (1 x 2) (2)
2.3.2 Name ONE condition that would promote headward erosion. (1 x 1) (1)
2.3.3 What influence will headward erosion have on the watershed? (1 x 1) (1)
2.3.4 Discuss TWO natural (physical) changes that river A experienced after river capture. (2 x 2) (4)
2.3.5 Why is the river at B known as a misfit stream? (1 x 2) (2)
2.3.6 Refer to the feature labelled C.
- Give the name of feature C. (1 x 1) (1)
- Explain TWO economic advantages of feature C. (2 x 2) (4)
2.4 Study FIGURE 2.4. which illustrates a type of river during different seasons.
2.4.1 Name the type of river evident in the sketches A and B. (1 x 1) (1)
2.4.2 Refer to the water table in both sketches.
- Define a water table. (1 x 2) (2)
- Differentiate between the water table in cross profiles A and B. (1 x 2) (2)
- Describe the impact of the water wells on the water table. (1 x 2) (2)
2.4.3 In paragraph of approximately EIGHT lines, explain the possible impact that deforestation will have on the volume of water in the river. (4 x 2) (8)
[40]
QUESTION 3: RURAL AND URBAN SETTLEMENTS
3.1 Choose a term in COLUMN B that matches the description in COLUMN A. Write only the letter (A–F) next to the question number (3.1.1–3.1.5) in the ANSWER BOOK, for example 3.1.6 G.
COLUMN A | COLUMN B | ||
3.1.1 | The natural piece of land on which a settlement can be found | A | wet point settlement |
3.1.2 | Refers to the settlement in relation to its surrounding environment | B | unifunctional |
3.1.3 | Settlement located away from the danger of water | C | situation |
3.1.4 | Secondary and tertiary activities dominate in this type of settlement | D | dry point settlement |
3.1.5 | Settlement in dry areas located near the water source | E | multifunctional |
F | site | ||
(5 x 1) (5)
3.2 Match the term/concepts below to the statements that follow. Write ONLY the term/concept next to the question number, e.g, 3.2.6 South Africa.
urban hierarchy; break-of-bulk point; threshold population; urban profile; Invasion; urban sprawl |
3.2.1 Minimum number of people needed to make a business profitable
3.2.2 Replacement of the original type of land use with another
3.2.3 Ranking of urban settlements according to function
3.2.4 The shapeless uncontrolled expansion of the city
3.2.5 Shows the height of the buildings in the city (5 x 1) (5)
3.3 FIGURE 3.3 depicts a rural settlement pattern.
3.3.1 Define the concept settlement pattern. (1 x 2) (2)
3.3.2 Name the settlement pattern depicted by FIGURE 3.3. (1 x 1) (1)
3.3.3 Explain TWO physical (natural) factors that influenced the pattern of this settlement. (2 x 2) (4)
3.3.4 Refer to the shape of the settlement.
- Identify the shape of this settlement. (1 x 1) (1)
- Name the main factor that has influenced the shape of the settlement. (1 x 1) (1)
- Comment on ONE advantage of this shape for the community. (1 x 1) (1)
3.3.5 Explain TWO economic disadvantages for farmer X. (2 x 2) (4)
3.4 FIGURE 3.4 is a cartoon based on the process of urban expansion.
3.4.1 Define the concept urban expansion. (1 x 2) (2)
3.4.2 Explain why urban expansion is not possible without urban growth. (1 x 2) (2)
3.4.3 Comment on the environmental injustice caused by urban expansion in FIGURE 3.4. (2 x 2) (4)
3.4.4 In a paragraph of approximately EIGHT lines, evaluate the positive impact of urban expansion on job creation. (4 x 2) (8)
[40]
TOTAL SECTION A: 120
SECTION B: MAPWORK APPLICATION
QUESTION 4: CALCULATIONS AND MAP SKILLS
4.1 Refer to blocks D4 and D5 on the topographical map.
4.1.1 Calculate the average gradient of the N2 road between bench marks 346,5 (block D4) and 328,8 (block D5) on the topographical map. The answer must be written as a RATIO.
Show ALL calculations. Marks will be awarded for calculations. (5 x 1) (5)
Formula: Gradient = Vertical Interval (V.I)
Horizontal Equivalent (H.E)
4.2 Various options are provided as possible answers to QUESTIONS 4.2.1 and
4.2.2. Choose the correct answer and write only the letter (A–D) next to the question number.
4.2.1 The length (L) of the hospital (area 5) on the orthophoto map is … centimetres (cm).
- 30
- 13
- 3
- 1,4 (1 x 1) (1)
4.2.2 The breadth (B) of the hospital (area 5) on the orthophoto map is… centimetres (cm).
- 0,3
- 13
- 3,3
- 1,3 (1 x 1) (1)
4.2.3 Using the answers to QUESTIONS 4.2.1 and 4.2.2, calculate the area of the hospital 5 in square meters (m²). Show ALL calculations. Marks will be awarded for calculations.
Formula: Area = length (L) x breadth (B) (3 x 1) (3)
MAP INTERPRETATION
4.3 Refer to the topographical and orthophoto maps.
4.3.1 What type of climate does Caledon experience? Give a reason for your answer. (1 + 2) (3)
4.4 Rainfall in the mapped area is seasonal.
4.4.1 Which one of the cross sections A or B would represent the rivers in block D1?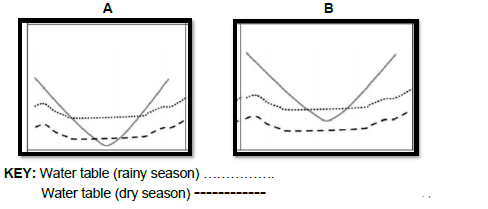
(1 x 1) (1)
4.4.2 Explain your answer to QUESTION 4.4.1. (1 x 2) (2)
4.5 Refer to the block B5 on the topographical map.
4.5.1 Identify the dominant drainage pattern of the rivers in block B5 on the topographical map. (1 x 1) (1)
4.5.2 Provide ONE map evidence to explain why the drainage pattern identified in QUESTION 4.5.1 developed. (1 x 2) (2)
4.5.3 In which general direction are the rivers in block B5 flowing? (1 x 1) (1)
4.5.4 Give ONE map evidence to support the answer to QUESTION 4.5.3. (1 x 2) (2)
GEOGRAPHICAL INFORMATION SYSTEMS (GIS)
4.6 Various options are provided as possible answers to the following question. Choose the correct answer and write only the letter (A–D) next to the question number (4.6.1) in your ANSWER BOOK.
4.6.1 A map designed to show a single spatial distribution pattern, using a specific map type, is known as a …
- topographical map.
- orthophoto map.
- world map.
- thematic map. (1 x 1) (1)
4.7 Spatial data is stored in two different formats, namely vector and raster data.
4.7.1 Is the orthophoto map of Caledon, vector or raster? (1 x 1) (1)
4.7.2 Give ONE reason for your answer to QUESTION 4.7.1 (1 x 2) (2)
4.7.3 Explain TWO reason why GIS specialists prefer using vector data
on topographical maps to raster data. (2 x 2) (4)
[30]
TOTAL SECTION B: 30
GRANDTOTAL: 150