Mathematical Literacy Paper 1 Questions - Grade 12 June 2021 Exemplars
Share via Whatsapp Join our WhatsApp Group Join our Telegram GroupINSTRUCTIONS AND INFORMATION
- This question paper consists of FIVE questions. Answer ALL the questions.
- 2.1 Use the ANSWER SHEET to answer QUESTION 2.1 3.
2.2 Write your NAME and GRADE in the spaces provided on the ANSWER SHEET FOR QUESTION 2.1.3
Hand in the ANSWER SHEET with your ANSWER BOOK. - Number the answers correctly according to the numbering system used in this question paper.
- Diagrams are not necessarily drawn to scale, unless stated otherwise.
- Round off ALL final answers according to the context used, unless stated otherwise.
- Indicate units of measurement, where applicable.
- Start EACH question on a NEW page.
- Show ALL calculations clearly.
- Write neatly and legibly.
QUESTIONS
QUESTION 1
1.1 TABLE 1 below shows some facts relating to Joy who sells sweets at school during break and lunch times.
TABLE 1: JOY’S SALES
50 sweets per packet | 2 packets sold daily |
Cost of one sweet | R0,70 VAT inclusive |
Selling price of one sweet | R1,00 VAT inclusive |
Profit on one sweet | R0,30 |
Use the above information and Value Added Tax (VAT) at 15% to answer the questions that follow.
1.1.1 Explain the meaning of VAT inclusive price. (2)
1.1.2 Calculate the percentage profit Joy makes on ONE sweet. (2)
1.1.3 Calculate Joy’s daily profit from her sales. (2)
1.2
The electricity tariffs in the municipality area where Jane lives is charged according to usage on a sliding scale indicated by BLOCKS in the table below. | |
Block number and kWh | Price (cent/kWh) |
BLOCK 1: (≤ 50 kWh) | 96,61 |
BLOCK 2: (>50 kWh- ≤ 400 kWh) | 125,21 |
BLOCK 3: (>400 kWh- ≤ 600 kWh) | 206,56 |
BLOCK 4: (>600 kWh) | 354,85 |
1.2.1 Calculate the rate (in Rands) that Jane paid for the first 50 kWh she used in May 2021. (2)
1.2.2 Determine the total amount that Jane paid for the first 50 kWh used. (2)
1.2.3 Determine the maximum number of kWh to be paid for in the second block. (2)
1.3 Electricity generated by different sources in South Africa in 2016 are shown in the pie chart below.
PIE CHART SHOWING ELECTRICITY GENERATED BY DIFFERENT SOURCES IN SOUTH AFRICA IN 2016: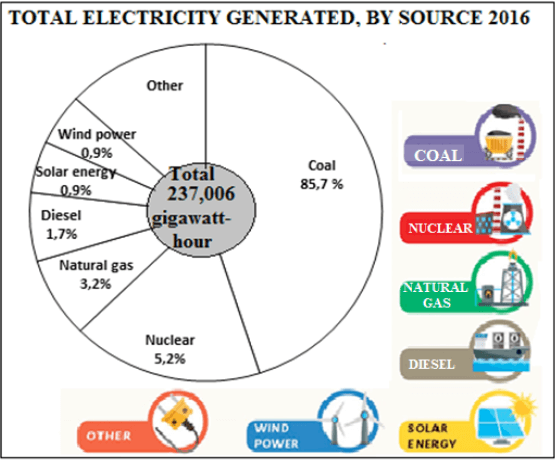
[Source: Old Mutual Wealth & Investments, STATS SA. 2016]
1000 000 Kilo Watt hour (KWh) = 1 Gigawatt hour (GWh)
Use the above information to answer the questions that follow.
1.3.1 Calculate the percentage of electricity generated from other sources. (2)
1.3.2 Determine the Gigawatt hour (GWh) generated from natural gas. (2)
1.3.3 Express the ratio of the energy generated from nuclear to diesel. (2)
1.3.4 Convert the total Gigawatt hour generated by all sources in 2016 into KWh. (3)
[21]
QUESTION 2
2.1
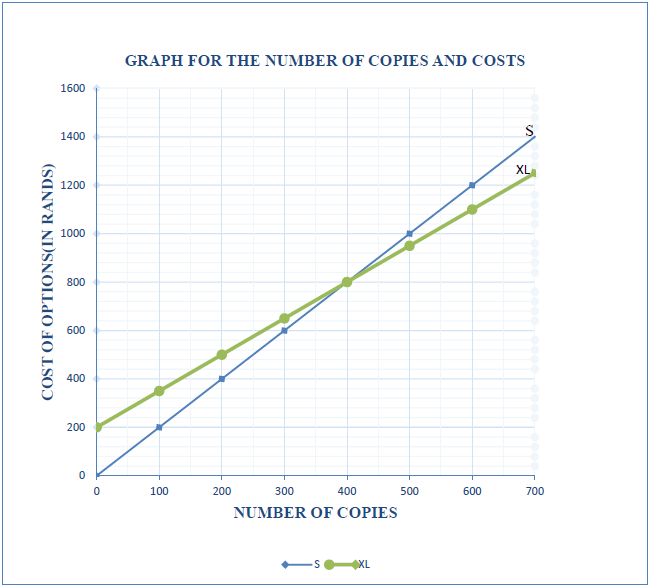
Funda SSS is to select an option to use for photocopying and printing of monthly tests for learners in various grades. TABLE 3: COST OF PRINTING OPTIONS | |||||
No of copies | 0 | 100 | 200 | 300 | 700 |
Cost of Option S (in Rands) | 0 | 200 | 400 | 600 | 1400 |
Cost of Option M (in Rands) | 500 | 550 | 600 | 650 | 850 |
Cost of Option XL (in Rands) | 200 | 350 | 500 | 650 | 1050 |
Use the above information to answer the following questions.
2.1.1 Name the independent variable in TABLE 3. (2)
2.1.2 Graphs to represent the relationship between the copies printed and the total cost of Option S and Option XL are drawn. On the same system of axes sketch the graph representing copies and total cost for Option M. (3)
2.1.3 Use the graph to determine the number of copies at break-even point for Options S and XL. (2)
2.1.4 Use the graph to determine the difference in cost of printing 600 copies between Option S and Option M. (3)
2.2
The financial statement for the years ending June 2018 and June 2109 for MATC municipality is shown TABLE 4 below. The statement shows some of the departments. | |||||
TABLE 4: | STATEMENT FOR YEARS ENDING JUNE 2018 AND JUNE 2019 FOR MATC MUNICIPALITY | ||||
2018 | 2019 | ||||
Departments | Income in Rands | Expenditure in Rands | Income in Rands | Expenditure in Rands | Surplus OR Deficit in Rands |
Public Works | 6 403 835 | 7 044 218 | 6 985 561 | 8 382 673 | (1 397 112) |
Statistics | 2 461 729 | 3 200 247 | 2 177 786 | 1 959 750 | (2 118 036) |
Education | 21 476 614 | 21 519 059 | 22 993 225 | 24 765 440 | (1 772 215) |
Agriculture | 49 137 536 | 50 342 890 | 52 307 560 | 51 200 460 | 1 107 100 |
Health | 38 496 020 | 39 785 320 | 42 645 344 | 63 960 168 | (21 314 824) |
Energy | 7 512 788 | --- | 8 145 563 | 8 145 975 | (412) |
Use the information in TABLE 4 to answer the following questions.
2.2.1 The expenditure for the year 2018 is 368 182 more than 2018 income. Calculate the percentage difference (rounded off to the nearest whole percentage) in the expenditure of Department of Energy from 2018 to 2019.
Use the following formula:
% difference = ??????????? ????−??????????? ???? × ???% (5)
??????????? ????
2.2.2 Determine the projected income in 2020 from Department of Public Works if it is expected to increase by 18,5% based on 2019 income. (4)
2.2.3 Calculate the probability (expressed as a simplified fraction) of randomly selecting a department that had income less than 25 million in 2018. (3)
2.3
Mr John is to deposit R5 000 in his bank account. |
John claims that the difference of depositing R5 000 at an ATM and at a branch is R18,20.
Verify this statement. (5)
[27]
QUESTION 3
Study the information on the number of special needs schools and number of designated full-service schools from the 9 provinces, and answer the questions that follow.
PROVINCE | NUMBER OF SPECIAL NEEDS SCHOOLS | NUMBER OF DESIGNATED FULL- SERVICE SCHOOLS |
Eastern Cape | 43 | 30 |
Free State | 21 | 175 |
Gauteng | 149 | 19 |
KwaZulu -Natal | 72 | E |
Limpopo | 34 | 17 |
Mpumalanga | 20 | 140 |
North West | 32 | 182 |
Northern Cape | 11 | 12 |
Western Cape | 83 | 40 |
TOTAL | 675 |
[Adapted from www.iol.co.za]
3.1 Write down the total number of special needs schools in South Africa. (2)
3.2 Arrange the number of special needs schools in descending order. (2)
3.3 Write down the simplified ratio of the number of special schools in Mpumalanga with the number of designated full-service schools in Western Cape. (3)
3.4 Calculate the value of E, the number of designated full-service schools in KwaZulu-Natal. (2)
3.5 Express the total number of schools in North West as a percentage of total number of schools in South Africa. (4)
3.6 Determine the province that lies in the median position of the special needs school. (2)
[15]
QUESTION 4
The data for the number of learners at Vula High School in 2018, is represented in the table below. Some of the values have been omitted.
TABLE 5: NUMBER OF LEARNERS AT VULA HIGH SCHOOL
Grades | 8 | 9 | 10 | 11 | 12 | Total |
Females | 121 | 103 | 76 | B | 42 | 406 |
Males | A | 95 | 78 | 59 | 33 | … |
Total | 222 | … | 154 | 123 | 75 | C |
4.1 Calculate the missing values A, B and C respectively, that are represented in the TABLE 5. (5)
4.2 Describe the trend in the number of male learners from Grade 8 to Grade 12 and give a possible reason for your answer. (4)
4.3 In this school, the teacher-learner ratio is 1 : 35. The SGB (School Governing Body) claims that the school is supposed to have 21 teachers. Verify, with the necessary calculations, whether their claim is valid or not. (4)
4.4 Determine the probability as a percentage of randomly selecting a female learner in this school that is either in Grade 8 or Grade 9. (3)
4.5 The school is a No Fee school where the learners receive one meal per day.
NOTE:
- The government is paying R3,18 per learner per day for nutrition
- Term 1 has 51 days
- Term 2 is 5 days shorter than term 1
The school principal claims that if the number of learners in 2019 increase by 3% more than what they were in 2018, the total school nutrition amount for term 1 and term 2 will be more than R245 000. Verify, with the necessary calculations, whether the principal’s claim is valid or not. (7)
[23]
QUESTION 5
5.1 Inako, is a 63-year-old educator at Vula High School. She earns R43 500 a month. She contributes 7,5 % of her gross salary towards her pension fund every month. She has a medical aid and has also medical cover for the following people:
- Her 83-year-old mother, Nondwe
- Her 65-year-old husband, Ngqika
- Two grandchildren, Alakhe and Ukuye
Taxable income (R) | Rates of tax (R) |
1 – 216 200 | 18% of taxable income |
216 201 – 337 800 | 38 916 + 26% of taxable income above 216 200 |
337 801 – 467 500 | 70 532 + 31% of taxable income above 337 800 |
467 501 – 613 600 | 110 739 + 36% of taxable income above 467 500 |
613 601 – 782 200 | 163 335 + 39% of taxable income 613 600 |
782 201 – 1 656 600 | 229 089 +41% of taxable income above 782 200 |
1 656 601 and above | 587 593 + 45% of taxable income above 1 656 600 |
REBATES | |
AGE | TAX YEAR – 2022 |
Primary – less than 65 | R15 714 |
65 and older | R8 613 |
75 and older | R2 871 |
Medical Tax Credit | Tax Year – 2022 |
Taxpayer | R332 |
First Dependent | R332 |
Each Additional Dependent | R224 |
[Source: www.sars.gov.za]
5.1.1 Calculate Inako’s annual income. (2)
5.1.2 Inako calculated her monthly tax and said she will contribute R1 790. Verify this statement. (6)
5.2
Mathematical Literacy P1 of the Trial Examination in 2020 was marked out of 150 marks. Learners in a grade 12B class scored the marks listed below. 101; 107; 121; 98; 100; 114; 103; 101; 110; 105; 102; 99; 95; 111; 115 |
Use the above information to answer the questions that follow.
5.2.1 Determine the median. (2)
5.2.2 Calculate the interquartile range (IQR). (5)
[15]
TOTAL: 100
ANSWER SHEET:
QUESTION 2.1.3