MATHEMATICAL LITERACY PAPER 2 GRADE 12 QUESTIONS - NSC EXAMS PAST PAPERS AND MEMOS NOVEMBER 2020
Share via Whatsapp Join our WhatsApp Group Join our Telegram GroupMATHEMATICAL LITERACY PAPER 2
GRADE 12
NATIONAL SENIOR CERTIFICATE
INSTRUCTIONS AND INFORMATION
- This question paper consists of FOUR questions. Answer ALL the questions.
- 2.1 Use the ANNEXURES in the ADDENDUM to answer the following questions:
- ANNEXURE A for QUESTION 2.1
- ANNEXURE B for QUESTION 2.2
- ANNEXURE C for QUESTION 3.2
- ANNEXURE D for QUESTION 4.1
2.2 Answer QUESTION 4.2 on the attached ANSWER SHEET.
2.3 Write your centre number and examination number in the spaces on the ANSWER SHEET. Hand in the ANSWER SHEET with your ANSWER BOOK.
- Number the answers correctly according to the numbering system used in this question paper.
- Start EACH question on a NEW page.
- You may use an approved calculator (non-programmable and non-graphical), unless stated otherwise.
- Show ALL calculations clearly.
- Round off ALL final answers appropriately according to the given context, unless stated otherwise.
- Indicate units of measurement, where applicable.
- Maps and diagrams are NOT necessarily drawn to scale, unless stated otherwise.
- Write neatly and legibly.
QUESTION 1
1.1 Lindiwe is interested in early childhood education. She researched the number of learners enrolled in early childhood education in selected countries.
TABLE 1 shows the number of learners that were enrolled in early childhood education in selected countries.
TABLE 1: NUMBER OF LEARNERS ENROLLED IN EARLY CHILDHOOD EDUCATION BY COUNTRY FROM 2014 TO 2016
| COUNTRY | 2014 | 2015 | 2016 |
| Bulgaria | 240 622 | 241 123 | 232 025 |
| Denmark | 300 278 | 291 683 | 284 655 |
| Germany | 2 970 436 | 3 014 046 | 3 090 459 |
| Ireland | 78 056 | 71 096 | 82 245 |
| Greece | 231 155 | 225 596 | 214 109 |
| Cyprus | N | 29 669 | 30 505 |
| Slovenia | 83 700 | 84 750 | 85 407 |
| Serbia | 189 304 | 192 005 | 199 790 |
| Turkey | 1 064 190 | 1 158 826 | 1 221 165 |
| Slovakia | 158 195 | 161 906 | 163 740 |
| United Kingdom | 1 596 803 | 2 035 420 | 2 248 162 |
Use TABLE 1 to answer the questions that follow.
1.1.1 Determine the difference in the number of learners enrolled in Slovakia in 2015 and 2016. (3)
1.1.2 The range of the number of learners enrolled for 2014 is 2 947 664.
Calculate the value of N which represents the lowest number of learners enrolled for 2014. (3)
1.1.3 Describe the trend shown by the number of learners enrolled in Greece. (2)
1.1.4 Determine whether Turkey or the United Kingdom had the largest percentage increase from 2014 to 2016 regarding the number of learners enrolled in early childhood education. Show ALL your calculations. (6)
1.1.5 Determine (as a decimal fraction) the probability of randomly selecting a country in this table which shows a decline in enrolment from 2015 to 2016. (3)
1.1.6 The cost per child for early childhood education in Denmark in 2016 was €520,83 per month, while the comparative cost in Slovenia was €350 per month.
Lindiwe stated that the ratio of the total amount spent for all the learners enrolled in 2016 in Denmark compared to Slovenia is more than 5 : 1.
Verify her statement. (6)
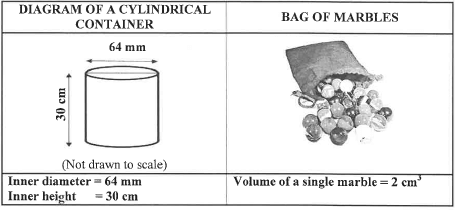
1.2 Lindiwe bought two bags of dirty marbles from her neighbour at 830,00 per bag. Each bag contained 100 marbles. She intends to wash the marbles before selling them to her friends at school. She uses a cylindrical container to wash the marbles in, as shown in the diagram below.
You may use the following formulae:
Volume of a single marble = 2 cm3
Volume of a cylinder = 3,142 x radius2 x height
Circumference of a circle = 3,142 x diameter
NOTE: 1 000 cm3 = 1 litre
Use the above information to answer the questions that follow.
1.2.1 Lindiwe made a profit of 120% from selling one bag of marbles.
Calculate, in rand, the selling price of EACH marble. (4)
1.2.2 To wash the marbles, Lindiwe placed all the marbles from both bags into the cylindrical container. She then filled the container with water.Lindiwe stated that more than half a litre of water was required to fill the cylindrical container with the marbles already inside it.
Verify, showing ALL calculations, whether the statement is valid. (9)
1.2.3 Calculate, in cm, the outer circumference of the cylindrical container used to wash the marbles if the container is made of metal 0,5 mm thick. (3)
[39]
QUESTION 2
2.1 After an examination, a total of 2 808 Mathematical Literacy scripts were marked at a particular marking centre.
TABLE 2 in ANNEXURE A shows data about the marking team, hours worked, tariffs and the amounts claimed for the marking and moderation of these scripts.
The marking process was planned as follows:
- The first day of marking was a Monday, starting at 14:00.
- Thereafter marking started at 08:00 and ended at 20:00 on a full marking day.
- Paid working hours excluded tea, lunch and supper breaks.
The marking team was paid a travel allowance of R3,26 per km for a total of 11 542 km travelled.
TABLE 3 below shows the times for actual marking and breaks for a full day.
TABLE 3: TIMES FOR ACTUAL MARKING AND BREAKS
| START | TEA 1 | LUNCH | TEA 2 | SUPPER | FINISH |
| 8:00 | 10:00-10:15 | 13:15-14:00 | 15:15-15:30 | 17:45-18:30 | 120:00 |
Use the above information and ANNEXURE A to answer the questions that follow.
2.1.1 Determine the total amount claimed by the chief moderator (CM) and the internal moderator (IM). (3)
2.1.2 Calculate the value of A in TABLE 2. (2)
2.1.3 Markers are allowed a maximum number of marking hours based on the following formula:
Number of marking hours = Total number of scripts x 28
Number of markers x 60
- Using the above formula, determine the expected time and the day on which the markers are likely to finish marking. (6)
- Determine the actual day and time when markers finished, according to the hours claimed, if marking started at 14:00 on Monday. (4)
- Give ONE possible reason why the markers finished before the expected time. (2)
2.1.4 A total amount of R400 000 was budgeted for the marking team at this particular marking centre.
Verify whether this amount would be sufficient to pay the team for transport, marking and moderation of the scripts. (6)
2.2 The IM and CM were allocated tables with semicircular-shaped table tops, as shown in the picture below. Lumka, the centre manager, explained that two semicircular table tops are made from one square piece of wood.
TABLE WITH A SEMICIRCULAR TOP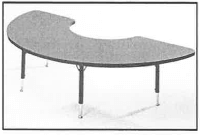
The information on how the semicircular tops are cut from the square piece of wood is in ANNEXURE B. The dimensions of the wood are 2,7 m x 2,7 m with a thickness of 38 mm.
You may use the following formulae:
Area of a square = side x side
Area of a semicircle =3,142 x radius 2
2
Volume of a rectangular prism = length x width x height
Use the information above and ANNEXURE B to answer the questions that follow.
2.2.1 Lumka stated that 2,01 m2 of the wood is cut off when making two semicircular-shaped table tops from one piece of wood.
Verify, showing calculations, whether Lumka's statement is valid. (8)
2.2.2 The wood used is sold for R1 215 per cubic metre, excluding VAT at 15%.
Calculate the total cost, including VAT, of the wood to make 12 semi- circular table tops. (7)
[38]
QUESTION 3
3.1 A group of students at a nursing college wrote two tests for the same course.
TABLE 4 shows the test scores, as percentages, of the students.
TABLE 4: TEST RESULTS, AS PERCENTAGES, OF THE STUDENTS
| TEST | STUDENTS | |||||||||||||||||
| Paul | Oscar | Helen | Elsie | Fiona | Ian | Linda | Beauty | Charl | Rose | Kevin | Danie | Neo | Joan | Goitse | Mangi | Zena | Anita | |
| 1 | 89 | 90 | 87 | 90 | 83 | 83 | 94 | 73 | 88 | Y | 97 | 95 | 95 | 86 | 73 | 73 | 84 | 63 |
| 2 | 50 | 52 | 57 | 61 | 61 | 63 | 65 | 65 | 66 | 67 | 67 | 68 | 70 | 71 | 75 | 78 | 79 | 79 |
A student who scores 85% or more for a test is awarded a distinction.
Use the information in TABLE 4 to answer the questions that follow.
3.1.1 Explain, giving a reason, whether the above data is discrete or continuous. (3)
3.1.2 Determine the median score for Test 2. (3)
3.1.3 The mean score for Test 1 was 84%. Calculate the value of Y. (4)
3.1.4 Identify the candidates whose test scores in both tests differed by 30%. (3)
3.1.5 Calculate the value of the interquartile range for Test 2. (4)
3.1.6 Express, in simplified fractional form, the probability of randomly selecting a candidate who did not get a distinction for Test 1. (3)
3.1.7 Determine the modal test score for Test 1. (2)
3.2 Mangiwe, one of the students at the nursing college, visited the Ambleside town centre and stayed at the Queens Hotel for one week.
The Ambleside town centre map is given in ANNEXURE C.
Use ANNEXURE C to answer the questions that follow.
3.2.1 Identify the road in which parking is not allowed. (2)
3.2.2 Mangiwe travels from Keswick to Rydal Road.
Give ONE reason why she cannot turn right into Compston Road. (2)
3.2.3 Give the general direction of the Queens Hotel from the tennis courts. (2)
3.2.4 On the map, X is a point at the information centre and Y is a point at the University of Cumbria.
Use the scale on the map to calculate, in yards, the straight-line distance from X to Y. (4)
3.2.5 Mangiwe parked in Church Street from 12:00 to 15:25. A traffic officer who monitors the area issued her with a fine.
NOTE: A fine is the amount of money that someone has to pay if there is an offence.
- Write down for which offence the traffic officer issued her with a fine. (2)
- Mangiwe was fined £79,75 by the traffic officer.
Calculate, to the nearest £, the rate per hour for this fine. (5)
[39]
QUESTION 4
4.1 Keitumetse is a South African student who is on holiday in Australia. He went to the Lawrence Theatre to attend a musical concert.
ANNEXURE D shows the seating arrangements of the Lawrence Theatre.
TABLE 5 shows the single ticket prices for a visit to the theatre, in Australian dollar (inclusive of Australian VAT of 10%).
TABLE 5: COST OF A SINGLE TICKET IN AUSTRALIAN DOLLAR
| FRIDAY AND SATURDAY | |
| Adult | $34,70 |
| Student | $30,50 |
| Children (14 and younger) | $17,60 |
| THURSDAY AND SUNDAY | |
| Adult | $28,60 |
| Student | $26,40 |
| Children (14 and younger) | $17,60 |
Use ANNEXURE D and the above information to answer the questions that follow.
4.1.1 Determine, as a percentage, the probability of randomly selecting an odd numbered seat for a disabled person from all the seats in the theatre. (3)
4.1.2 Identify the row and seat number for a person who is seated as follows:
- In Section B
- Fourth row from the stage
- In the middle seat (2)
4.1.3 Keitumetse is seated in D7 of Section A. He has to assist his friend in All after the show.
Describe the shortest possible path he would follow to reach All. (4)
4.1.4 Sections A to C had the following number of people attending on a Thursday.
| ADULTS | STUDENT | CHILDREN (14 AND YOUNGER) | |
| Section A | 53 | 15 | 9 |
| Section B | 57 | 32 | 15 |
| Section C | 40 | 10 | 9 |
There was a claim that an amount of exactly $5 796, excluding Australian VAT, was collected on that day.
Verify, with calculations, whether this claim is CORRECT. (8)
4.1.5 Keitumetse bought a ticket for a Friday show.
Calculate how much the ticket costs in South African rand.
Use the exchange rates below.
EXCHANGE RATE
1 Australian dollar (AUD) =0,71 United States dollar (USD)
1 United States dollar (USD) =14,43 South African rand (ZAR) (3)
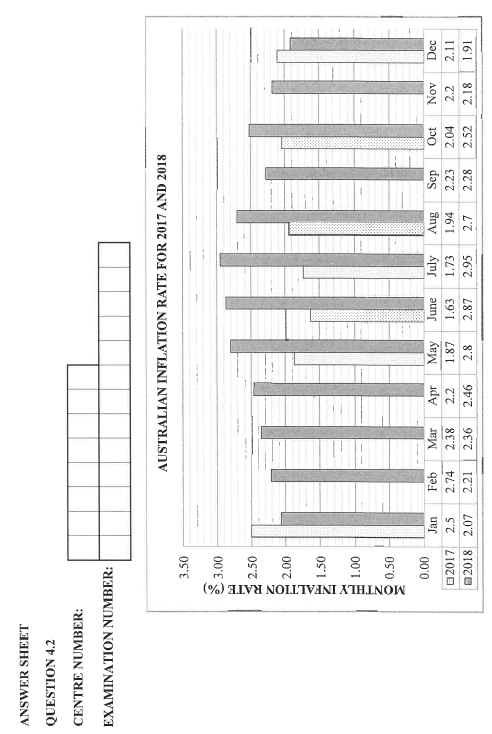
4.2 While in Australia, Keitumetse studied the inflation rate.
The attached ANSWER SHEET shows graphs and data regarding the monthly inflation rate for 2017 and 2018 in Australia.
NOTE: The 2017 graph is incomplete; however, the 2018 graph is complete.
Use the information on the ANSWER SHEET to answer the questions that follow.
4.2.1 Complete the FIVE missing bars for 2017 on the ANSWER SHEET.
4.2.2 Comparing 2017 with 2018, state the month in which the difference in the inflation rate was the greatest and calculate this difference.
4.2.3 Keitumetse noted the trend in the inflation rate from the end of October 2018 to the end of December 2018.
He then stated that a car costing AUD156 831,36 at the end of October 2018 would cost AUD6 500 more in January 2019.
Verify, showing ALL calculations, whether his statement is CORRECT. (6)
[34]
TOTAL: 150
ANSWER SHEET
QUESTION 4.2