GEOGRAPHY PAPER 2 GRADE 12 QUESTIONS - NSC EXAMS PAST PAPERS AND MEMOS NOVEMBER 2020
Share via Whatsapp Join our WhatsApp Group Join our Telegram GroupGEOGRAPHY PAPER 2
GRADE 12
NOVEMBER 2020
NATIONAL SENIOR CERTIFICATE
RESOURCE MATERIAL
- An extract from the topographic map 2527CA RUSTENBURG (WEST)
- Orthophoto map 2527 CA 15 TLHABANE
- NOTE: The resource material must be collected by schools for their own use.
INSTRUCTIONS AND INFORMATION
- Write your EXAMINATION NUMBER and CENTRE NUMBER in the spaces on the cover page.
- Answer ALL the questions in the spaces provided in this question paper.
- You are provided with a 1 : 50 000 topographic map 2527CA RUSTENBURG (WEST) and an orthophoto map 2527 CA 15 TLHABANE of a part of the mapped area.
- You must hand the topographic map and the orthophoto map to the invigilator at the end of this examination session.
- You may use the blank page at the end of this question paper for all rough work and calculations. Do NOT detach this page from the question paper.
- Show ALL calculations and formulae, where applicable. Marks will be allocated for these.
- Indicate the unit of measurement or compass direction in the final answer of calculations, e.g. 10 km; 2,1 cm; west of true north.
- You may use a non-programmable calculator.
- You may make use of a magnifying glass.
- The area demarcated in RED/BLACK on the topographic map represents the area covered by the orthophoto map.
- The following English terms and their Afrikaans translations are shown on the topographic map:
ENGLISH - AFRIKAANS
Diggings - Uitgrawings
River - Rivier
Cemetery - Begraafplaas
Protected Natural Environment - Beskermde Natuurlike Omgewing
Technical College - Tegniese Kollege
GENERAL INFORMATION ON RUSTENBURG
Rustenburg was established in 1851 as a central place town to support a fertile farming area producing citrus fruit, tobacco, peanuts, sunflower seeds, maize, wheat and cattle. The area became a primary agricultural region with vast citrus estates due to the favourable climate.
Rustenburg is home to the two largest platinum mines in the world and the world's largest platinum refinery, which processes around 70% of the world's platinum. Lately, the vast citrus estates in the region have been in constant decline due to pollution from increased smelting and beneficiating processes by the mines. (Beneficiation is when value is added to the raw materials.)
Rustenburg has a temperate climate. It has very warm summers and mild winters. Due to the altitude, summers are not quite as hot as one might expect. Precipitation occurs mainly in summer.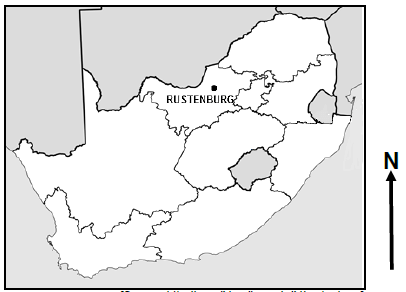
QUESTION 1: MULTIPLE-CHOICE QUESTIONS
The questions below are based on the 1 : 50 000 topographic map 2527CA RUSTENBURG (WEST) as well as the orthophoto map 2527 CA 15 TLHABANE. Various options are provided as possible answers to the following questions. Choose the answer and write only the letter (A–D) in the block next to each question.
1.1 Rustenburg is situated in …
- Gauteng.
- Limpopo.
- the North West.
- the Free State.
1.2 The contour interval on the orthophoto map is … metres.
- 5
- 10
- 20
- 25
1.3 The map index of the topographic map, south-west of 2527CA RUSTENBURG, is …
- 2527CC.
- 2526DD.
- 2527AC.
- 2526BD.
1.4 The grid reference/coordinates of trigonometrical station 256 in block C1 on the topographic map is …
- 25°34'35"S 27°05'19"E.
- 27°05'35"S 25°34'19"E.
- 27°05'34"S 25°35'19"E.
- 25°34'23"S 27°05'33"E.
1.5 The approximate distance from K in block H10 on the topographic map along the railway to Rustenburg in a south-easterly direction is … km.
- 1
- 1,5
- 2
- 2,5
1.6 Stream L in block B2 on the topographic map flows in a … direction.
- south-westerly
- northerly
- north-easterly
- southerly
1.7 The climate of Rustenburg is mainly influenced by …
- altitude.
- fronts.
- the ocean.
- aspect.
1.8 At night the … wind influences the temperatures of Geelhoutpark (H8) on the topographic map.
- anabatic
- katabatic
- onshore
- offshore
1.9 The N4 passes through a … in the Magaliesberg mountain range.
- ridge
- valley
- gorge
- gap
1.10 Land-use zone 1 on the orthophoto map is the … zone.
- transition
- commercial
- residential
- industrial
1.11 The physical expansion of Rustenburg in a westerly direction is mostly limited by the ...
- cultivated lands.
- national road.
- mountain range.
- water features.
1.12 Rustenburg was originally classified as a … town.
- central place
- specialised
- break-of-bulk
- trade and transport
1.13 The main activity within the Magaliesberg Protected Natural Environment on the topographic map is part of the … sector.
- primary
- secondary
- tertiary
- quaternary
1.14 The feature at 2 on the orthophoto map is a/an …
- industry.
- mall.
- school.
- station.
1.15 The vertical aerial photograph from which the orthophoto map was produced was taken between …
- 06:00 and 07:00.
- 10:00 and 11:00.
- 14:00 and 15:00.
- 18:00 and 19:00.
(15 x 1)
[15]
QUESTION 2: MAP CALCULATIONS AND TECHNIQUES
2.1 Refer to the hiking trail in blocks A5 and B5 on the topographic map.
2.1.1 Determine the 2020 magnetic bearing (MB) of the hiking trail from M to N in blocks A5 and B5 if the updated mean magnetic declination (MD) is 17°40' west of true north. Show ALL calculations. Marks will be awarded for calculations.
Formula:
Magnetic bearing = true bearing + magnetic declination
_____________________________________________________
_____________________________________________________
_____________________________________________________
(2 x 1) (2)
2.1.2 Explain why it is important to use the magnetic bearing instead of the true bearing to determine direction on topographic maps.
_____________________________________________________
_____________________________________________________
(1 x 1) (1)
2.2 Refer to the orthophoto map and answer the questions on gradient.
2.2.1 Determine the average gradient of the slope for a truck that will transport its cargo (goods) from the industries at 3 (1 160 m above sea level) to the railway station at 4 (1 148 m above sea level) on the orthophoto map. Show ALL calculations. Marks will be awarded for calculations.
Formula: Average
gradient = vertical interval (VI)
horizontal equivalent (HE)
______________________________________________________
______________________________________________________
______________________________________________________
______________________________________________________
______________________________________________________
______________________________________________________
(5 x 1)(5)
2.2.2 Fill in the correct values for X and Y in the space on the diagram below with regard to the answer to QUESTION 2.2.1.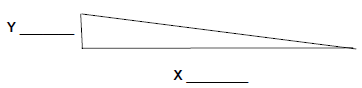
Y _______
X ________
(2 x 1) (2)
2.2.3 Why will it be easy for the truck to transport its cargo over the calculated gradient?
_____________________________________________________
_____________________________________________________
(1 x 1) (1)
2.3 Refer to the line drawn from spot height 1461 in block C1 to the ruin at O in block C2 on the topographic map.
2.3.1 Complete the rough cross-section below from spot height 1461 in block C1 to the ruin at O in block C2.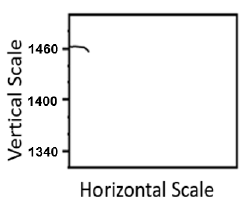
(3 x 1) (3)
2.3.2 Is the ruin at O in block C2 intervisible from spot height 1461 in block C1? Answer YES or NO. Give a reason for your answer.
Yes OR No: ___________________________________________
Reason: ____________________________________________
____________________________________________
(1 + 1) (2)
2.2.2 Fill in the correct values for X and Y in the space on the diagram below with regard to the answer to QUESTION 2.2.1.
Y _______
X ________
(2 x 1) (2)
2.3.3 Calculate the vertical exaggeration (VE) of the cross-section between spot height 1461 in block C1 and the ruin at O in block C2 if the vertical scale is 1 cm represents 20 m.
Show ALL calculations. Marks will be awarded for calculations.
Formula: Vertical exaggeration = vertical scale (VS)
horizontal scale (HS)
_____________________________________________________
_____________________________________________________
_____________________________________________________
_____________________________________________________
_____________________________________________________
(4 x 1) (4)
[20]
QUESTION 3: APPLICATION AND INTERPRETATION
3.1 The temperature graph below illustrates the general temperature change during the day from spot height 1614 (P) in block 6 to the technical college (Q) in block I10 on the topographic map.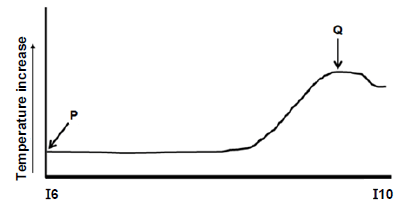
3.1.1 The general trend of the change in temperature from P to Q is (increasing/decreasing)
______________________________________________________
(1 x 1) (1)
3.1.2 Give a reason from the topographic map to explain the difference in temperature at P and Q.
______________________________________________________
______________________________________________________
______________________________________________________
______________________________________________________
(1 x 2) (2)
3.1.3 Identify and explain ONE strategy that could be implemented by the local municipality in block 10.
Identification: __________________________________________
Explanation: __________________________________________
__________________________________________
(1 + 2) (3)
3.2 Refer to the river system in block C7.
3.2.1Identify the drainage pattern of the river system in block C7.
_____________________________________________________
(1 x 1) (1)
3.2.2 State the underlying rock structure associated with the drainage pattern identified in QUESTION 3.2.1.
_____________________________________________________
(1 x 1) (1)
3.2.3 Determine the stream order of the river system at point R.
_____________________________________________________
_____________________________________________________
(1 x 2) (2)
3.3 Refer to the stream flowing southwards in block G4.
3.3.1 In which stage of the fluvial cycle is the stream in block G4?
_____________________________________________________
(1 x 1) (1)
3.3.2 Give ONE piece of evidence from block G4 to support your answer to QUESTION 3.3.1.
_____________________________________________________
_____________________________________________________
(1 x 1) (1)
3.4 Refer to blocks C10 and G7 on the topographic map.
3.4.1
Identify the street plans (patterns) at S in block C10 and at T in block G7.
Street plan S: _________________________________________
Street plan T: _________________________________________
(2 x 1) (2)
3.4.2 State TWO advantages of street plan (pattern) T in block G7.
Street plan T: _________________________________________
_________________________________________
_________________________________________
_________________________________________
(2 x 1) (2)
3.4.3 Give evidence from the topographic map for the development of the street plan (pattern) at T.
______________________________________________________
______________________________________________________
______________________________________________________
(1 x 2) (2)
3.5 Refer to the mining activities of Townlands Platinum Mines on the orthophoto map and topographic map.
3.5.1 Give ONE reason evident on the topographic map that indicates that mining at Townlands Platinum Mines is practised on a large scale.
_____________________________________________________
(1 x 1) (1)
3.5.2 Explain how mining activities at Townlands Platinum Mines caused an environmental injustice in the area.
______________________________________________________
______________________________________________________
(1 x 2) (2)
3.5.3 Discuss the positive impact that Townlands Platinum Mines has on the economic development of Rustenburg.
______________________________________________________
______________________________________________________
______________________________________________________
______________________________________________________
______________________________________________________
(2 x 2) (4)
[25]
QUESTION 4: GEOGRAPHICAL INFORMATION SYSTEMS (GIS)
4.1 COMPONENTS OF GIS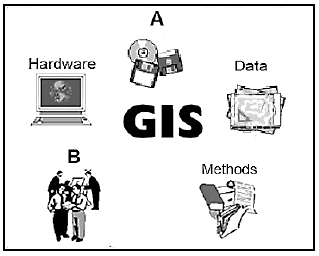
4.1.1 Identify the components A and B.
A: ___________________________________________________
B: ___________________________________________________
(2 x 1) (2)
4.1.2 Why is component B important in GIS processes?
_____________________________________________________
_____________________________________________________
(1 x 2) (2)
4.2 Two locations (blocks F10 and H7 on the topographic map) have been identified for the development of a new cemetery. A GIS specialist has been appointed by the local municipality to recommend the best site for this development.
4.2.1 Which of the TWO locations (block F10 or block H7) will be most suitable for the development of the new cemetery?
_____________________________________________________
(1 x 1) (1)
4.2.2 Identify TWO data layers that can be used in deciding on the new location for the cemetery.
_____________________________________________________
_____________________________________________________
(2 x 1) (2)
4.2.3 Give a reason for your choice of ONE of the data layers identified in QUESTION 4.2.2.
_____________________________________________________
_____________________________________________________
(1 x 2) (2)
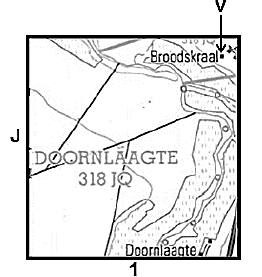
4.3 Refer to block J1 on the topographic map.
4.3.1 What is vector data?
______________________________________________________
______________________________________________________
(1 x 1) (1)
4.3.2 Give ONE natural line feature that the farmer used to determine the site of the cultivated land in block J1.
______________________________________________________
(1 x 1) (1)
4.3.3 Agricultural activity in block J1 on the topographic map is confined along the river.
- Draw the symbol of the point feature that is used to extract ground water to increase water supply for agriculture, on the enlarged illustration of block J1 below. This feature must be 40 mm southwest of the Broodskraal settlement (V).

(2 x 1) (2) - Explain the advantage of this specific location of the point feature drawn in QUESTION 4.3.3(a) for farming in the area.
_______________________________________________
_______________________________________________
_______________________________________________
(1 x 2) (2)
[15]
TOTAL: 75