GRADE 12 MATHEMATICAL LITERACY PAPER 2 QUESTIONS - NSC PAST PAPERS AND MEMOS SEPTEMBER 2016
Share via Whatsapp Join our WhatsApp Group Join our Telegram GroupMATHEMATICAL LITERACY P2 1
GRADE 12
NATIONAL SENIOR CERTIFICATE
SEPTEMBER 2016
INSTRUCTIONS AND INFORMATION TO CANDIDATES
Read the following instructions carefully before answering the questions.
- This question paper consists of FIVE questions. Answer ALL the questions.
- Use the ADDENDUM for the following questions:
ADDENDUM A for QUESTION 5.2
ANSWER SHEET 1 for QUESTION 2.2.2
ANSWER SHEET 2 for QUESTIONS 4.2.4
Write your name in the spaces provided on the ANSWER SHEETS and hand in the ANSWER SHEETS with your ANSWER BOOK. - Number the questions correctly according to the numbering system used in this question paper.
- An approved calculator (non-programmable and non-graphical) may be used, unless stated otherwise.
- ALL calculations must be shown clearly.
- Round off ALL final answers appropriately accordingly to the given context, unless stated otherwise.
- Start EACH question on a NEW page.
- Write neatly and legibly.
QUESTION 1
Vuka Rentals is a flat rental company owning blocks of flats. Each block has 3
The maximum number of registered tenants are as follows:
|
1.1 Determine the total number of each type of flats. (2)
1.2 Calculate the total income if all the flats are rented out. (4)
1.3 Glenn is a University student from Ghana renting a one bedroomed flat. He received a birthday present of 415 Ghanaian Cedi from a friend. If he uses the money for paying his rent, how much more does he need to cover one month’s rent (rounded off to the nearest rand) given that 1 Ghanaian Cedi = 3,77 South African Rand. (4)
1.4 If the occupancy of the two bedroom flats decrease to 93,75% and the one bedroom flats remain at 100%, calculate the amount that Vuka rentals lost. (4)
1.5 If there are in all 8 blocks 37,5% adults, how many children are in these flats? (5)
1.6 The blocks of flats are numbered from BLOCK A to BLOCK H, while the flats have numerical values. Calculate the probability that the number of a flat will be C1. (2)
[21]
QUESTION 2
2.1
Class results for a Mathematical Literacy P1 trial exam are as follow:
|
2.1.1 Given that the range of these results is 78. Calculate the value of A, which is the minimum value. (3)
2.1.2 The mean for the set of data is 90. Calculate the modal value. (4)
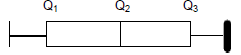
2.1.3 Calculate the missing values (Q1; Q2 and Q3) in the box and whisker diagram. (6)
2.1.4 For the same class the mean of the results in Mathematical Literacy P2 is 75. Compare and comment on the mean of the two papers. (2)
2.1.5 Determine the probability that a learner will be in the bottom 25%. (2)
2.2
| Lucy is a teacher who is organising a matric farewell at a certain high school. She goes to two venues and is given two separate prices which are outlined as follows: Venue A: Venue booking : R1 500 Catering cost per person : R150 Disc Jockey (DJ) : R1 200 Venue B: Venue booking (including DJ) : R1 300 Catering cost per person : R220 There will be 55 learners, 10 teachers and a guest speaker who will attend the farewell |
2.2.1 Calculate the difference between the total costs for the rent of the two venues with the maximum number of people attending the matric farewell. (5)
2.2.2 In ANSWER SHEET 1, a line graph is drawn showing the cost of venue A for learners only. On the same set of axes, draw a line graph showing the cost of venue B, for learners only. (6)
2.2.3 Explain the meaning of the breakeven point in this context and write its values according to the graph. (3)
[31]
QUESTION 3
3.1 A 45 year old Sivu is earning R368 450 per annum. He contributes monthly to a medical aid scheme for himself and two dependants.
2015/2016 T ax Year (1 March 2015 to 29 February 2016)
| TAXABLE INCOME (R) RATES OF TAX (R) | |
| 0 – 181 900 | 18% of each R1 |
| 181 901 – 284 100 | 32 742 + 26% of the amount above 181 900 |
| 284 101 – 393 200 | 59 314 + 31% of the amount above 284 100 |
| 393 201 – 550 100 | 93 135 + 36% of the amount above 393 200 |
| 550 101 – 701 300 | 149 619 + 39% of the amount above 550 100 |
| 701 301 and above | 208 587 + 41% of the amount above 701 300 |
| Tax thresholds applicable to individuals | Amount |
| Persons under 65 years | R3 650 |
| Persons 65 years and older | R114 800 |
| Persons 75 years and older | R128 500 |
| Medical aid credits (monthly contributions) | Amount |
| Tax payer | R270 |
| First dependant | R270 |
| Additional dependants | R181 |
3.1.1 Calculate his monthly tax as a percentage of his monthly income by using the tax table provided. (8)
3.1.2 With the necessary calculations, explain how his tax payable would be influenced if he was 78 years old and earning the same amount of money. (3)
3.1.3 He has R30 704,17 to invest for 3 years. He has to choose between two options.
Option1: Invest at an institution that offers 6,9% simple interest per annum
OR
Option 2: Invest at a bank that offers an interest rate of 6% per annum, yearly compounded
Show with the necessary calculation to advise him which option is the best for him. (8)
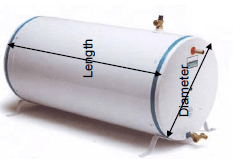
3.2 Sivu needs a new geyser for his flat. He finds two geysers advertised as follows.
| Model | Diameter × length |
| 50 ℓ | 450 mm × 610 mm |
| 100 ℓ | 550 mm × 840 mm |
You may use the following formula:
|
3.2.1 Sivu claims that if one geyser’s volume is double the other, the surface area should also be doubled. By using the formula, prove that Sivu’s claim is valid or not. (8)
3.2.2 If the geyser drawn above is the 100 ℓ-model as advertised, write the scale used to draw the length of the geyser in the form 1 : … (3)
[30]
QUESTION 4
4.1
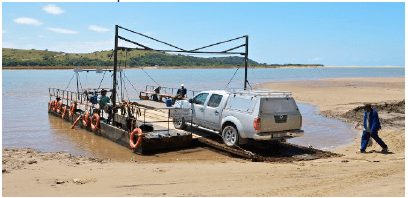
An American family, Mr. and Mrs. Jones is visiting friends in Johannesburg. Whilst in Johannesburg they get information about the wild coast and decide to book a holiday at Kei mouth in the Eastern Cape Province. At Kei mouth you can take a ferry through the Kei River to Qolora for fishing which is 10 km from the Kei mouth.
This service does not operate when the river is in flood.
|
4.1.1 They arrived at the airport at 08:00 and they spend 3 hours and 45 minutes in East London. They travelled to Kei mouth at an average speed of 90 kilometers per hour.
Show by using calculations whether they will arrive on time to have lunch at 12:30 at Kei Mouth.
You may use the formula: Average speed = distance travelled
time taken (6)
4.1.2 If they hire a car from Avis and decide to go for fishing in Qolora for two days, they will need to use the ferry to and from Qolora during those two days. They feel that 700 American dollars will be enough to cover the hiring, accommodation and ferry rides. Use calculations to support this statement if the exchange rate during their vacation is 1 American dollar ($) = 14,391 South African rand. (6)
4.1.3 There is a warning that when the river is in flood, there will be no ferry rides. What is the reason for this? (2)
4.2 Mr. Jones studied a South African table showing the births and Aids related deaths for the period 2002 to 2014.
| Year | Number of births | Total number of deaths | Total number of Aids related deaths | Percentage Aids related deaths |
| 2002 | 1 111 987 | 631 383 | 275 444 | 43,6 |
| 2003 | 1 117 024 | 667 902 | 313 477 | 46,9 |
| 2004 | 120 172 | 697 473 | 344 141 | 49,3 |
| 2005 | 1 122 148 | 716083 | 363 910 | 50,8 |
| 2006 | 1 125 755 | 694 227 | 343 194 | 49,4 |
| 2007 | 1 132 500 | 647 827 | 297 659 | 45,9 |
| 2008 | 1 141 468 | 617 202 | 257 504 | 41,7 |
| 2009 | 1 152 319 | 590 322 | 228 051 | 38,6 |
| 2010 | 1 163 629 | 578 953 | 213 864 | 36,9 |
| 2011 | 1 173 164 | 580 460 | 211 839 | 36,5 |
| 2012 | 1 184 867 | 575 546 | 203 293 | 35,3 |
| 2013 | 1 196 395 | 565 310 | 189 376 | 33,5 |
| 2014 | 1 207 711 | 551 389 | 171 733 | 31,1 |
4.2.1 What is the trend in the percentage Aids related deaths from 2007 to 2014? Give TWO possible reasons for the trend observed. (4)
4.2.2 Calculate the difference in the total number of births and the total number of Aids related deaths from 2006 to 2014. (4)
4.2.3 Sinakho claims that the percentage increase in the number of births between 2013 and 2014 is more than 1,5%. Show with the necessary calculations whether the claim is valid or not. (4)
4.2.4 Draw a bar graph to represent the percentage Aids related deaths.
Use ANSWER SHEET 2 to illustrate 2002, 2005, 2007, 2009 and 2014. (5)
[31]
QUESTION 5
5.1
Avela is a carpenter who is starting a small business. He builds free standing cupboards as shown in the picture (cupboards are not drawn to scale).
|
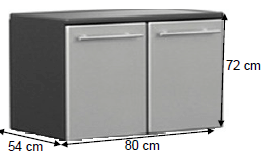
5.1.1 Give a reason why the dimensions for the doors are less than those for the front side of the cupboard. (2)
5.1.2 If he makes 10 cabinets, how many boards of each material will he need? (10)
5.1.3 Avela has budgeted R6 000 to buy the material including VAT. Use calculations to prove whether his budget will be enough. (6)
5.1.4 He temporarily stores his cupboards in a storeroom which is 3 m × 4 m. With calculations show whether the space will be enough to store the 10 cupboards (cupboards are not stored on top of each other). (4)
5.2
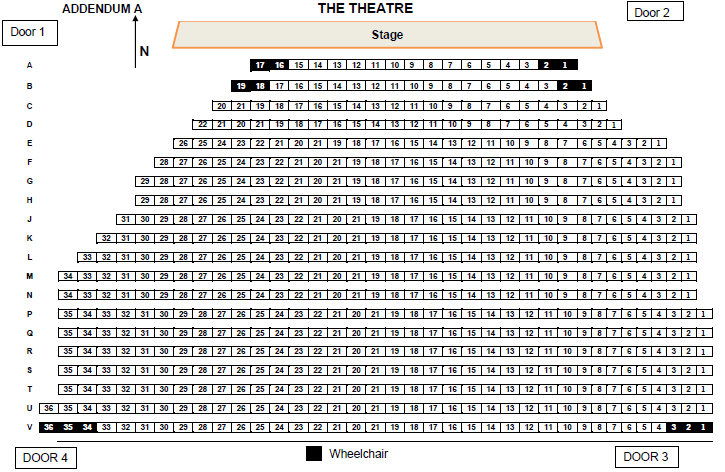
| ADDENDUM A shows a seating plan of a theatre in London. Study the seating plan and answer the questions that follow. |
5.2.1 On a particular performance, the theater was full excluding 2 wheelchair seats. Information collected on this day was that the ratio of men to women was 2 : 3. How many men attended on this particular day? (3)
5.2.2 Yolanda is on holiday in London and wants to book a ticket for a show at the theater. She is going with a wheelchair bound friend who needs to sit next to her. She wants a chair which is on the left hand side of the stage when entering through Door 3. Write down all the possible row and chair numbers that she can choose. (She is not selective about the distance from the stage). (3)
5.2.3 What is the probability of getting seat no 25 or 24 in this theatre? Write your final answer to 3 decimal places. (3)
5.2.4 A couple books tickets and are told that the only two available seats which can accommodate them sitting next to each other, are on the right-hand side of the stage if they enter through Door 1, on the 12th row from the stage and in second and third position on that side. Give clear directions for this couple to their seats if they enter the theatre through Door 4 and mention their seat numbers. (3)
5.2.5 Two people coming to watch a play in the theatre, one is farsighted and the other shortsighted. The only available seats are D11 and T12. Suggest with reasons which seat is suitable for each of these persons. (3)
[37]
TOTAL: 150
ANSWER SHEET 1
NAME:
GRADE 12:
Graph to show costs of venues with different number of learners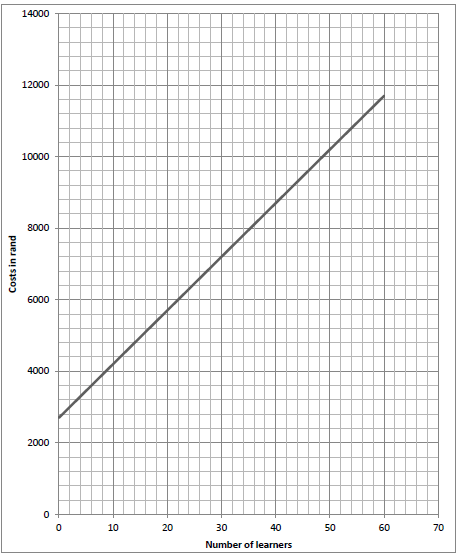
ANSWER SHEET 2
NAME:
GRADE 12:
Bar graph to show percentage Aids related deaths over a period of years