MATHEMATICS PAPER 2 GRADE 12 QUESTIONS - NSC EXAMS PAST PAPERS AND MEMOS MAY/JUNE 2021
Share via Whatsapp Join our WhatsApp Group Join our Telegram GroupMATHEMATICS PAPER 2
GRADE 12
NATIONAL SENIOR CERTIFICATE EXAMINATIONS
MAY/JUNE 2021
INSTRUCTIONS AND INFORMATION
Read the following instructions carefully before answering the questions.
- This question paper consists of 10 questions.
- Answer ALL the questions in the SPECIAL ANSWER BOOK provided.
- Clearly show ALL calculations, diagrams, graphs, etc. that you have used in determining your answers.
- Answers only will NOT necessarily be awarded full marks.
- You may use an approved scientific calculator (non-programmable and non-graphical), unless stated otherwise.
- If necessary, round off answers correct to TWO decimal places, unless stated otherwise.
- Diagrams are NOT necessarily drawn to scale.
- An information sheet with formulae is included at the end of the question paper.
- Write neatly and legibly.
QUESTION 1
1.1 Sam recorded the amount of data (in MB) that she had used on each of the first 15 days in April. The information is shown in the table below.
| 26 | 13 | 3 | 18 | 12 | 34 | 24 | 58 | 16 | 10 | 15 | 69 | 20 | 17 | 40 |
1.1.1Calculate the:
- Mean for the data set (2)
- Standard deviation for the data set (1)
1.1.2 Determine the number of days on which the amount of data used was greater than one standard deviation above the mean. (2)
1.1.3 Calculate the maximum total amount of data that Sam must use for the remainder of the month if she wishes for the overall mean of April to be 80% of the mean for the first 15 days.(3)
1.2 The wind speed (in km per hour) and temperature (in °C) for a certain town were recorded at 16:00 for a period of 10 days. The information is shown in the table below.
| WIND SPEED IN km/h (x) | 2 | 6 | 15 | 20 | 25 | 17 | 11 | 24 | 13 | 22 |
| TEMPERATURE IN ºC (y) | 28 | 26 | 22 | 22 | 16 | 20 | 24 | 19 | 26 | 19 |
1.2.1 Determine the equation of the least squares regression line for the data. (3)
1.2.2 Predict the temperature at 16:00 if, on a certain day, the wind speed of this town was 9 km per hour.
1.2.3 Interpret the value of b in the context of the data.
QUESTION 2
The number of days that Grade 8 learners were absent at a certain high school during a year was recorded. This information is represented in the table below.
| NUMBER OF DAYS ABSENT | NUMBER OF LEARNERS |
| 0 < x < 5 | 34 |
| 5 < x < 10 | 45 |
| 10 < x <15 | 98 |
| 15 < x < 20 | 43 |
| 20 < x < 25 | 7 |
| 25 < x < 30 | 3 |
2.1 Write down the modal class for the data. (1)
2.2 How many learners were absent from school for less than 15 days? (1)
2.3 How many Grade 8 learners are at the school? (1)
2.4 Draw a cumulative frequency graph (ogive) to represent the data above on the grid provided in the ANSWER BOOK. (4)
2.5 Use the cumulative frequency graph to determine the median number of days the Grade 8 learners were absent. (2)
QUESTION 3
In the diagram, S(0 ; -16), L and Q(4 ; - 8) are the vertices of ASLQ having LQ perpendicular to SQ. SL and SQ are produced to points R and M respectively such that RM II LQ. SM produced cuts the x-axis at N(8 ; 0). QM = MN. T and P are the y-intercepts of RM and LQ respectively.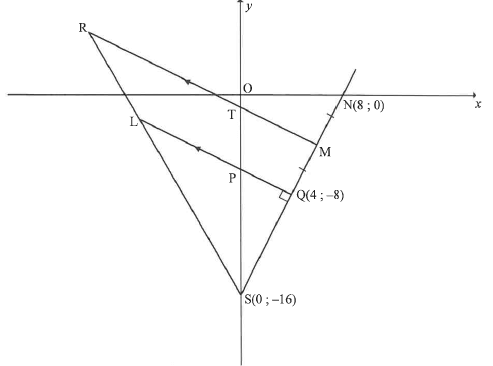
3.1 Calculate the coordinates of M.
3.2 Calculate the gradient of NS.
3.3 Show that the equation of line LQ is y = -½x - 6 .
3.4 Determine the equation of a circle having centre at O, the origin, and also passing through S. (2)
3.5 Calculate the coordinates of T.
3.6 Determine LS/RS
3.7 Calculate the area of PTMQ.
QUESTION 4
In the diagram, P(-3 ; 4) is the centre of the circle. V(k ;1) and W are the endpoints of a diameter. The circle intersects the y-axis at B and C. BCVW is a cyclic quadrilateral.
CV is produced to intersect the x-axis at T. OTC = a .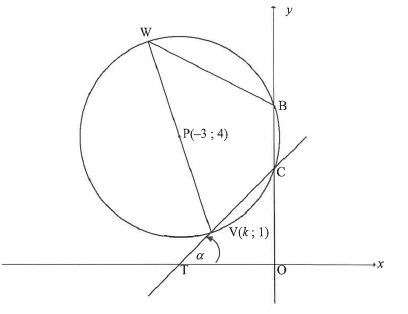
4.1 The radius of the circle is -Nri( . Calculate the value of k if point V is to the right of point P. Clearly show ALL calculations. (5)
4.2 The equation of the circle is given as x2 + 6x + y2 - 8y +15 = 0 . Calculate the length of BC. (4)
4.3 If k= - 2, calculate the size of:
4.3.1 a (3)
4.3.2 VWB (2)
4.4 A new circle is obtained when the given circle is reflected about the line y = 1.
Determine the:
4.4.1 Coordinates of Q, the centre of the new circle (2)
4.4.2 Equation of the new circle in the form (x - a)2 + (y- b)2 = r2 (2)
4.4.3 Equations of the lines drawn parallel to the y-axis and passing through the points of intersection of the two circles (2)
[20]
QUESTION 5
5.1 Simplify the expression to a single trigonometric term:
tan(- x). cos x.sin(x -180°)-1 (5)
5.2 Given: cos 35° = m
Without using a calculator, determine the value of EACH of the following in terms of m:
5.2.1cos 215° (2)
5.2.2 sin 20° (3)
5.3 Determine the general solution of:
cos 4x. cos x + sin x. sin 4x = - 0,7 (4)
5.4 Prove the identity: sin 4x. cos 2x - 2 cos 4x. sin x. cos x = cos 2 x - sin2 x (4)
tan 2x
[18]
QUESTION 6
In the diagram below, the graphs of f (x) = cos 2x and g(x) = - sin x are drawn for the interval x E [-180° ; 180] A and B are two points of intersection of f and g.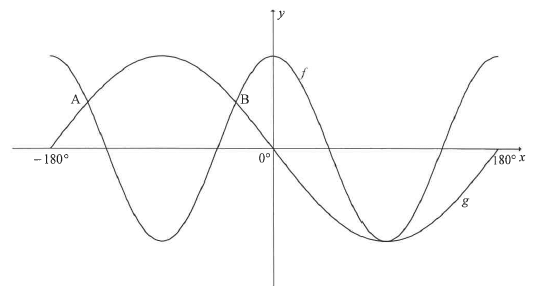
6.1 Without using a calculator, determine the values of x for which cos 2x = - sin x in the interval x ∈ [-180° ; 180] (6)
6.2 Use the graphs above to answer the following questions:
6.2.1 How many degrees apart are points A and B from each other?
6.2.2 For which values of x in the given interval will f/(x).g/ (x) > 0?
6.2.3 Determine the values of k for which cos 2x +3 = k will have no solution.
QUESTION 7
Points B, C and E lie in the same horizontal plane. ABCD is a rectangular piece of board. CDE is a triangular piece of board having a right angle at C. Each piece of board is placed perpendicular to the horizontal plane and joined along DC, as shown in the diagram. The angle of elevation from E to D is x. BEC = 2x and EBC = 30°.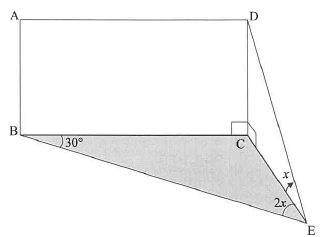
7.1 Show that DC = BC
4 cos2 x
7.2 If x = 30°, show that the area of ABCD = 3AB2.
QUESTION 8
8.1 In the diagram, MP is a diameter of a circle centered at O. MP cuts the chord NR at T. Radius NO and chords PR, MN and MR are drawn. R1 = 69°.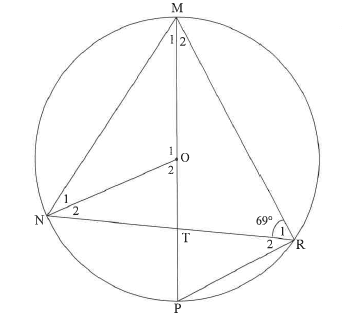
Determine, giving reasons, the size of:
8.1.1 R2
8.1.2 O1
8.1.3 M1
8.1.4 M2, if it is further given that NO II PR
8.2 In the diagram below, ABCD is a cyclic quadrilateral. AB and DC are produced to meet at E. AD and BC are produced to meet at F. AFB = 2x , DAB = 3x and AED = x.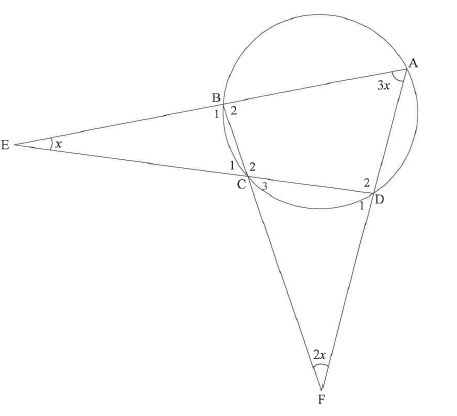
Determine, giving reasons, the value of x. (6)
[16]
QUESTION 9
9.1 In the diagram, ABC is a triangle. D and E are points on sides AB and AC respectively such that DE 11 BC .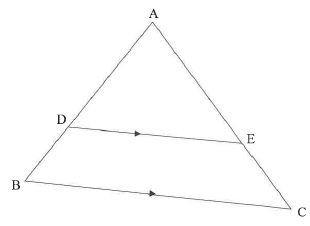
Use the diagram above to prove the theorem which states that a line drawn parallel to one side of a triangle divides the other two sides proportionally, i.e. prove that AD = AE
DB EC (6)
9.2 In the diagram, M is the centre of the circle. A, B and C are points on the circle such that AC = BC. PA is a tangent to the circle at A. PQ is drawn parallel to CA to meet BA produced at Q. BC produced meets PQ at R and AR is drawn.
Let Q = x .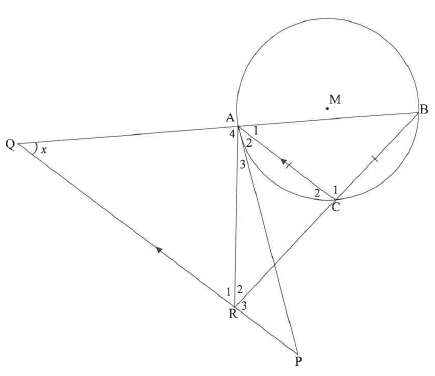
9.2.1 Determine, giving reasons, FOUR other angles EACH equal to x.
9.2.2 Prove that ABPR is a cyclic quadrilateral.
9.2.3 Prove that BA = BC
BQ QR
[17]
QUESTION 10
In the diagram, TSR is a diameter of the larger circle having centre S. Chord TQ of the larger circle cuts the smaller circle at M. PQ is a common tangent to the two circles at Q. SQ is drawn.
RP ⊥ PQ and MS II QR.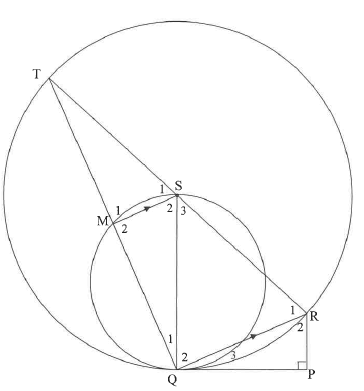
10.1 Prove, giving reasons that:
10.1.1 SQ is the diameter of the smaller circle (3)
10.1.2 RT = RQ2 (6)
RP
10.2 If MS = 14 units and PQ = V640 units, calculate, giving reasons, the length of the radius of the larger circle. (6)
[15]
TOTAL:150
INFORMATION SHEET