Mathematical Literacy P1 Grade 12 Questions - NSC Exams Past Papers and Memos September 2019 Preparatory Examinations
Share via Whatsapp Join our WhatsApp Group Join our Telegram GroupINSTRUCTIONS AND INFORMATION
- This question paper consists of FIVE questions. Answer ALL the questions.
- 2.1 Use the addendum with
ANNEXURE A for QUESTION 1.3
ANNEXURE B for QUESTION 2.4
ANNEXURE C for QUESTION 4
2.2 Write your NAME and GRADE in the spaces provided on the ANSWER SHEET FOR QUESTION 2.3.2
Hand in the ANSWER SHEET with your ANSWER BOOK. - Number the answers correctly according to the numbering system used in this question paper.
- Maps and diagrams are NOT necessarily drawn to scale, unless stated otherwise.
- Round off ALL final answers according to the context used, unless stated otherwise.
- Indicate units of measurement, where applicable.
- Start EACH question on a NEW page.
- Show ALL calculations clearly.
- You may use an approved calculator (non-programmable and non-graphical), unless stated otherwise.
- Write neatly and legibly.
QUESTIONS
QUESTION 1
1.1
| Jane’s bank balance at the end of January 2019 was -R2 530. The employer deposited her net salary on 01/2/2019 into her bank account and the new balance was R8 750. |
1.1.1 Calculate the net salary amount that was deposited into Jane’s bank account. (2)
1.1.2 Calculate Jane’s gross salary if her gross salary is 175% of the new balance. (2)
1.2
| On the 9th of February 2019 at 14:35, Jane withdrew R500 for shopping. Her bank charges R2 + 0, 75% of the amount withdrawn above R500. She arrived at home at 16:21 after shopping. |
1.2.1 Calculate the bank charges for withdrawing the R500. (2)
1.2.2
Jane bought a dress that was advertised as shown in the picture below. DRESS FOR SALE!!!
|
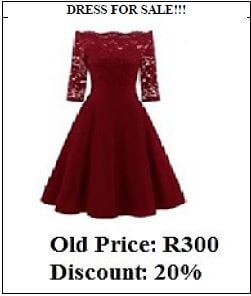
1.2.2 Calculate the price Jane paid for the dress after the discount. (2)
1.2.3 Determine the elapsed time from the time she withdrew the money to the time she arrived home. (2)
1.3
| ANNEXURE A shows a picture of an 800 g loaf of brown bread, its ingredients and nutritional values. |
Use ANNEXURE A to answer the questions that follow.
1.3.1 Determine the number of slices in the 800 g bread if they were sliced equally. (2)
1.3.2 Determine the mass of the sugar in a loaf of brown bread. (2)
1.3.3 Calculate the number of joules (J) in 1 003,90 (kJ). (2)
1.3.4 Calculate the cost of two slices of bread in a sandwich if the loaf is priced at R14,99. (2)
1.4
| A scale of 1 : 500 000 was used on a map of South Africa. |
Use the above information to answer the questions that follow.
1.4.1 Name the type of scale used on the map. (2)
1.4.2 Determine the actual distance on the ground in kilometre (km) represented by the 500 000 cm. (2)
1.5
TABLE 1 below shows the percentage pass (% Pass) of learners in Eastern Cape Districts in 2018 NSC Results (Grade 12) in Mathematical Literacy. TABLE 1: PERCENTAGE PASS OF LEARNERS IN EASTERN CAPE DISTRICTS IN 2018 NSC RESULTS (GR 12) IN MATHEMATICAL LITERACY
|
[Source: ecdoe.co.za]
1.5.1 Name the district with the highest percentage pass. (2)
1.5.2 Arrange the pass percentage of the districts in ascending order. (2)
1.5.3 Name the districts that obtained a better percentage pass than Chris Hani West. (2)
1.5.4 Calculate the percentage of learners that failed in OR Tambo Inland. (2)
1.5.5 For the 2018 Eastern Cape results, write down the probability of a randomly selected learner who passed Mathematical Literacy. (2) [32]
QUESTION 2
2.1
First National Bank charges per e-Wallet transaction within South Africa or to the neighbouring countries. TABLE 2 shows the fees charged on e-Wallet transactions and TABLE 3 shows Nomonde’s e-Wallet transactions. TABLE 2: TRANSACTION FEE CHARGE AMOUNTS PER COUNTRY
[Source: First National Bank (FNB)] TABLE 3: NOMONDE’S E-WALLET TRANSACTIONS FROM DECEMBER 2018 to FEBRUARY 2019
|
Use TABLE 2 and TABLE 3 above to answer the questions that follow.
2.1.1 Calculate the total amount Nomonde sent. (2)
2.1.2 Write down the cellphone number of the person who received the highest amount. (2)
2.1.3 Calculate the total bank charges for the e-Wallet transactions made to Mozambique. (3)
2.2
Masakhane community rents out its hall at a cost of R750 per event hosted. The local municipality provides the community a fixed monthly income of R500 to assist in maintaining its hall facilities. TABLE 4: TOTAL MONTHLY INCOME FOR THE HALL
The community uses the formula below to calculate total monthly income. Total monthly income = R500 + (R750 × number of events hosted in a month) |
Use the above income formula to calculate the missing values.
2.2.1 B (2)
2.2.2 C (3)
2.3
The monthly fixed expenses to maintain the hall facilities is R3 000 and an additional expense of R250 per event hosted. TABLE 5 shows the total monthly expenses. TABLE 5: TOTAL MONTHLY EXPENSES FOR THE HALL
|
2.3.1 Use the following formula to calculate the value of D, the number of events.
Total monthly expenses
= R3 000 + (R250 × number of events hosted in a month) (3)
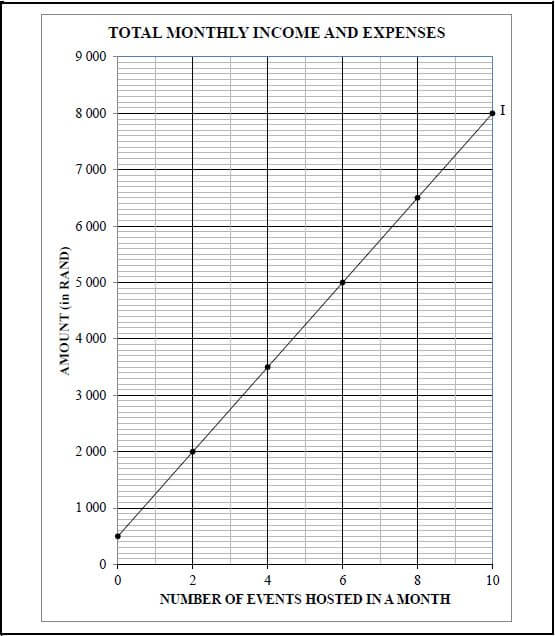
2.3.2 On the ANSWER SHEET a straight-line graph of monthly income (I) has been drawn. Use TABLE 5 to draw another straight-line graph on the same grid of the monthly expenses (E). (4)
Use the graphs to answer the following questions.
2.3.3 Determine the number of events in a month that Masakhane community must host to break even. (2)
2.3.4 Determine the profit Masakhane community would make if it hosted 8 events. (2)
2.4
| Masakhane community purchased a UHD digital television from a furniture store on hire purchase. The hire purchase agreement is shown on ANNEXURE B. |
Use ANNEXURE B to answer the questions that follow.
2.4.1 Calculate the deposit amount paid by Masakhane on the hire purchase agreement. (2)
2.4.2 Explain the term ‘credit’ in this context. (2)
2.4.3 Calculate the interest amount Masakhane pays every month. (2)
2.4.4 Determine the date (month and year) for the payment of last instalment. (2)
2.4.5 Calculate the Value Added Tax (VAT = 15%) amount on the insurance. (3)
2.5
Masakhane received a donation of £500 (British Pounds) GBP from a non-profit organisation following their request for assistance. TABLE 6: EXCHANGE RATES AND BANK CHARGES
| |||||||||
Use TABLE 6 above to answer the questions that follow.
2.5.1 Identify the exchange rate the bank will use to exchange Masakhane’s £500. (2)
2.5.2 Calculate the Rand amount Masakhane will receive from £500. (5) [41]
QUESTION 3
3.1
3.1 Onke wants to buy a cricket kit. TABLE 7 shows information that guides a player on sizes to buy. The sizes are indicated in feet (') and inches (′′) TABLE 7: INFORMATION GUIDE ON SIZES
|
3.1.1 Write down the cricket bat length (in decimal inches) for a batsman whose height is 4' 10''. (2)
3.1.2 Convert a size 2 bat width to centimetres (cm). You may use: 1'' = 2,54 cm (3)
3.1.3 Identify the maximum height of a player who bought a cricket bat size 6. (2)
3.1.4 Calculate the Body Mass Index (BMI) of a cricket player who has a height of 1,65 m with a weight of 62 kg.
You may use the following formula: weight in kilograms (2)
(height in metres)2
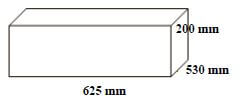
3.2 Nontando kept water bottles in a rectangular box with ice cubes in order to sell them to the cricket spectators. Study the container below and answer the questions that follow.
| RECTANGULAR BOX | DIAGRAM OF A RECTANGULAR BOX |
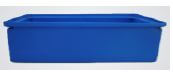 |  |
[Source:pioneerplastics.co.za]
3.2.1 Write down the width of the box in centimetres. (2)
3.2.2 Calculate the volume (in cm3) of ONE rectangular box. You may use the formula: Volume = Length × Width× Height (3)
3.2.3 Determine how many litres of water the box can hold. 1 000 cm3 = 1 litre (2)
3.3
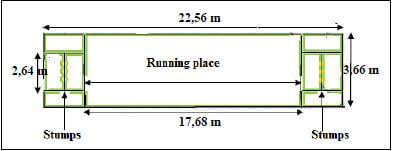
A diagram of the cricket pitch is shown below. Study the diagram and answer the questions that follow. CRICKET PITCH
|
[Source: wikimapia.org]
3.3.1 Explain the term ‘perimeter’. (2)
3.3.2 Calculate the perimeter of the area where the players run during cricket overs. You may use the formula: Perimeter = 2 (length + width) (2)
3.3.3 Calculate the area (m2) of the cricket pitch. You may use the formula: Area = Length × Width (3) [23]
QUESTION 4
| ANNEXURE C shows the map of a part of the Great Wall of China and distances between places. Sections are numbered from 1 to 8. Use ANNEXURE C to answer the questions that follow. |
4.1 Identify the reservoir(s) located west of Section 5. (2)
4.2 Give the general direction of Yangqing from Mentougou. (2)
4.3 A person wants to travel from Changping to section 4.
- Calculate the distance using the mountain road. (2)
- Calculate the difference in distance from Changping to section 4 using the mountain road and using the highway through Beijing. (3)
4.4 Andile travelled from Mentougou to Beijing, proceeded to Shunyi and turned right. The next town was his destination. Name this town. (2)
4.5 Determine how long it took Andile (in minutes) to drive from Beijing to Shunyi, a distance of 30 km at an average speed of 50 km/h.
You may use the formula: Time = Distance (3)
Speed
4.6 Mr Wong drove from Beijing to Changping, then to Mentougou and back to Beijing covering a total distance of 121,7 km. Calculate the distance from Beijing to Mentougou. (2) [16]
QUESTION 5
5.1
TABLE 8 shows the number of passenger vehicles sales for each province up to November 2017. TABLE 8: PASSENGER VEHICLES SALES FOR EACH PROVINCE UP TO NOVEMBER 2017
[Source: Lightstone.created with datawrapper] | ||||||||||||||||||||||||||||||||||||||||||||||||
5.1.1 Calculate the total number of passenger vehicles sold in the North West Province during October 2017 and November 2017. (2)
5.1.2 Name the province that sold the second most passenger cars up to November 2017. (2)
5.1.3 Determine the number of cars sold nationally from January to September 2017. (3)
5.1.4 For the national total sales up to November 2017, determine the probability (as a percentage) that a vehicle selected randomly was sold in the Western
Cape. (4)
5.1.5 Determine the value of Y, the number of cars sold in November 2017 in the Eastern Cape. (3)
5.1.6 Explain the meaning of the term ‘range’. (2)
5.1.7 Determine the range for provincial passenger vehicles sales in October. (3)
5.1.8 Calculate the mean of the passenger vehicles sold nationally up to November 2017. (3)
5.1.9 Calculate the Interquartile Range (IQR) for the total passenger vehicle sales up to November 2017 for the provinces using the box and whisker scale
given below. 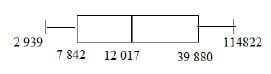 (3)
(3)
5.2
TABLE 9 shows the population and net migrants of India for the period 2013-2019. TABLE 9: POPULATION AND NET MIGRANTS OF INDIA FOR THE PERIOD 2013-2019
[Adapted from worldometers.info] |
Use TABLE 9 to answer the questions that follow.
5.2.1 In which year did India have the least number of people leaving the country as compared to the number of people coming to the country? (2)
5.2.2 Express the 2015 population value in number format. (2)
5.2.3 Determine the mode for the net migrants. (2)
5.2.4 Write down the year in which the urban population grew the most. (2)
5.2.5 Determine the probability (as a common fraction), of randomly selecting a year from 2013 to 2019 with an urban population of less than 4, 2 million. (2)
5.2.6 Calculate the difference between the 2013 population and 2013 urban population. (3) [38]
TOTAL: 150
ANSWER SHEET FOR QUESTION 2.3.2
NAME OF CANDIDATE: ………………………………………….. GRADE 12: …..
MASAKHANE COMMUNITY HALL: GRAPH FOR INCOME (I)/EXPENSES (E) IN RANDS