GEOGRAPHY PAPER 2 GRADE 12 MEMORANDUM - NSC PAST PAPERS AND MEMOS NOVEMBER 2019
Share via Whatsapp Join our WhatsApp Group Join our Telegram GroupGEOGRAPHY PAPER 2
GRADE 12
NOVEMBER 2019
MEMORANDUM
NATIONAL SENIOR CERTIFICATE
RESOURCE MATERIAL
- An extract from topographic map 2731BC PONGOLA.
- Orthophoto map 2731 BC 13 PONGOLA.
- NOTE: The resource material must be collected by schools for their own use.
INSTRUCTIONS AND INFORMATION
- Write your EXAMINATION NUMBER and CENTRE NUMBER in the spaces on the cover page.
- Answer ALL the questions in the spaces provided in this question paper.
- You are provided with a 1 : 50 000 topographic map (2731BC PONGOLA) and an orthophoto map (2731 BC 13 PONGOLA) of a part of the mapped area.
- You must hand the topographic map and the orthophoto map to the invigilator at the end of this examination session.
- You may use the blank page at the end of this question paper for all rough work and calculations. Do NOT detach this page from the question paper.
- Show ALL calculations and formulae, where applicable. Marks will be allocated for these.
- Indicate the unit of measurement in the final answer of calculations, e.g. 10 km, 2,1 cm.
- You may use a non-programmable calculator.
- You may use a magnifying glass.
- The area demarcated in BLACK AND RED on the topographic map represents the area covered by the orthophoto map.
- The following English terms and their Afrikaans translations are shown on the topographic map:
ENGLISH - AFRIKAANS
Aerodrome- Vliegveld
Diggings - Uitgrawings
Canal - Kanaal
Golf Course - Gholfbaan
Hospital - Hospitaal
River - Rivier
Sewerage Works - Rioolwerke
Sugar Mill - Suikermeule
Waterfall - Waterval
GENERAL INFORMATION ON PONGOLA
Pongola (also known in isiZulu as uPhongolo) is a small town located in northern KwaZulu-Natal, only 10 km from the Swaziland border. Pongola is surrounded by 50 km² of sugar cane and subtropical fruit plantations. The town thrived as a result of the irrigation (canal) system and a sugar mill. Pongola is situated in a tranquil subtropical environment and normally receives about 519 mm of rain per year, with most rainfall in summer.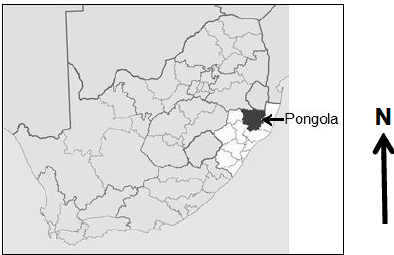
QUESTION 1: MULTIPLE-CHOICE QUESTIONS
The questions below are based on the 1 : 50 000 topographic map (2731BC PONGOLA), as well as the orthophoto map of a part of the mapped area. Various options are provided as possible answers to the following questions. Choose the answer and write only the letter (A–D) in the block next to each question.
1.1 Pongola is situated in …
- the Eastern Cape.
- the Western Cape.
- Gauteng.
- KwaZulu-Natal.✓
1.2 The international boundary north on the topographic map separates South Africa (Pongola) from …
- Lesotho.
- Swaziland.✓
- Zimbabwe.
- Namibia.
1.3 The contour interval of the orthophoto map is … metres.
- 2
- 5✓
- 10
- 20
1.4 The index sheet south-east on the orthophoto map 2731 BC 13 Pongola is …
- 2731 BC 17.
- 2731 CB 17.
- 2731 DB 16.
- 2731 BC 19.✓
1.5 The feature at 27°23'21"S 31°35'55"E on the topographic map is a/an …
- farmstead.
- excavation.✓
- reservoir.
- dam.
1.6 The Mzinyane River at K flowing in blocks F3 and F4 on the topographic map flows in a … direction.
- north-easterly✓
- south-westerly
- south-easterly
- north-westerly
1.7 The difference in height between trigonometrical station 89 in block C7 and trigonometrical station 83 in block B9 on the topographic map is … metres.
- 6
- 24,4
- 24,5✓
- 4
1.8 The land-use at 1 on the orthophoto map is ...
- industries.
- cultivation.✓
- recreation.
- forestry.
1.9 The fluvial landform at L in block B4 on the topographic map is a … base level of erosion.
- temporary✓
- permanent
- ultimate
- lowest
1.10 The human-made feature that has influenced the shape of the settlement from M in block E3 to N in block D1 on the topographic map is a …
- route.✓
- mountain.
- railway.
- river.
1.11 Pongola can be classified as a … settlement according to its dominant urban function.
- gap
- specialised
- central place✓
- gateway
1.12 The dominant street plan (pattern) of the Ncotshane residential area at O on the topographic map is …
- irregular.
- radial.
- linear.
- grid.✓
1.13 The underlying rock structure of the drainage pattern encircled by P on the topographic map is/are …
- alternate layers of hard rock and soft rock.
- uniform in resistance to erosion.✓
- igneous rocks with joints.
- folded mountains.
1.14 Which diagram below would represent the shape of the rough cross-profile of the meander from 2 to 3 on the orthophoto map?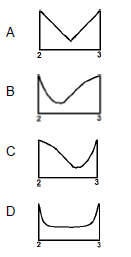
C✓
1.15 The landform at 4 on the orthophoto map is a …
- butte.
- conical hill.
- mesa.
- plateau.
(15 x 1)
[15]
QUESTION 2: MAP CALCULATIONS AND TECHNIQUES
2.1 Refer to the orthophoto map.
2.1.1 Calculate, in m², the average area of the Pongola aerodrome demarcated by 9 on the orthophoto map. Show ALL calculations. Marks will be awarded for calculations. Clearly indicate the unit of measurement in your final answer.
Formula: Area = length (L) × breadth (B)
(10,8✓cm x 100) x (0,7✓cm x 100)
1080✓m x 70✓ m
75 600 m² ✓
Range [(10,6 – 10,9) x (0,5 – 0,8)]
Range =
[Length= (1060 m – 1090m) x
Breadth= (50 m – 80 m)]
Range [53 000 – 87 200] m²
(5 x 1) (5)
2.1.2 Why does the size of the Pongola aerodrome appear different on the topographic map in comparison to the orthophoto map?
The scale (1 : 50 000) on the topographic map is smaller than the scale
(1 : 10 000) on the orthophoto map✓
The scale (1 : 10 000) on the orthophoto map is larger than the scale
(1 : 50 000) on the topographic map✓
Orthophoto map scale is 5 times larger than the topographic map ✓
The aerodrome is 5 times larger on the orthophoto map✓
The topographic map scale is 5 times smaller than the scale of the orthophoto map ✓
The orthophoto map and the topographic map have different scales✓
The aerodrome is 5 times smaller on the topographic map✓
[ANY ONE] (1 x 1) (1)
2.2 Refer to the information on the topographic map.
2.2.1 Calculate the magnetic declination for 2019 using the information on the topographic map. Show ALL calculations. Marks will be awarded for calculations. Clearly indicate the direction in relation to true north in your final answer.
Difference in years:17✓
Mean Annual change: 12'W
Total change: 17 x 12'
= 204' (3°24')✓
Magnetic declination for 2019: 20°06' + ✓ 3°24' (204')
= 23°30'W✓ of true north (5 x 1) (5)
2.2.2 Determine the magnetic bearing for 2019 from trigonometrical station 89 in block C7 to trigonometrical station 83 in block B9.
Formula: Magnetic bearing = True bearing + Magnetic declination
MB = 56°✓ + 23°30' W (range: 55° to 57°)
= 79°30'✓ (78°30' to 80°30') (2 x 1) (2)
2.3 Below is a cross-section drawn from 7 to 8 on the orthophoto map.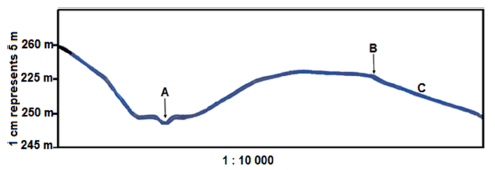
2.3.1 Use the orthophoto map to identify feature A and feature B on the cross-section.
A: river/perennial river/river valley/river bank/(braided) stream✓
B: reservoir(wall)/perennial water (accept dam)/road✓ (2 x 1) (2)
2.3.2 Refer to intervisibility.
- Is there intervisibility between A and B?
No✓ (1 x 1) (1) - Give TWO reasons for your answer.
The convex slope will prevent intervisibility✓
There is an obstruction /higher lying area between A and B✓
A is at the bottom of the valley and B is on a slope facing away from
A (to the E/NE)✓
(ANY TWO) (2 x 1) (2)
2.3.3 The horizontal scale of the cross-section is 1 : 10 000.
- Convert the vertical scale of the cross-section into a ratio scale.
1 : 500 ✓ (1 x 1) (1) - Which gradient 1:23 or 1:66 is likely to match slope C?
1:66✓
(Accept 1:23) (1 x 1) (1)
[20]
QUESTION 3: APPLICATION AND INTERPRETATION
3.1 Refer to the Phongola river on the topographic map.
3.1.1 What type of river is the Phongola river?
Perennial✓ (Accept Permanent) (1 x 1) (1)
3.1.2 Will an oxbow lake be more likely to form first at meander loop R or meander loop S? Give a reason for your answer.
Link
R or S:
S✓ (1 x 1) (1)
Reason:
S has a softer/less resistant rock than R✓✓
Neck at S more easily eroded than at R ✓✓
There is more resistant rock at meander loop R which will take longer to erode✓✓
Neck of meander loop at R is wider than meander loop S✓✓
Land at meander loop R is more elevated (hilly), while the land at meander loop S is more gentle✓✓
[ANY ONE] (1 x 2) (2)
3.2 Refer to the settlement at 10 on the orthophoto map.
3.2.1 Name the settlement pattern at 10.
Dispersed/Isolated ✓✓ (1 x 1) (1)
3.2.2 State ONE physical (natural) factor that would have determined the type of settlement pattern identified in QUESTION 3.2.1.
Flat land/gentle slope✓
Fertile soil/arable land✓
Rainfall✓
Access to water supply (river)✓
(ANY ONE) (1 x 1) (1)
3.2.3 State TWO economic advantages of the type of settlement pattern identified in QUESTION 3.2.1.
Farmer can show initiative/ new farming technology/innovative ✓
Farmer owns the land ✓
Land is not fragmented✓
Farmer is able to mechanise extensively✓
Farmer does not have to share his profits✓
High productivity/ yield✓
Less maintenance costs✓
Less labour costs ✓
Farmer determines own selling price✓
Farmers makes own decisions✓
(ANY TWO) (2 x 1) (2)
3.3 Refer to the aerodrome in block D7 on the topographic map and 9 on the orthophoto map.
3.3.1 In which land-use zone is the aerodrome situated?
Rural-urban fringe✓ (1 x 1) (1)
3.3.2 Why is this land-use zone a suitable location for the aerodrome?
Flat land✓✓
Cheaper land✓✓
Availability of (large) piece of land/open space✓✓
Accessibility (by road from the town)✓✓
Avoid accidents/safety reasons ✓✓
Due to air and noise pollution✓✓
Away from built-up area✓✓
Light aircrafts could be used to spray insecticides and pesticides over the nearby cultivated lands✓✓
Complies with legislation✓✓
(ANY TWO) (2 x 2) (4)
3.4 Refer to the agricultural activities in the mapped area.
3.4.1 Is sugar cane farming, as shown on the map, an example of large- or small-scale farming?
Large scale farming✓ (1 x 1) (1)
3.4.2 Discuss how the irrigation network in the eastern part of the mapped area supports the growing of sugar cane.
The irrigation network will increase sugar cane production and therefore increases profits✓✓
The irrigation network is an easy/cheaper way to transport water over considerable distances✓✓
The area only receives 519mm rainfall, therefore, irrigation network is essential to ensure all year productivity✓✓
The irrigation network allows many farmers to access water so that the crops could be grown away from the river✓✓
The irrigation network can control water flow and reduce flooding where sugar cane is grown✓✓
Sugar cane as a crop requires an abundant supply of water which the irrigation network (rivers/dams/reservoirs/furrows/siphon and canals) provide✓✓
The presence of an irrigation network attracts investors to expand the sugar cane farming industry✓✓
(ANY TWO) (2 x 2) (4)
3.4.3 Refer to the Pongola sugar mill in block F10 on the topographic map.
- Is the sugar mill a raw material or market-orientated industry?
Raw material orientated✓ (1 x 1) (1) - Give a reason for your answer to QUESTION 3.4.3(a).
Sugar cane is bulky to transport and that increases the cost✓✓
Sugar mills to process the sugar cane are close to the 'plantation'/raw material✓✓
Sugar cane requires quick processing as it can dry out✓✓
The raw material is perishable✓✓
A processed product is cheaper to transport✓✓
(ANY ONE) (1 x 2) (2)
3.5 Refer to the settlement, Phakamisa (enlarged below), situated in the valley in block J4 on the topographic map.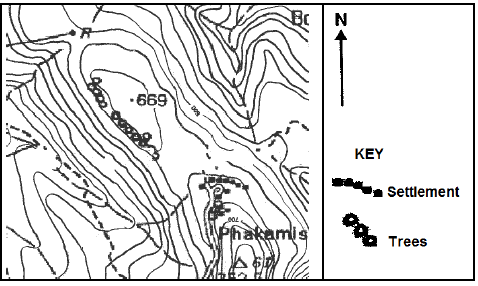
3.5.1 In which direction does the settlement of Phakamisa face?
North✓ (1 x 1) (1)
3.5.2 Explain the climatological advantage of the location of the settlement of Phakamisa?
The warmest part of the slope as it receives direct radiation (aspect) from the sun✓✓
Phakamisa settlement is located in the thermal belt / mid slope/ higher slope therefore it is warmer at night✓✓
Limited effect of katabatic flow due to location✓✓
The settlement is not affected by frost or cold nights because it is located on the mid-slope✓✓
Phakamisa settlement is protected from cross winds at the top of the mountain✓✓
(ANY ONE) (1 x 2) (2)
3.5.3 Explain why the impact of katabatic winds will be minimal (low) on the settlement of Phakamisa.
Due to its location on the mid-slope/ thermal belt/ above the valley floor✓✓
The cold air drains past Phakamisa into the valley below/bottom of the slope✓✓
Phakamisa is not affected by frost that forms from katabatic winds as it is not on the valley floor✓✓
(ANY ONE) (1 x 2) (2)
[25]
QUESTION 4: GEOGRAPHICAL INFORMATION SYSTEMS (GIS)
4.1 Refer to the topographic map.
4.1.1 Is the topographic map an example of raster or vector data?
Vector✓ (1 x 1) (1)
4.1.2 What is the difference between raster data and vector data?
Raster data is represented by pixels/ cells/blocks/grids/ images/columns whereas Vector is data represented as points/lines/polygons ✓✓
[CONCEPT] (1 x 2) (2)
4.2 Image A and image B were captured by a remote sensing device.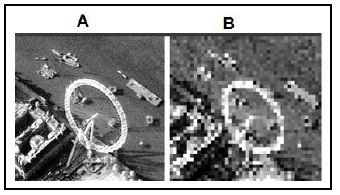
4.2.1 What is remote sensing?
Obtaining information about the earth from a distance/ without touching or without physical contact✓
[CONCEPT] (1 x 1) (1)
4.2.2 Name ONE factor in the remote sensing process that will affect the resolution of an image.
Weather conditions (accept examples)✓
Focussing✓
Number/size of pixels✓
Shadows✓
Equipment (accept examples)✓
Air pollution✓
Distance✓
Angle at which image is captured✓
Scale✓
(ANY ONE) (1 x 1)(1)
4.2.3 Why does image A have a higher resolution than image B?
More/smaller pixels/grid cells in image A✓✓
Less/larger pixels/grid cells in image B✓✓
[ANY ONE] (1 x 2) (2)
4.3 Refer to buffering in block H8 on the topographic map.
4.3.1 What is buffering?
The demarcation of an area around/along a spatial feature✓
[CONCEPT] (1 x 1) (1)
4.3.2 Why would the lack of buffering be considered poor river management in block H8?
Fertiliser or pesticides (pollution) from farming could enter the river✓✓
Could disrupt aquatic ecosystems✓✓
River could lose water due to excessive irrigation✓✓
Biodiversity could be threatened in the river✓✓
Flooding may result✓✓
Soil erosion could silt up rivers✓✓
Possible human influence from nearby settlements (litter)✓✓
Road construction could have polluted the water✓✓
The effect of buildings/development too close to the river✓✓
River is not protected✓✓
[ANY ONE] (1 x 2) (2)
4.4 Refer to data integration in block H10 on the topographic map.
4.4.1 What is data integration?
Taking data from different sources and combining it✓
(CONCEPT) (1 x 1) (1)
4.4.2 A farmer in block H10 wants to extend the size of his farm to block I10. Discuss TWO physical (natural) layers that the farmer would have to integrate in order to make a decision.
Drainage /hydrology to ensure a sufficient water supply✓✓
Topography/relief to assess the gradient of the slope✓✓
Geological/Soil to determine type of soil/level of fertility✓✓
Natural vegetation to determine the availability of grazing✓✓
(ANY TWO) (2 x 2) (4)
[15]
TOTAL: 75