MATHEMATICAL LITERACY PAPER 1 GRADE 12 QUESTIONS - NSC EXAMS PAST PAPERS AND MEMOS JUNE 2019
Share via Whatsapp Join our WhatsApp Group Join our Telegram GroupMATHEMATICAL LITERACY
PAPER 1
GRADE 12
NSC EXAMS
PAST PAPERS AND MEMOS JUNE 2019
INSTRUCTIONS AND INFORMATION
Read the following instructions before answering the question;
- This question paper consists of FIVE questions. Answer ALL the questions.
- Use the ANNEXURES in the ADDENDUM to answer the following questions:
- ANNEXURE A for QUESTION 1.3
- ANNEXURE B for QUESTION 2.2
- ANNEXURE C for QUESTION 4
- Number the answers correctly according to the numbering system used in this question paper.
- Maps and diagrams are not necessarily drawn to scale, unless stated otherwise.
- Round off ALL final answers according to the context used, unless stated otherwise.
- Indicate units of measurement, where applicable.
- Start EACH question on a NEW page.
- Show ALL calculations clearly.
- Write neatly and legibly.
QUESTIONS
QUESTION 1
1.1 A travel agency booked a flight and accommodation for Nomonde’s trip to Pretoria. Study the travel arrangements voucher below and answer the questions that follow.
TRAVEL ARRANGEMENTS VOUCHER
DM Row Travel Agency | Accommodation Client Copy |
Twilight Hotel, | Client details |
Date and Times | Booking References |
1.1.1 Write down the name of the travel agency that issued the voucher. (2)
1.1.2 Write down the client reference number shown on the voucher. (2)
1.1.3 Determine the number of nights Nomonde spent at the hotel. (2)
1.1.4 Calculate the total cost for the duration of Nomonde’s stay at the hotel. (2)
1.2
Fizzy drinks like Coca-Cola are be bottled in different containers with different capacities. Examples of the containers are shown below.
|
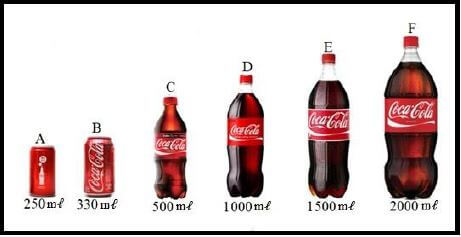
1.2.1 Calculate the total capacity in all the containers if they are full. Give your answer in litres. (2)
1.2.2 Determine the number of A containers, filled to capacity, that would completely fill container E. (2)
1.3
| ANNEXURE A shows the 2018 Cape Town Marathon route profile. Use ANNEXURE A to answer the questions that follow. |
1.3.1 Determine the total distance of the Cape Town marathon route. (2)
1.3.2 Determine the difference in height above sea level between Orange Street and Strand Street. (2)
1.4 The examination results expressed in percentage (%) for a Grade 12 Mathematical Literacy class at Bongo Senior Secondary School at the end of 2018 are shown below:
| 28 18 47 56 86 35 75 47 43 57 61 82 47 61 51 74 61 84 33 43 25 |
1.4.1 Determine the mode percentage of the class. (2)
1.4.2 Calculate the range of the given data. (2)
1.4.3 The examination paper was set out of 150 marks. Calculate the actual marks of the learner that obtained the highest percentage. (2) [22]
QUESTION 2
2.1
| Bazze Secondary School organised a tour for 60 Grade 12 learners costing R20 000. Each learner paid R200 and the school paid 30% of the cost of the tour. T-shirts donated by a charitable organisation were sold to raise the balance of R2 000. |
2.1.1 Calculate the total amount the learners paid. (2)
2.1.2 Determine the school’s contribution towards the cost of the tour. (2)
2.1.3 Show that the ratio of amount raised from the sale of T-shirts to the total cost of the tour is 1 : 10. (2)
2.1.4 Determine the total number of T-shirts donated if 10 of them were sold at R50 each and the rest of the T shirts were sold at R30 each. (3)
2.2
| Ms Lerato lives in ABC Municipality. She needs assistance to understand the calculations involved in her electricity bill. ANNEXURE B contains the electricity bill and TABLE 1 shows the electricity tariffs. |
Use ANNEXURE B to answer the questions that follow.
2.2.1 Determine the value of D, the amount of kilowatt (kWh) used in March 2019. (2)
2.2.2 Show how the cost of R210,35 was calculated. (3)
2.2.3 Determine the Value Added Tax (VAT) amount payable. (2)
2.3
| Lerato is a teacher at Bongo SSS. The distance from her home to school is 50 km. She drives to school daily and her car uses on average 12,5 km per litre of petrol. TABLE 2 below shows the cost per litre of petrol for month of July and August 2018. |
TABLE 2: COST PER LITRE OF PETROL
July 2018: Official price per litre | August 2018 price per litre | |
| Petrol | R16,02 | R16,21 |
Use TABLE 2 above to answer the questions that follow.
2.3.1 Explain the term inflation in the above context. (2)
2.3.2 Determine the difference in the price of petrol for the two months. (2)
2.3.3 Calculate the increase in cost of fuel she paid 5 days after the price increase. (5)
2.4 Ms Lerato’s bank statement for the month of March 2018 is shown in TABLE 3 below.
TABLE 3: MS LERATO’S BANK STATEMENT
GOODWILL BANK 15 March 2018 Lerato | |||||
Details | Service Fee | Debits | Credits | Date | Balance (Rands) |
Balance brought forward | 02 15 | 2 875,77- | |||
Statement fee | # | 20,18- | 02 17 | 2 895,95- | |
Card Purchase | 296,10- | 02 20 | 3 192,05- | ||
Salary | 18 953,85 | 02 21 | 15 761,80 | ||
Insurance premium | 187,27- | 02 25 | 15 574,53 | ||
Dividend YY4098 shares | 840,00 | 02 28 | 16 414,53 | ||
Bond | 4 069,52- | 03 02 | 12 345,01 | ||
Auto Bank deposit | 1 200,00 | 03 05 | 13 545,01 | ||
Fee Cheque Deposit | # | 42,37- | 03 05 | 13 502,64 | |
Fuel CLTX Garage | 729,45- | 03 07 | 12 773,19 | ||
ATM withdraw | 1800,00- | 03 10 | 10 973,19 | ||
Withdrawal fee | # | 17,47- | 03 10 | 10 955,72 | |
Fixed monthly fee | # | 100,88- | 03 11 | 10 854,84 | |
Balance carried forward | 03 15 | 10 854,84 | |||
Use TABLE 3 above to answer the questions that follow.
2.4.1 Write down the closing balance amount on 6th March 2018. (2)
2.4.2 Calculate the total bank fees charged in March 2018. (2) [29]
QUESTION 3
3.1 John, a student at Bongo SSS runs around the school’s playground and keeps a record of his distances and fitness from his fitness tracker watch. The diagram below shows the layout of the playground and TABLE 4 shows data from his fitness tracker watch. 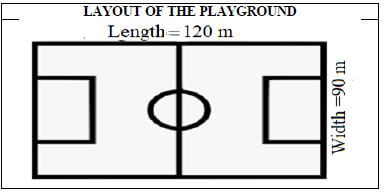
TABLE 4: TARGET SET AT 6 000 STEPS
THE DATA
DATE | STEPS | DISTANCE (KM) | GOAL (%) |
1/1/2019 | 2 444 | 1,6 | 40,73 |
2/1/2019 | 8 710 | 6,3 | 145,17 |
3/1/2019 | 19 210 | 13,02 | 320,17 |
4/1/2019 | 3 245 | 2,10 | 54,08 |
5/1/2019 | 5 859 | 4,2 | ------- |
6/1/2019 | 4896 | 3,36 | 81,60 |
7/1/2019 | 4461 | 2,94 | 74,35 |
8/1/2019 | 3996 | 2,73 | 66,60 |
9/1/2019 | 7561 | 5,04 | 126,02 |
10/1/2019 | 5286 | 3,57 | 88,10 |
Use the layout and TABLE 4 above to answer the questions that follow.
3.1.1 Determine the total distance covered on the days he met the target. (2)
3.1.2 Calculate the perimeter of the playground. (2)
3.1.3 Calculate the number of completed rounds he ran around the playground on the first day of practice. (5)
3.1.4 Calculate the goal percentage on the 5/1/2019.
Use the formula:
- Goal(%) = Steps covered × 100%
Target set
3.1.5 Calculate the distance of one step in metres on the 9/1/2019. Give your answer to 2 decimal places. (4)
3.2 John drinks juice he buys from a local café after running. He wants to determine how much energy he takes in from one can, so he measured the radius and height of the can and read the nutritional information. The picture of the can is shown below. 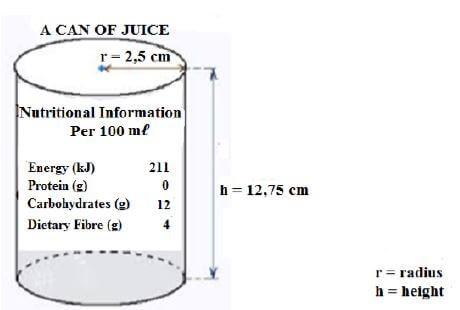
3.2.1 Show that the volume of juice in the can is 250,38 cm3 when full. (2)
Use the following formula:
- Volume = π × radius × radius × height, where π = 3,142
3.2.2 Calculate the energy he takes in when he drinks one can of juice.
NOTE: 1 cm3 = 1 mℓ (3) [20]
QUESTION 4
| ANNEXURE C shows a map of Queenstown and surrounding areas. |
Use ANNEXURE C to answer the questions that follow.
4.1 Name the general direction of Bailey from Kamastone. (2)
4.2 Express the scale in the form 1 : … (3)
4.3 Use the scale in QUESTION 4.2 to determine the distance between Queenstown’s CBD and Whittlesea. (4)
4.4 Name another type of scale that can be used on a map. (2) [11]
QUESTION 5
The data shown in TABLE 5 below gives the number of radio listeners and the population of South African provinces in 2017.
TABLE 5: RADIO LISTENERS AND SOUTH AFRICAN POPULATION IN 2017
Province | Population of the province | Number of radio listeners | % of the listeners to the population |
Eastern Cape | 6 562 053 | 6 233 950 | 95 |
Free State | 2 745 590 | 2 388 663 | 87 |
Gauteng | 12 272 263 | 11 162 759 | 91 |
Kwazulu-Natal | 10 267 300 | 9 856 608 | 96 |
Limpopo | 5 404 868 | 4 918 430 | 91 |
Mpumalanga | 4 039 939 | 3 555 146 | 88 |
Northern Cape | 1 145 861 | 916 689 | 80 |
North West | 3 509 953 | --------- | 90 |
Western Cape | 5 822 734 | 5 240 461 | 90 |
TOTAL |
Use TABLE 5 to answer the questions that follow.
5.1 Name the province with the highest number of radio listeners. (2)
5.2 Arrange the population of the provinces in ascending order. (2)
5.3 Determine the province in the median position as per population. (2)
5.4 Identify the province(s) whose population data would be used to determine the following:
5.4.1 Quartile 1 (2)
5.4.2 Quartile 3 (2)
5.5 Give the percentage of the data represented by the Interquartile Range (IQR). (2)
5.6 Calculate the number of radio listeners in the North West Province. (3)
5.7 Determine the mean percentage of radio listeners. (3) [18]
TOTAL: 100