GEOGRAPHY PAPER 1 GRADE 12 ANNEXURE - NSC EXAMS PAST PAPERS AND MEMOS JUNE 2019
Share via Whatsapp Join our WhatsApp Group Join our Telegram GroupGEOGRAPHY
PAPER 1
GRADE 12
NSC EXAMS
PAST PAPERS AND MEMOS JUNE 2019
ANNEXURE
FIGURE 1.2: TYPES OF RIVERS 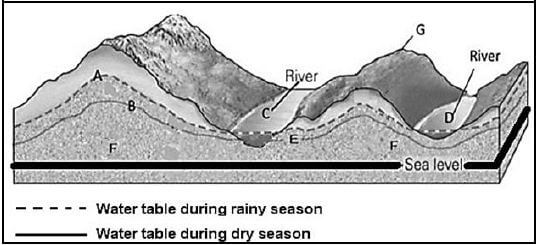
[Adapted from http://geologylearn.blogspot.co.za/2015/12/groundwater-flow.html]
FIGURE 1.3: SYNOPTIC WEATHER MAP DEPICTING A MID-LATITUDE CYCLONE 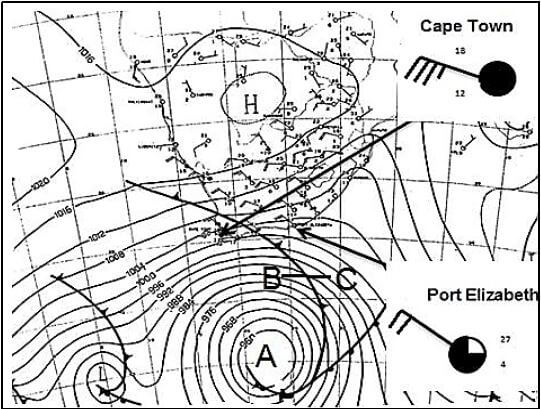
[Adapted from www.google.co.za/search=consecutive+sinoptic+maps+south]
FIGURE 1.4: SATELLITE IMAGE OF A TRAVELLING DISTURBANCE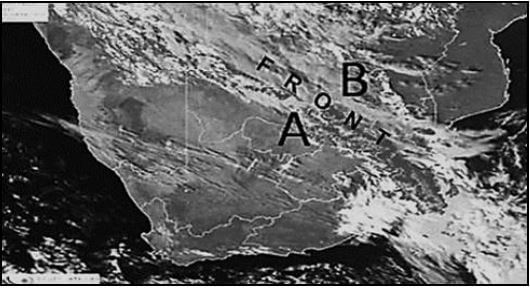
[Adapted from This email address is being protected from spambots. You need JavaScript enabled to view it.]
FIGURE 1.5: DRAINAGE PATTERNS AND DENSITY 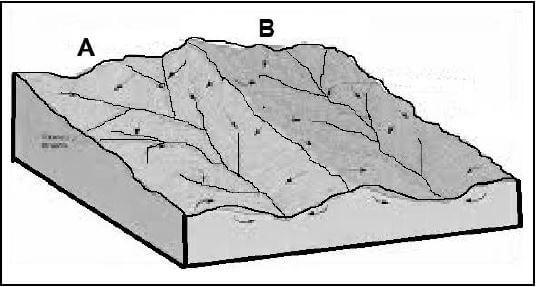
[Adapted from http//: www.Google images]
FIGURE 1.6: CASE STUDY – PRIORITY ISSUES FOR CATCHMENT MANAGEMENT
Sixty-five per cent of South Africa receives less than 500 mm average annual rainfall, meaning that drought is an ever-present risk. Future projections indicate that by 2025 the country’s water requirements will outstrip supply unless urgent steps are taken to manage the resource more sustainably. There are already major problems of supply and quality, with an estimated 8 million South Africans currently having no access to potable water. It is against this background that the South African government, working in partnership with WWF and others, has initiated catchment management programs. This includes the control of water-thirsty alien plant infestations and wetland restoration, across the country, under the banners ‘Working for Water’ and ‘Working for Wetlands’. [Adapted from Working for wetlands: mrwworkingforwetlandscs.pdf Accessed on 10 November 2018] |
FIGURE 2.1: DEVELOPMENT OF A BERG WIND 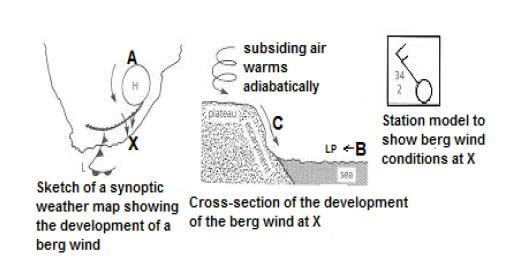
[Source: https://www.google.com/search?hl=development+of+berg+winds&oq=development+of+berg+winds&gs]
FIGURE 2.2: STAGES OF A RIVER 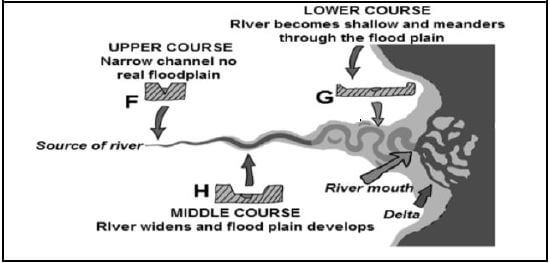
[Adapted from Profantasy'sMap-makingal©2010Profantasy’sSoftwareLtdDesignby Wellesley.]
FIGURE 2.3: URBAN TEMPERATURES 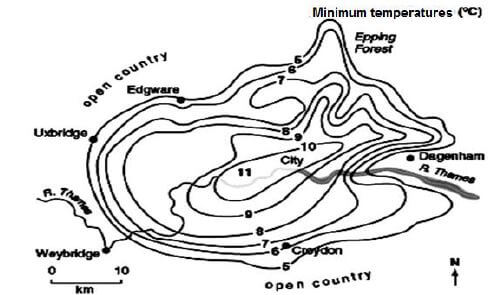
[Source: www.google.com/search?q=precipitation+urban]
FIGURE 2.4: INVERSION LAYER IN A VALLEY 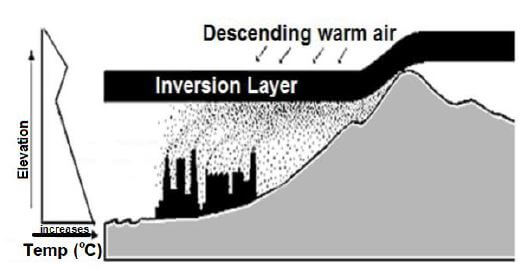
[Adapted from http//www.isuestate.ed/aber/mud/es/hith210/sonelight.htm]
FIGURE 2.5: RIVER CAPTURE 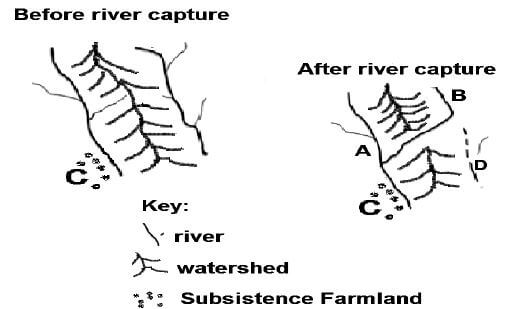
[Source: Examiners sketch – Not drawn to scale]
FIGURE 2.6: RIVER TERRACES 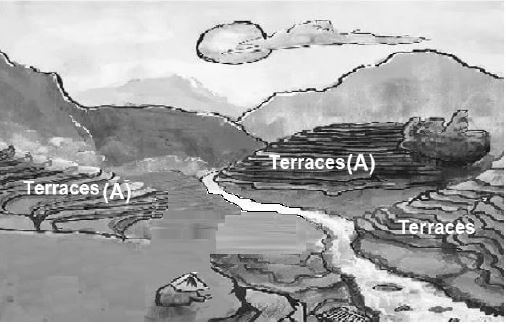
[Adapted by examiner from SA Geography-my school stuff]
FIGURE 3.2: URBANISATION AND URBAN GROWTH IN AFRICA 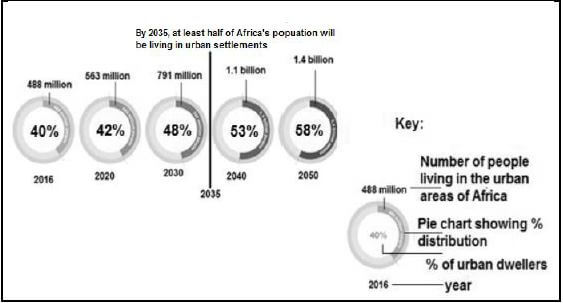
[Adapted by examiner from STATSSA]
FIGURE 3.3: A SETTLEMENT IN KWAZULU-NATAL 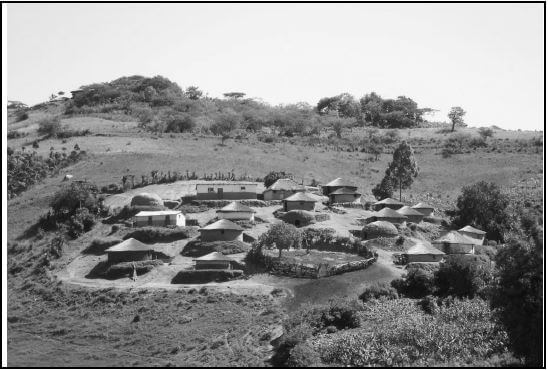
[Source: jpg. Traditional settlement in KZN]
FIGURE 3.4: MOVEMENT OF PEOPLE 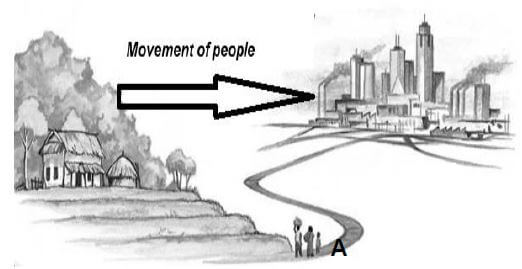
[Adapted from http//: www.Google images]
FIGURE 3.5: THE ORDER OF GOODS AND SERVICES IN THE CBD 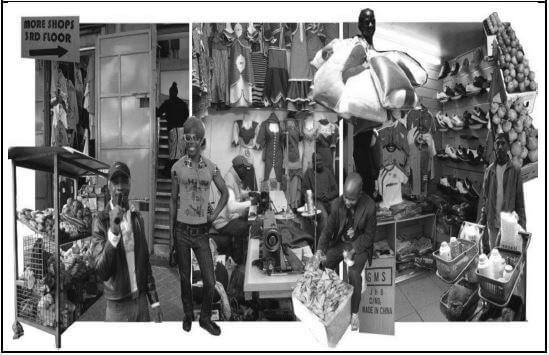
[Source: http:www.citylife.ergo/arv.traders/depot/street/goods]
FIGURE 3.6: ISSUES RELATED TO RAPID URBANISATION 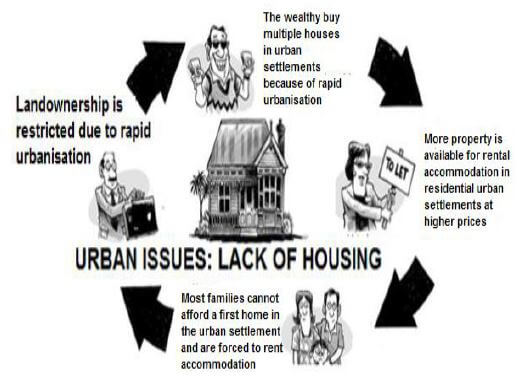
[Adapted by Examiner from Google, images]