GEOGRAPHY PAPER 2 GRADE 12 MEMORANDUM - NSC EXAMS PAST PAPERS AND MEMOS JUNE 2019
Share via Whatsapp Join our WhatsApp Group Join our Telegram GroupGEOGRAPHY
PAPER 2
GRADE 12
NSC EXAMS
PAST PAPERS AND MEMOS JUNE 2019
MEMORANDUM
QUESTION 1: MULTIPLE-CHOICE QUESTIONS
The questions below are based on the 1 : 50 000 topographic map (2527CA RUSTERNBURG) as well as the orthophoto map of the part of the mapped area. Various options are provided as possible answers to the following questions. Choose the answer and write only the letter (A–D) in the block next to each question.
1.1 C
1.2 B
1.3 A
1.4 C
1.5 B
1.6 C
1.7 B
1.8 D
1.9 A
1.10 C
1.11 A
1.12 B
1.13 C
1.14 B
1.15 C (15 × 1) [15]
QUESTION 2: MAP CALCULATIONS AND TECHNIQUES
2.1 The orthophoto is referenced from the topographic map 2527CA 20 RUSTENBURG. State what the following indicate in the index sheet on the orthophoto map.
2.1.1
- CA:
C is the big block (3rd of 4th blocks)✓
A is the small block (1st of small blocks found in big block C)✓ (2 x 1) (2) - 20:
20 is the exact orthophoto map sheet of the 25 that make up the 1 : 50 000 topographic maps ✓ (1 x 1) (1)
2.2 Calculate the magnetic bearing of spot height 1191 (block B7) from the trigonometrical station 29 (block B7) for the year 2019. Show ALL calculations. Marks will be awarded for calculations.
- Formula: Magnetic bearing = True bearing + Magnetic Declination
TB = 247° ✓ (range 245° – 249°)
Magnetic declination for 2019
Difference in years: 2019 – 1997 = 22 ✓ years
Mean annual change: 2ʹ ✓ W
Total change: 22 years x 2ʹ = 44ʹ ✓
Mean mag. declination for 2019: 15° 57ʹ W + ✓ 44ʹ = 16° 41ʹ W ✓
Therefore mag. bearing for 2019: 247° + 16° 41ʹ = 263° 41ʹ ✓
Range (261° 41ʹ – 265° 41ʹ) (7 x 1) (7)
2.3 Refer to the blocks F2 and E4 on the topographic map.
2.3.1 Calculate the average gradient of the N4 road between G (block F2) and H (block E4) on the topographic map.
Show ALL calculations. Marks will be awarded for calculations.
Formula: Gradient = Vertical Interval (V.I)
Horizontal Equivalent (H.E)
- VI = 1298,5 – 1 235,4 = 63,1 ✓ m
HE = 6,6 ✓ cm (range 6,5 – 6,7) cm
HE: 6,6 x 500 = 3 300 ✓m (range 3 250 – 3 350)
G = (63.1)1 OR [63.1 : 3300]
3300 [63.1 63 ]
1/52,3 or 1: 52,3 ✓ (range: 1: 51,5 to 1: 53,1) (5 x 1) (5)
2.3.2 Interpret the gradient calculated in QUESTION 2.3.1.
- For every 52,3 m travelled along the ground, ✓ the height increases by 1 m. ✓ (concept) (2 x 1) (2)
2.3.3 Is G visible from H? Give a reason for your answer.
- Answer: No ✓
- Reason: There is Magaliesberg Mt. range in between G and H ✓ Higher feature between G and H ✓ [Any ONE] (1 + 1) (2)
2.4 Write the scale of the topographic map as a word scale.
- Scale: (1 : 50 000) 1 centimetre on the map represents 50 000 centimetres on the actual ground. ✓
(Units of measurements must be the same to get a full mark.) (1 x 1) (1) [20]
QUESTION 3: APPLICATION AND INTERPRETATION
3.1 Refer to the Dorpspruit River on the topographic and orthophoto maps to answer the questions below.
3.1.1 In which general direction is the Dorpspruit River flowing? Give TWO topographic or orthophoto evidence to support your answer.
- Answer: NE/NNE ✓ (1 x 1) (1)
- Reasons:
- Contour lines are facing NE (orthophoto map) ✓✓
- Dam wall is the NE part of the river (topographic map) ✓✓
- Water is held behind the dam wall in the SE direction. ✓✓
- The non-perennial tributaries in blocks I8 and H9 joins the Dorpspruit river at an acute/small angle from the SW ✓✓
[ANY TWO] (2 x 2) (4)
3.1.2 Is the Dorpspruit river between points 14 and 15 on the orthophoto map in the youth stage or mature stage? Give TWO orthophoto evidences to motivate your answer.
- Answer: Mature stage ✓ (1 x 1) (1)
- Evidence:
- Contour lines are widely spaced out – gentle slope ✓✓
- Valley is an open v-shaped with gentler slope ✓✓
- River begins to meander near point 15 ✓✓
- The river is wider from point 15 to point 14 ✓✓
[Any TWO] (4) (2 x 2)
3.2 The stadium numbered 1 on the orthophoto map has a good location. Provide TWO pieces of topographic and orthophoto evidence to support this statement.
- Flat land – contour lines are far apart ✓✓
- Location is accessible – near N4 and other roads ✓✓
- Located between the low and high-income residential areas ✓✓
- Large population for support base ✓✓ [Any TWO] (2 x 2) (4)
3.3 Locate R (block H9) on the topographic map.
3.3.1 Identify the dominant street pattern within the vicinity of R.
- Grid iron ✓ (1 x 1) (1)
3.3.2 Give ONE map evidence why the street pattern identified in QUESTION 3.3.1 was developed.
- Reason: Due to flat land/relief (contour lines are far apart) ✓✓ (1 x 2) (2)
3.3.3 Why is the street pattern identified in QUESTION 3.3.1, not preferred by modern town planners? Reasons:
- Hampers traffic flow because it has too many stops / many intersections which halt the flow of traffic (gridlock) ✓✓
- Accidents and traffic congestion may occur ✓✓ (2 x 2) (4)
3.4 Find settlement S (block H1) on the topographic map.
3.4.1 Would you describe settlement S as a dry point or wet point settlement?
- Answer: Wet-point settlement ✓ (1 x 1) (1)
3.4.2 Explain your answer to QUESTION 3.4.1.
- The settlement is close to a dam ✓✓
- a non- perennial river ✓✓ (1 x 2) (2)
3.5 Generally, Rustenburg experiences relatively cool summers than expected. Give a reason for that.
- Answer: This is due to higher altitude ✓ (1 x 1) (1) [25]
QUESTION 4: GEOGRAPHICAL INFORMATION SYSTEMS(GIS)
4.1 Provide a GIS concept for the following descriptions.
4.1.1 Data that can be linked to locations in geographical space, usually via features on the map.
- Spatial data ✓
4.1.2 A question, especially if asked to a database by the user via database management systems
- Query ✓
4.1.3 A map designed to show a single spatial distribution pattern, using a specific map type.
- Thematic map ✓
4.1.4 Characteristic of a feature that contains measurements of value for feature and is displayed as columns in a table form.
- Attribute/attribute data ✓
4.1.5 The combination of two or more data layers to create a new one.
- Data integration ✓ (5 x 1) (5)
4.2 Refer to block J3 on the topographic map.
4.2.1 Name the type of vector data used to represent:
- Dam wall: Line ✓
- Cultivated land: Polygon/areal data ✓ (2 x 1) (2)
4.2.2 Explain TWO reasons why GIS specialists prefer using vector data on topographic maps to raster data.
- The use of vector data on topographic map makes map interpretation more user friendly ✓✓
- It is easier to obtain data at a glance/quick referencing It makes it easier for data layering ✓✓
- Data can be rendered at any scale, as symbols are not drawn to scale ✓✓
- Zooming in and out does not change the quality of the topographic data representation ✓✓ [Any TWO] (2 x 2) (4)
4.3 Refer to the extract part of block H1 on which mining of gravel is taking place. The scale of the extract has been exaggerated to 1 : 10 000. 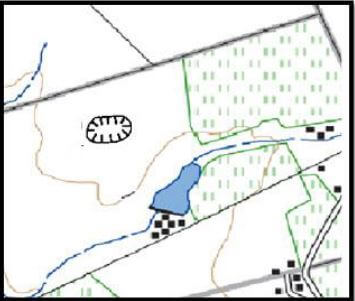
[Source: Extract part of block H1 (scale 1 : 10 000)]
4.3.1 The GIS specialist decides to buffer the excavation so that water quality in the dam and river can be maintained.
- Define the term buffering. It is the demarcation/boundary/delineation/spatial distance of an area around a feature ✓ (1 x 1) (1)
- Create a 100 m buffer around the excavation. Use the above extract to display the buffer.
- Shape (circular) around excavation ✓ (1)
- Correct distance from excavation to boundary (1 cm)✓✓ (2)
(1 mark for not having correct distance – only shape) (1 + 2) (3) [15]
TOTAL: 75