RATE AND EXTENT OF REACTIONS GRADE 12 NOTES - PHYSICAL SCIENCE PAPER 2: CHEMISTRY STUDY GUIDES
Share via Whatsapp Join our WhatsApp Group Join our Telegram Group- Summary
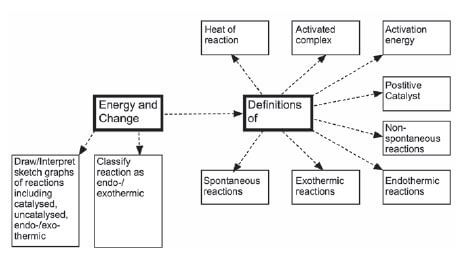
- Energy changes during chemical reactions
- Activation energy and the activated complex
- Catalysts
- Energy changes during chemical reactions: ∆H
- Endothermic and exothermic reactions
- Rates of reactions
- Factors which affect reaction rate
- The Collision Theory
- The mechanism of reactions
- Measuring rates of reactions
Rate and extent of reactions
2.1 Summary
2.2 Energy changes during chemical reactions
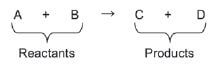
During a chemical reaction, the reactants (written on the left hand side of the equation) react to produce products (written on the right hand side of the equation).
Chemical reactions take place in steps
Step 1: The reactant particles need energy so that the existing bonds (covalent, ionic or metallic bonds) between the particles in the reactants can break;
Step 2: The separated particles that are present in the activated complex move and collide;
Step 3: Energy is released by the particles as new bonds form when the products are produced. However, endothermic reactions, as we will later see, take in energy from the surroundings as they come to completion.
2.3 Activation energy and the activated complex
Activation energy is usually absorbed in the form of heat, light or mechanical energy and is required to change reactants into an activated complex. It is the energy required to break the bonds in the reactant particles to form the activated complex.
- Spontaneous reactions take place when the reactants have enough energy to start the reaction without additional heat.
- Non-spontaneous reactions take place when the reactants do not have enough energy themselves to start a reaction, and additional energy needs to be added.
hint “Spontaneous”intervention”. means “of its own accord” or “by itself” or “without
NB: DEFINITIONS
- Activation energy is the minimum kinetic energy required for a chemical reaction to take place.
- The activated complex is a temporary, unstable, high energy intermediate state between the reactants and the products.
NB
- A spontaneous reaction takes place without any addition of energy.
- The mass of a catalyst remains constant during a chemical reaction.
2.4 Catalysts
A positive catalyst increases the rate at which a reaction takes place while a negative catalyst (also called an inhibitor) decreases the reaction rate.
- If you hear someone talk about a “catalyst”, they usually mean a positive catalyst.
Positive catalysts increase the rate of a chemical reaction... by providing an alternative path for the reaction to take place which requires less energy for the reactants to change into the activated complex, by decreasing the activation energy.
NB: DEFINITIONS
- A catalyst is a substance that changes the rate of a chemical reaction without undergoing a permanent change during the reaction, by decreasing the activation energy of the reaction.
- The heat of reaction or enthalpy (∆H) is the net change in energy in a chemical system when a chemical reaction takes place.
2.5 Energy changes during chemical reactions: ∆H
We know that energy is absorbed by the reactant particles when the intramolecular bonds break to form the activated complex, and is is released when the particles in the activated complex form new bonds when the products form.
In symbols:
- ∆H = Energy of products – Energy of reactants
Eproducts – Ereactants
Efinal – Einitial
OR - ∆H = Hproducts – Hreactants
Hfinal – Hinitial
2.6 Endothermic and exothermic reactions
When we refer to a reversible reaction, the enthalpy (ΔH) is always stated for the forward reaction.
It is important:
- to know the differences between exothermic and endothermic reactions
- to be able to identify whether a given reaction is exothermic or endothermic and
- to be able to interpret graphs for exothermic and endothermic reactions.
- Endo- means “into” or “inwards”, and “exo-” means “outwards”; so, “endothermic” means heat goes in (the reaction vessel will feel cold after the reaction completes), whereas “exothermic” means “heat goes out”, so the reaction vessel will feel hot when the reaction completes.
| 2.6.1 EXOTHERMIC REACTIONS | 2.6.2 ENDOTHERMIC REACTIONS |
| More energy is released when the new bonds form than is absorbed when the existing bonds break. | More energy is absorbed when the existing bonds break than is released when the new bonds form. |
|
|
| Example: fire: C (coal) + O2 (in air) → CO2 | Example: dissolving ammonium nitrate in water. |
| Writing conventions: CO(g) + NO2(g) → CO2(g) + NO(g) ΔH = – 226 kJ·mol–1 CO(g) + NO2(g) → CO2(g) + NO(g) ΔH < 0 CO(g) + NO2(g) → CO2(g) + NO(g) + Energy CO(g) + NO2(g) → CO2(g) + NO(g) + 226 kJ·mol–1 | Writing conventions: H2O(ℓ) → H2O(g) ΔH = 41 kJ·mol–1 H2O(ℓ) → H2O(g) ΔH>0 H2O(ℓ) + Energy → H2O(g) H2O(ℓ) + 41 kJ·mol–1 → H2O(g) |
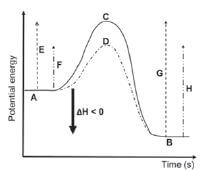 | 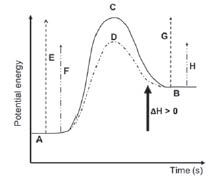 |
| Key to the symbols on the graphs: A: reactants (for the forward reaction) / products (for the B: products (for the forward reaction) / reactants (for the C: activated complex (without a catalyst) D: activated complex (with a catalyst) | E: activation energy for the forward reaction (without a reverse reaction) catalyst) F: activation energy of the forward reaction (with a catalyst) reverse reaction) G: activation energy of the reverse reaction (without a catalyst) H: activation energy of the reverse reaction (with a catalyst) |
2.6.3 Law of conservation of energy
The release of energy in chemical reactions occurs when the reactants have higher chemical energy than the products. The chemical energy in a substance is a type of potential energy stored within the substance. This stored chemical potential energy is the heat content or enthalpy of the substance. The collection of substances that is involved in a chemical reaction is referred to as a system and anything else around it is called the surroundings. If the enthalpy decreases during a chemical reaction, a corresponding amount of energy must be released to the surroundings. Conversely, if the enthalpy increases during a reaction, a corresponding amount of energy must be absorbed from the surroundings. This is simply the Law of Conservation of Energy. Now, to break a chemical bond, requires energy. Some substances need more and some substances need less energy to break the bond – depending on the bond energy (measure of the bond strength of the chemical bond) i.e. potential energy of the bonds of the initial reactants. Some reactants obtain the energy required to break the bonds from the surroundings, which might include the energy that is released when the bonds in the products are formed. To form a bond releases energy; when the bond is formed in the product, the product releases energy, of which some energy is “given back” to break the bonds of the reactants – so they can break! For our purpose it is enough to simply talk about ‘the total energy released’ when the product is formed in an exothermic reaction is more (entalphy decreases) than the amount of energy required to break the initial reactants’ bonds.
e.g. Worked example 1
When there is a limited supply of oxygen, such as in a car which is not tuned properly, octane burns incompletely to produce carbon monoxide (amongst other emissions).
The graph alongside represents the energy changes that take place during this reaction and the balanced chemical equation is given: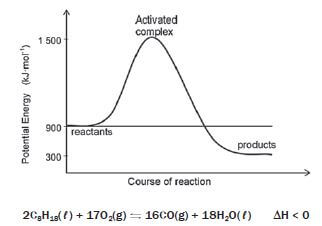
2C8H18(ℓ) + 17O2(g) ⇌ 16CO(g) + 18H2O(ℓ) ∆H < 0
1. What is the activation energy for the forward reaction?
2. What is the activation energy of the reverse reaction?
3. What is the heat of reaction for this reaction?
4. Is this reaction exothermic or endothermic? Motivate.
5. Use the chemical equation above and give a reason why vehicles with incorrectly tuned engines are a health hazard.
6. Part of the action of catalytic converters is to speed up the complete oxidation of carbon monoxide (CO) and petrol (C8H18) from incorrectly tuned engines to CO2.
Why should people support legislation that makes catalytic converters a necessary component of exhaust systems of automobiles?
7. The graph below represents the relationship between potential energy and course of a reaction for a certain chemical reaction.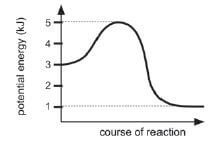
The activation energy of this reaction is:
- 1kJ
- 2kJ
- 3kJ
- 4kJ
Solutions
1. EActivated = EActivated Complex – Ereactants = 1 500 – 900 = 600 kJ·mol–1
2. EActivated = EActivated Complex – Ereactants = 1 500 – 300 = 1 200 kJ·mol–1
3. ∆H = Eproducts – Ereactants = 300 – 900 = – 600 kJ·mol–1
4. The reaction is exothermic because∆H is negative.
5. CO is poisonous.
6. Catalytic converters ensure conversion of products to CO2 so that the danger of CO poisoning is minimised.
7. Eactivated = Ecomplex – Ereagents =5–3=2 (B): 2kJ
2.7 Rates of reactions
NB: DEFINITION
- The rate of a reaction (reaction rate) is the change in concentration of reactants or products per unit time.
In symbols:
| Where:
|
Activity 1
Consider the reaction
H2 +I2→2HI (∆H < 0)
1. Is this reaction exothermic or endothermic? (1)
2. State a reason for your answer in 1.1. (1)
3. How does energy of the products compare to that of the reactants? (2) [4]
Solutions
1. Exothermic (reaction). ✓ (1)
2. ∆H<0✓ (1)
3. The energy of the products is less than ✓ that of the reactants. ✓ (2) [4]
2.8 Factors which affect reaction rate
The rate at which a chemical reaction takes place depends on the reaction conditions. In industry it is important to make sure that the chemical reactions take place at a rate as high as is safely and economically possible.
FACTOR | EFFECT ON REACTION RATE |
|
|
|
|
|
|
|
|
|
|
2.9 The Collision Theory
The collision theory is applied to explain how these factors affect the rates of chemical reactions.
According to the Kinetic Molecular Theory, the particles in a reaction mixture are in a state of perpetual random motion and therefore collide with one another.
Only effective collisions between reactant particles lead to chemical reactions and the formation of new products.
An effective collision between reactant particles takes place if:
the colliding particles have enough kinetic energy to form an activated complex i.e. if the energy of the colliding particles is equal to or more than the activation energy for the reaction AND the particles are correctly orientated when they collide.
- hint Remember
If a reaction is fast, it has a short reaction time but a high reaction rate.
The rate of a chemical reaction depends on the number of effective collisions between the reactant particles per second; the number of collisions for which the particles have energy more than or equal to the activation energy and on the number of collisions that are correctly orientated. Hence, smaller particles e.g. dust or gas, react more violently than larger particles, e.g. crystals, since the reactants can mix more thoroughly and therefore increase the number of effective collisions. Compare, for example, the explosive quality of gunpowder to say, lumps of solid ingredients like sulphur, potassium nitrate, and coal.
hint Remember
The more effective collisions that occur between the reactant particles per second, the faster the reaction will occur.
In symbols:
- reaction rate ∝ (number of effective collisions per unit time)
- (particles with correct orientation)
- (particles with sufficient (enough) Ek)
2.10 The mechanism of reactions
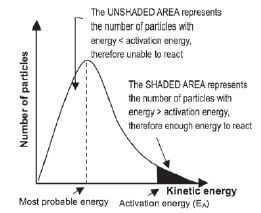
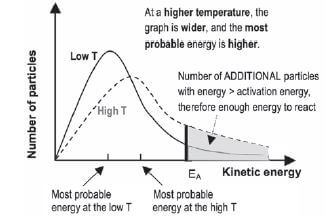
The Maxwell-Boltzmann distribution diagram shown below shows the distribution of the kinetic energy of the particles in a reaction system. The distribution of the kinetic energies of the reactant particles is used to explain the reaction rate in the system.
- The graph shows the number of particles (on the vertical axis) versus their kinetic energy (on the horizontal axis).

- The curve always passes through the origin — this means that no molecules have zero kinetic energy since all molecules are in motion — unless they reach the temperature of 0 K or –273˚C.
- The curve does not touch the x-axis at high kinetic energy i.e. there are always some molecules with very high kinetic energy.
- The energy value that corresponds with the peak of the curve represents the most probable energy.
- The area below the curve is equal to the total number of molecules in the system.
- The shaded area below the curve and to the right of the activation energy, equals the number of reactant particles that have enough energy to collide effectively and therefore can react.
- The area below the curve and to the left of the activation energy, equals the number of reactant particles that can’t collide effectively and therefore can’t react.
- If the shaded area is bigger, there are more particles that can collide effectively and the reaction rate is higher.
a). The effect of increasing the temperature of the reaction mixture
If the temperature increases:
NB: DEFINITION
Temperature is a measure of the average kinetic energy of the particles in a sample.
- The particles in the sample have a higher average kinetic energy and the most probable energy is higher than at a low temperature.
- The graph is wider and the peak is lower.
- The total number of particles is the same, so the total area below the graph is the same.
- More particles have kinetic energy > than the activation energy (the shaded area is bigger)
- ∴ more effective collisions take place per second and the collisions are more energetic
- ∴ the reaction rate increases.
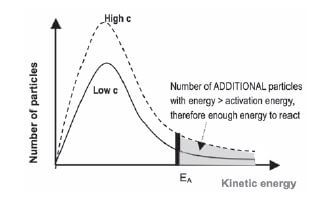
b). The effect of increasing the concentration of the reactants
If the concentration of the reactants increases:
- The particles in the sample have the same average kinetic energy and the most probable energy is the same ∴ the graph has the same curve/shape
- The graph is higher as there are now more particles per unit volume;
- The total number of particles is greater, so the total area below the graph is bigger.
- More particles have energy > than the activation energy (the shaded area is bigger)
- ∴ more effective collisions take place per second
- ∴ the reaction rate increases.

hint Remember
When adding a suitable catalyst:
- the total number of reactant particles stays constant and
- the average kinetic energy of the reactant particles remains constant as the temperature does not change.
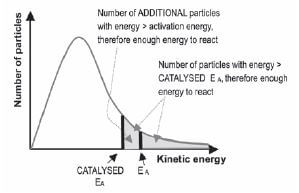
c). The effect of adding a catalyst
Adding a suitable positive catalyst:
- decreases the activation energy needed to change the reactants into an activated complex so
- more particles have enough energy to form an activated complex
- ∴ the number of possible effective collisions per second increases and
- ∴ the reaction rate increases.

Maxwell-Boltzman graph has a shallow gradient if the reaction rate is higher BUT in a graph of mass loss vs time, a shallow gradient means the reaction rate is lower.
e.g. Worked example 2
Consider the following Maxwell-Boltzman distribution diagram for a chemical reaction system and answer the questions that follow.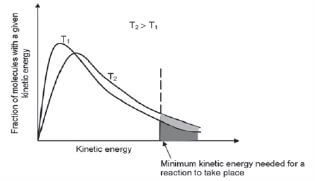
1. Did all the molecules have the same kinetic energy at low temperature? Motivate your answer.
2. What does the shaded area to the right of the vertical line represent?
3. If a catalyst is added to the reactants, will it cause the vertical dotted line to move to the left or right? Explain your answer.
Solutions
1. No. Together they will have the same average kinetic energy, but each molecule’s kinetic energy is determined by its mass and the square of its own average speed (remember, Ek = 1/2 mv2).
2. It indicates the % of molecules which will have more energy than the activation energy at that temperature. In other words, the % of molecules which are capable of colliding effectively and reacting. At the higher temperature, there is a higher % of molecules which are capable of colliding effectively (bigger area below the graph).
3. To the left. The activation energy of the reaction is decreased by adding a suitable catalyst. The line thus shifts to the left. It implies that at both the low and the high temperatures there will now be a greater % of molecules available for effective collisions.
2.11 Measuring rates of reactions
We measure the rate of a reaction by studying the rate at which (how fast) the products appear or the rate at which the reactants are used up while the reaction takes place.
Experimental techniques for measuring the rate of a given reaction include the following:
- measuring of gas volumes produced,
- turbidity (e.g. precipitate formation),
- change of colour and
- the change of the mass of the reaction vessel if a gaseous product is allowed to escape from it.
Experimental Technique 1: Measuring turbidity
Na2S2O3(aq) + 2HCℓ(aq) → 2NaCℓ(aq) + H2O(ℓ) + SO2(g) + S(s)
Sodium thiosulphate reacts with diluted hydrochloric acid to form a yellow sulphur precipitate. The formation of the precipitate can be used to measure the reaction rate.
Apparatus: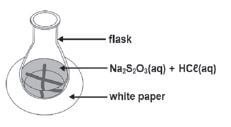
NB: DEFINITIONS
- Turbidity is the cloudiness or haziness of a fluid (liquid or solution) that is caused by particles in the fluid which prevent light from passing through the liquid.
- Opaque: not transparent, does not allow light to pass through.
Method:
1. Draw a black cross on a piece of paper.
2. Add an exact volume of Na2S2O3 to a conical flask and place it on the cross.
3. Quickly add HCℓ to the solution and start the stopwatch.
4. Swirl (turn) the flask carefully and allow the reaction to continue until the black cross can no longer be seen.
5. Record the time.
In this experiment, the concentration of the HCℓ(aq) and Na2S2O3(aq) can be changed, keeping the temperature constant OR In another experiment, the temperature can be changed, but keeping the concentrations constant. The time it takes for the solution to become opaque is a measure of the reaction rate.
Experimental Technique 2: Measuring the volume of a gas product
Consider the following reactions:
- Mg(s) + 2HCℓ(aq) → MgCℓ2(aq) + H2(g) OR
- CaCO3(s) + 2HCℓ(aq) → CaCℓ2(aq) + H2O(ℓ) + CO2(g) OR
MnO2(s) - 2KCℓO3(s) → 2KCℓ(s) + 3O2(g)
(The catalysed decomposition of potassium chlorate)
1. The rate of the reaction is determined by measuring the volume of the gas produced (the dependent variable) in specific time intervals (the independent variable). If you can’t recall what the terms “independent” and “dependent variables” mean, see the introduction section of this book.
2. The gas is collected in a graduated gas syringe or by the downward displacement of water in a burette. The volume of the gas produced can be determined accurately.
3. The stopwatch is started when the reactants are added and stopped when no new bubbles form – i.e. when the volume of gas produced stays constant.
Apparatus: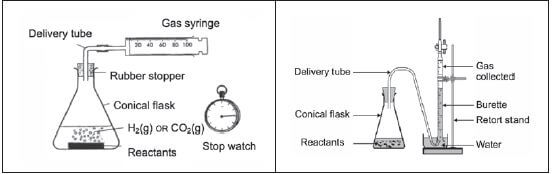
Graph of volume of gas produced vs. time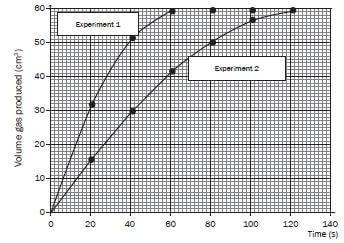
Experimental Technique 3: Measuring the total mass of reactants and the mass loss:
Consider the same reactions as used in Technique 2.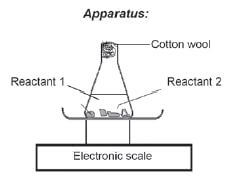
Method:
- The rate of the reaction is determined by measuring the mass of the gas produced (the dependent variable) in specific time intervals (the independent variable).
- The reactants are added to the flask and the mouth of the flask is plugged with some cotton wool.
- The mass of the reaction system (the reactants, flask and cotton wool) is recorded at the start of the experiment and the stop watch is started.
- The gas that is produced passes through the cotton wool plug and escapes from the system, so the mass (the reading on the scale) decreases.
- The mass of the system is recorded at regular time intervals e.g. every 30 seconds.
- The stopwatch is stopped when no new bubbles form – i.e. when the mass reading on the scale stays constant.
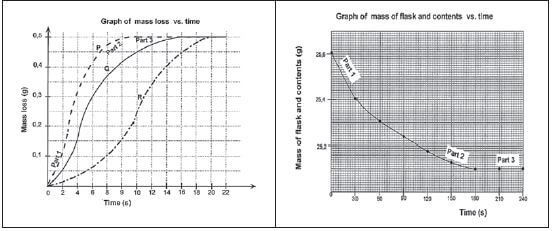
- The results are used to plot a graph of: mass of the flask and contents versus time OR mass loss (mass of gas escaped) versus time.
hint
- The mouth of the flask is plugged with cotton wool because it is porous and allows the gas to escape from the reaction system but prevents liquid spray that forms during the reaction, from escaping.
hint
- The gradients of the graphs indicate the rates of the reactions.
- The steeper (more vertical) the gradient of the graph, the higher the reaction rate, because more happens in less time.
Limiting reactant: The reactant that is used up during a chemical reaction – all of the reactant reacts.
Excess reactant: The reactant that is not all used up during a chemical reaction – there is always some of this reactant left in the reaction system once the reaction has stopped
Interpreting the graphs that use Techniques 2 and 3:
There are three time intervals shown in the graphs:
| Stage in the reaction | Explanation |
Part 1 of both graphs
|
|
Part 2 shows
|
|
Part 3 is where
| When the limiting reactant has been used up (all of it has reacted)
|
e.g. Worked example 3
A group of learners use the reaction between hydrochloric acid and magnesium powder to investigate one of the factors that influence the rate of a chemical reaction.
The reaction that takes place is:
Mg(s) + 2HCℓ(aq) → MgCℓ2(aq) + H2(g)
The learners use the apparatus and follow the method shown below to conduct the investigation.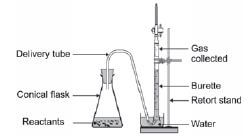
Method for Experiment 1:
Step 1: Place a spatula (spoon) of magnesium powder in a conical flask and add 50 cm3 HCℓ(aq) of known concentration.
Step 2: Simultaneously start the stopwatch and close the flask with the rubber stopper containing the delivery tube.
Step 3: Measure the volume of the H2(g) formed in time intervals of seconds.
Method for Experiment 2:
Repeat steps 1 to 3 above, but use only 25 cm3 of the same HCℓ(aq) diluted to 50 cm3 with distilled water.
- How does the concentration of the acid used in Experiment 2 differ from the concentration of the acid used in Experiment 1? Write down only greater than, lower than or equal to.
- Write down a hypothesis for this investigation.
- Why should the learners ensure that equal amounts of magnesium powder are used in each of the two experiments?
- The learners use an excess of HCℓ(aq) for the two experiments. What meaning does the term ‘excess’ have in this situation? Give a reason why the excess HCℓ(aq) will not influence the results.
- If the Mg powder used in Experiment 1 was impure with particles of dirt in between, describe and explain how the shape of the graph would be influenced.
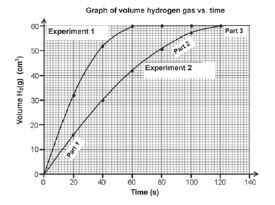
- After completing the investigation, the learners represent the results obtained during each experiment on the graph below.

Write down the volume of hydrogen gas formed during the first minute in:
6.1 Experiment 1
6.2 Experiment 2 - Which one of the experiments took place at the faster rate? Refer to the shape of the curves to motivate your answer.
- Give a reason why the final volume of gas produced is the same in both experiments.
- What conclusion can the learners draw from the results obtained?
- How will an increase in the temperature influence the following? Write down increases, decreases or remains the same.
10.1 The final volume of gas obtained in each experiment
10.2 The volume of gas obtained in each experiment after 40 s - Why do both graphs form horizontal lines respectively at t = 60 s and t = 120 s?
- Give two reasons why the rate of formation of hydrogen gas is lower at t = 50 s than at t = 20 s.
- Determine the rate of formation of hydrogen gas in Experiment 2 at t = 20 s.
- In a third experiment, Experiment 3, half the mass of magnesium was used in powder form.
14.1 How will this change influence the final volume of gas compared to Experiment 1 and 2?
14.2 Explain your answer.
hint
The hypothesis must refer to the relationship between dependent and independent variables. It must be a statement that can be proved to be correct or incorrect, it is a prediction based on (prior) knowledge.
Solutions
- Smaller than or lower than (not ‘less’ or ‘diluted’).
- Possible answer:
If the concentration of the reactants in a chemical reaction increases, the reaction rate will increase. - The mass of the Mg is a controlled variable to ensure a fair test.
There is only one independent variable which changes from the one experiment to the next i.e. the concentration of the acid. - ‘Excess’ means that there is more than enough hydrochloric acid for the reaction to take place. When the reaction is complete, all the Mg will have reacted, but some of the acid will be left over. The Mg is the limiting reactant and when it has all reacted, the reaction will stop.
- The gradient would be less steep, indicating that the reaction rate is lower. Because the reaction surface area of the magnesium is smaller, fewer particles are available to collide, thus fewer effective collisions will occur. The final volume of hydrogen gas formed will be less, because the magnesium is the limiting reagent and a smaller mass of pure magnesium was reacting, because of the dirt in between.
- 6.1 60 cm3
6.2 42 cm3 - Experiment 1.The gradient or slope (of the tangent to the graph) is steeper.
- The mass of Mg used in both experiments was the same.
Mg is the limiting reagent and the limiting reagent determines the yield of the products. - If the concentration of the reactants in a chemical reaction increases, the reaction rate will increase.
- 10.1 Remains the same.
10.2 Increases. - The horizontal lines mean that the reactions are complete; all the magnesium has reacted with the excess HCℓ.
Experiment 1 reaches completion first because of the higher concentration of HCℓ (more particles per unit volume to react), so more effective collisions will occur and the reaction rate is higher. - At 50 s the concentration of HCℓ has already decreased notably, and there is much less magnesium left, with a smaller exposed surface area. Thus the collisions are less effective and the reaction rate is lower.
- Reaction rate = slope (gradient)
= ∆y
∆x
= ∆volume H2
∆time
= (16–0)
(20–0)
= 0,8 cm3
s - 14.1 The final volume of hydrogen gas in Experiment 3 will be half the volume of hydrogen gas produced in Experiment 1 and 2.
14.2 Mg is the limiting reagent which determines the yield.
From the balanced equation: 1 mol Mg(s) produces 1 mol H2(g), thus 1/2 mol Mg(s) produces 1/2 mol H2(g)
e.g. Worked example 4
A certain mass of calcium carbonate chunks is added to a hydrochloric acid solution in an open beaker on a scale as shown here. The equation for the reaction is as follows:
CaCO3(s) + 2HCℓ(aq) → CaCℓ2(aq) + H2O(ℓ) + CO2(g)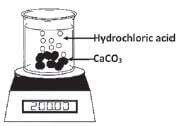
CO2(g) is allowed to escape from the beaker. The data in the table below was obtained for a time interval of 8 minutes.
Time (min) | Mass of beaker and contents (g) |
0 | 200,00 |
1 | 197,50 |
2 | 195,45 |
3 | 193,55 |
4 | 191,70 |
5 | 189,90 |
6 | 188,15 |
7 | 186,45 |
8 | 184,80 |
- Explain the term ‘reaction rate’.
- Calculate the change in the mass of the beaker and its contents during the 8 minutes.
- Use your answer to Question 2 to show that the average reaction rate during the 8 minutes is 1,9 g•min–1.
- Calculate the mass of calcium carbonate which reacted during the 8 minutes.
- “The use of the beaker in this experiment influences the readings and therefore the calculation of the rate of the reaction and mass of the CO2 formed”. Explain this statement and suggest TWO ways to rectify this experimental problem and to make this a reasonable test.
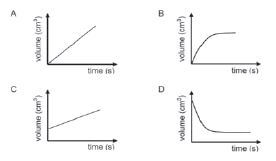
- One of the products formed in a chemical reaction is a gas. Which ONE of the following graphs of volume versus time best represents the formation of this gas until the reactants are used up?

Solutions
- The change in amount/mass/volume/concentration of products formed per unit time.
OR
The change in amount/mass/volume/concentration of reactants used per unit time. - Change in mass = 200 – 184,8 = 15,2 g
- Rate of reaction = change in mass = 15,2
time taken 8
= 1,9 g × min–1 CO2 produced - mol CO2 formed:
M(CO2) = 44 gmol–1 and M(CaCO3) = 100 g•mol–1 (for all the calculating molar masses)
Mass CO2 produced = ∆m = 200 – 184,8 = 15,2 g
∴mol CO2 produced:
n = m = 15,2 = 0,35 mol CO2
M 44
From the balanced equation:
1 mol CaCO3 : 1 mol CO2
∴ 0,35 mol CaCO3 : 0,35 mol CO2
So the mass CaCO3 that reacted:
n = m ∴ 0,35 = m ∴ m = (0,35)(100) = 35 g
M 100 - Use a conical flask instead of a beaker and plug the mouth of the flask with cotton wool. The plug prevents the acid spray and water vapour from escaping from the flask. The CO2 gas can escape through the cotton wool. Escaping vapour from the beaker originally used will affect the change in mass readings and thus cause inaccurate measurement of the rate of reaction.
The calcium carbonate must be placed in a small test tube that fits into the flask. When the flask is lightly shaken, the test tube falls over and the acid reacts. This also prevents acid spray and water vapour from splashing out. Ensure that the stop watch is started when the two reactants come into contact and that it is stopped as soon as all the Mg has reacted. - B.
Note:
In the calculation, n = 0,3454 was rounded off to 0,35 so that: Mass = m(100) = 34,54 g
Activity 2
1. Hydrogen gas may be prepared by the reaction of zinc metal with dilute hydrochloric acid. The chemical equation for this reaction is :
Zn(s) + 2HCℓ(aq) → ZnCℓ2(aq) + H2(g) ∆H < 0
A learner determined the volume of the hydrogen produced with time at two temperatures and two grades of Zn; powder and solid pellets. He used the same mass of zinc and the same volume and concentration of hydrochloric acid for each experiment and plotted the following graphs.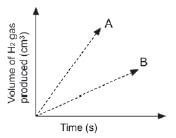
Which combination of temperature and surface area will be represented by A? (2)
Temperature | State of Zn | |
| A | High | Pellets |
| B | High | Powder |
| C | Low | Pellets |
| D | Low | Powder |
2, The graphs below represent the molecular distribution for a reaction at different temperatures.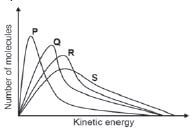
Which ONE of the graphs above represents the reaction at the highest temperature? (2)
- P
- Q
- R
- S [4]
Solutions
1. B 33 (2)
2. D 33 (2) [4]
Activity 3
Give ONE term for each of the following descriptions by choosing a term from the list above. Write down only the term next to the question number.
| Surface Area; Catalyst; Elastic collision; Effective collision; Activated complex; Concentration; Temperature; Heat of reaction; Activation energy. |
1. A chemical substance that speeds up the rate of a chemical reaction by lowering the net activation energy. (1)
2. A collision in which the reacting particles have sufficient kinetic energy and correct orientation. (1)
3. The factor responsible for increasing the rate of a reaction when a solid is broken up into smaller pieces. (1)
4. The temporary unstable state that is formed during the course of a chemical reaction. (1)
5. A measure of the average kinetic energy of the particles in a gas. (1)
6. The net amount of energy released or absorbed during a chemical reaction. (1) [6]
Solutions
1. Catalyst. ✓ (1)
2. Effective collision. ✓ (1)
3. Surface Area. ✓ (1)
4. Activated complex. ✓ (1)
5. Temperature. ✓ (1)
6. Heat of reaction. ✓ (1) [6]
e.g. Worked example 5
Learners use hydrochloric acid and a sodium thiosulphate (Na2S2O3) solution to investigate the relationship between rate of reaction and temperature. The reaction that takes place is represented by the following equation:
Na2S2O3(aq) + 2HCℓ(aq) → 2NaCℓ(aq) + S(s) + H2O(ℓ) + SO2(g)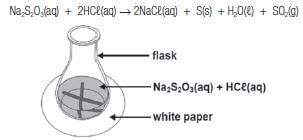
They add 5 cm3 2 mol·dm–3 hydrochloric acid solution to 50 cm3 sodium thiosulphate solution in a flask placed over a cross drawn on a sheet of a white paper, as shown in the diagram below. The temperature of the mixture is 30°.
They measure the time it takes for the cross to become invisible. The experiment is repeated with the temperature of the mixture at 40˚C, 50˚C and 60˚C.
- Write down:
1.1 The possible hypothesis for this investigation.
1.2 NAME or FORMULA of the product that requires the need to work in a well-ventilated room.
1.3 NAME or FORMULA of the product that causes the cross to become invisible. - Apart from the volume of the reactants, state ONE other variable that must be kept constant during this investigation.
- Why is it advisable that the same learner observes the time that it takes for the cross to become invisible?
- What experimental technique was used to measure the rate of reaction in this investigation?
- The shown graph below is obtained from the results.

5.1 What is the relationship represented by 1/time on the vertical axis?
5.2 What conclusion can be drawn from the results obtained?
The learners collected washed and dried sulphur. They weighed the dry sulphur and its mass was 0,12g. Calculate the percentage yield of sulphur.

Solutions
- 1.1 E.g. The rate of reaction increase with increase in temperature.
1.2 Sulphur dioxide/SO2.
1.3 Sulphur/S. - Concentration of reactants (HCℓ and Na2S2O3).
- Different people have different sight abilities/reaction times. (To ensure that the results are reliable).
- Turbidity.
- 5.1 Reaction rate.
5.2 The reaction rate increases with increase in temperature. - Na2S2O3(aq) + 2HCℓ(aq) → 2NaCℓ(aq) + S(s) + H2O(ℓ) + SO2(g)
n(HCℓ) = CV
n(HCℓ) = (2)(0,005)
n(HCℓ) = 0,01 mol
2 n(HCℓ) = 1 n(S)
n(S) = 0, 005 mol
n = m/M
0,005 = m/32
m(s) = 0,16 g
Percentage Yield = 0,12/0,16 × 100
Percentage Yield = 75 (%)
e.g. Worked example 6
A hydrogen peroxide solution dissociates slowly at room temperature according to the following equation:
2H2O2(aq) → 2H2O(ℓ) + O2(g)
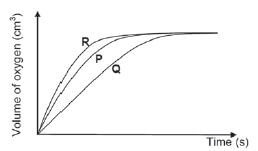
During an investigation, learners compare the effectiveness of three different catalysts on rate of decomposition of hydrogen peroxide. They place EQUAL AMOUNTS of sufficient hydrogen peroxide into three separate containers. They add EQUAL AMOUNTS of THREE catalyst, P, Q and R, to the hydrogen peroxide in the three containers respectively and measure the rate at which oxygen gas is produced.
- For this investigation, write down the:
1.1 Independent variable.
1.2 Dependent variable.
- Which catalyst is the most effective? Give a reason for your answer.
- Fully explain, by referring to the collision theory, how the catalyst increases the rate of reaction.
In another experiment, the learners obtain the following results for the decomposition of hydrogen peroxide:TIME(s)
H2O2 CONCENTRATED (mol·dm–3)
0
0,0200
200
0,0160
400
0,0131
600
0,0106
800
0,0086
- Calculate the AVERAGE rate of decomposition (in mol·dm–3) of H2O2(aq) in the first 400s.
- Will the rate of decomposition at 600 s be GREATER THAN, LESS THAN or EQUAL TO the rate calculated in QUESTION 4.4? Give a reason for the answer.
- Calculate the mass of oxygen produced in the first 600 s if the 50 cm3 of hydrogen peroxide decomposes in this time interval.
Solutions
- 1.1 (Type of) catalyst.
1.2 Rate (of reaction). - R. It has the fastest reaction rate./ steepest gradient or slope./ Produces oxygen in a fastest or in shorter time. (Any of these reasons)
- A catalyst provides an alternative reaction path with a lower activation energy.
More molecules have sufficient/enough kinetic energy.
OR
More molecules have kinetic energy equal to or greater than activation energy.
More effective collisions per unit time./Rate of effective collisions increases. - Average rate = ∆[H2O2]
∆t
= ( 0,0131 – 0,020 )
400-0
= 1,73 × 10⁻⁵ mol·dm–3·s–1 - Less than. The concentration of hydrogen peroxide is decreasing as the reaction proceeds.
- OPTION 1
c = n/V
(0,0200 – 0,0106) = n
(50 × 10–3)
n(O2) = 1/2 n(H2O2) = 1/2 (4,7 × 10⁻⁴)
n(O2) = m/M
2,35 × 10⁻⁴ mol = m/32
m(O2) = 0,008g ≈ 0,01g
OPTION 2
∆c(H2O2) = (0,0200 – 0,0106) = 0,0094
∆c(O2) = 1/2 n(H2O2) = 1/2 (0,0094)
= 4,7 × 10⁻⁴
c = m
MV
m(O2) = cMV
m(O2) = (0,0047)(3)(50 × 10–3)
m(O2) = 0,008g ≈ 0,01g
e.g. Worked example 7
The apparatus shown below is used to investigate the rate at which hydrogen gas produced when a 6,5 g of zinc reacts with 30 ml of 1mol·dm–3 HCℓ.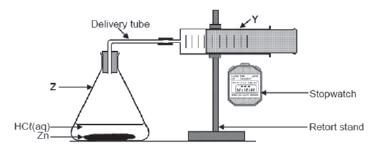
The reaction that takes place is represented by the following balanced equation:
2HCℓ(aq) + Zn(s) → ZnCℓ(aq) + H2(g)
- What experimental method is used to measure the reaction rate in this experiment?
- What other experimental method can be used to measure the (reaction) rate for this reaction?
- Determine the limiting reagent (using calculations).
- Write down:
4.1 The name of the flask labelled Z.
4.2 ONE function of the item of apparatus labelled Y in THIS investigation.
Two experiments are conducted using apparatus above. The conditions for each experiment are given below.Experiment 1
Experiment 2
Zinc
powdered
powdered
Hydrochloric acid
2 mol·dm–3
2 mol·dm–3
Temperature
25˚C
40˚C
- FROM THE TABLE ABOVE, write down:
5.1 The independent variable for this investigation.
5.2 ONE controlled variable.
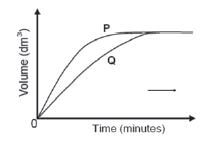
The volume of hydrogen gas produced is measured in each experiment. The graphs below show the results obtained.
- Which graph, P or Q, represents Experiment 2? Refer to the data given in the table, as well as the shape of the graph, to explain how you arrived at the answer.
- Give a reason why the rate of hydrogen production slows down towards the end in both experiments.
- Calculate the mass of zinc used to prepare 0,024 dm3 of hydrogen of hydrogen at room temperature. Assume that 1 mole of hydrogen gas has a volume of 24,04 dm3 at room temperature.
Solutions
- Measuring the volume of a gas produced.
- Measuring change in mass of reactants.
- n = n/M
n = 3,25/65
n = 0,05 mol
Zn + 2HCℓ → ZnCℓ2 + 2H2
n = CV = (2)( 30/1000 )
n = 0,06 mol
Therefore the limiting agent is HCℓ - 4.1 Conical/Erlenmeyer (flask).
4.2 Measure the volume of gas produced./ Collect the gas produced. - 5.1 Temperature (of reactants).
5.2 Concentration (of HCℓ) - P.
Experiment 2 has the highest temperature. The same volume of a gas was produced in a shortest period of time.OR Experiment 2 has the highest temperature. Graph has the steepest slope. - The concentration of reactants decreases as the reaction proceeds.
-
Calculations Mark allocation n(H2) = V / Vm n(H2) = 0,24/24,01
n(H2) = 0,01 mol
n(H2) = n / M
0,01 = m / 65
m = 0,65 gOR
1 mol H2 gas = 24,04 dm3
0,01 mol H2 gas = 0,24 dm3
65 g Zn = 1 mol
0,65 g = 0,01 mol✓Substitute volume.
✓Substitute molar volume.
✓0,01mol
✓n(Zn) = n(H2)
✓Substitute 65 g•mol–1
✓Answer.
Activity 4
81,1 g of nicotine consists of 60,07 g of carbon, 14,01 g of nitrogen and 7,02 g of hydrogen.
Determine the:
- The empirical formula of nicotine. (13)
- Molecular formula of nicotine if its molar mass is 162,26g. (4) [17]
Solutions
Determining the percentage composition by molar mass of each element:
- C = 60,07 × 100 = 74,04%
81,1 - N = 14,01 × 100 = 17,27%
81,1
H =7,02 × 100 = 8,65%
81,1Element g per 100g n = m/M
for 100gn = m/M
for 81,1gSimplest Ratio C 74,04 n = 74,04
12
= 6,1760,07 = 5
125 N 17,28 n = 17,27
14
=1,2314,01 = 1
141 H 8,65 n = 8,65
1
= 8,657,02 = 7
17
Empirical formula of nicotine is C5NH7 (13)
2. Now calculate the molar mass of the substance using empirical formula
- M(C5NH7) = 81 g/mol
x(81) = 162,2
x = 2 (meaning every atom in the empirical formula must be multiplied by 2)
Molecular formula of nicotine is C10N2H14 (4) [17]