MATHEMATICAL LITERACY PAPER 1 GRADE 12 QUESTIONS - NSC PAST PAPERS AND MEMOS MAY/JUNE 2019
Share via Whatsapp Join our WhatsApp Group Join our Telegram GroupMATHEMATICAL LITERACY PAPER 1
GRADE 12
NATIONAL SENIOR CERTIFICATE EXAMINATIONS
MAY/JUNE 2019
INSTRUCTIONS AND INFORMATION
- This question paper consists of FIVE questions. Answer ALL the questions.
- 2.1 Use the ANNEXURES in the ADDENDUM to answer the following questions:
ANNEXURE A for QUESTION 1.1
ANNEXURE B for QUESTION 2.1.4
ANNEXURE C for QUESTION 4.2
2.2 Answer QUESTION 2.2.3 on the attached ANSWER SHEET 1.
Answer QUESTION 5.1.8 on the attached ANSWER SHEET 2.
2.3 Write your centre number and examination number in the spaces on the ANSWER SHEET. Hand in the ANSWER SHEET with your ANSWER BOOK. - Number the answers correctly according to the numbering system used in this question paper.
- Start EACH question on a NEW page.
- You may use an approved calculator (non-programmable and non-graphical), unless stated otherwise.
- Show ALL calculations clearly.
- Round off ALL final answers appropriately according to the given context, unless stated otherwise.
- Indicate units of measurement, where applicable.
- Maps and diagrams are NOT necessarily drawn to scale, unless stated otherwise.
- Write neatly and legibly.
QUESTION 1
1.1 ANNEXURE A shows a revolving credit loan taken out from Woolworths Financial Services.
NOTE: A revolving credit plan is a loan where a person can re-use all or part of the money that has been paid back towards the loan without applying for it again.
Use ANNEXURE A to answer the questions that follow.
1.1.1 Identify the borrower of the revolving credit loan. (2)
1.1.2 Write down the loan amount available on this statement. (2)
1.1.3 Write down the number of statements the borrower will receive in ONE year. (2)
1.1.4 Explain the term debit order. (2)
1.1.5 Calculate the number of days from the statement date to the payment due date. (2)
1.1.6 Calculate the closing balance (A) of the loan taken on 29/04/2016. (2)
1.2 The weather forecast for Cape Town for the period 1 to 9 June 2017 is shown below.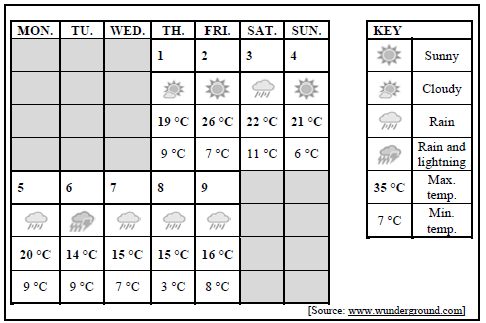
Study the information above and answer the questions that follow.
1.2.1 Identify the maximum temperature for Friday 2 June 2017. (2)
1.2.2 Write down the full date on which the lowest minimum temperature was measured. (2)
1.2.3 Arrange the maximum temperatures in descending order. (2)
1.2.4 Determine the date when there was rain and lightning. (2)
1.2.5 Determine the difference between the maximum and minimum temperatures on Thursday 8 June 2017. (2)
1.3 The comparative bar graph shows the national registration statistics of the population of South Africa for both male and female as at 28 April 2018.
NATIONAL REGISTRATION STATISTICS AS AT 28 APRIL 2018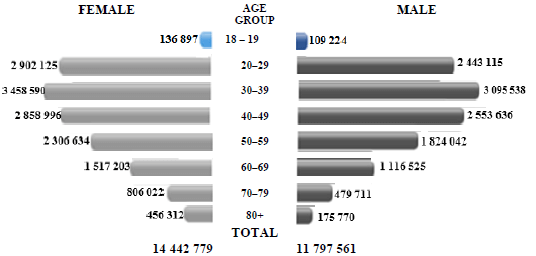
Study the graph above and answer the questions that follow.
1.3.1 Write down the age group in which the second highest number of female voters have registered. (2)
1.3.2 Calculate the number of male voters under the age of 40 years. (2)
1.3.3 Write down, in words, the number of female voters in the 40–49 age group. (2)
1.3.4 State whether the data in the graph is discrete or continuous. (2)
1.3.5 Calculate the difference between the total number of male and female voters. (2)
[32]
QUESTION 2
2.1 Susan intends selling cups of Milo at the local taxi rank for extra money. Milo is a nutritious supplementary drink developed to provide active people with key vitamins and minerals.
ANNEXURE B shows the advertisement from her local store where she intends to buy her stock.
Use ANNEXURE B to answer the questions that follow.
2.1.1 Determine the unit price when purchasing Milo option 2. (3)
2.1.2 Determine the total cost of 6 ℓ of milk. (2)
2.1.3 Explain the meaning of the word cost price. (2)
2.1.4 Susan decided to exclude the cost of water when calculating the cost price per cup of Milo.
TABLE 1 below shows how Susan calculated the cost price of ONE cup of Milo.
TABLE 1:
| QUANTITY BOUGHT | COST OF INGREDIENTS | AMOUNT USED FOR ONE CUP | COST PER CUP OF MILO |
| 1 kg Milo | R97,95 | 0,04 kg | A |
| 1 ℓ milk | R11,99 | B | R1,20 |
| 2,5 kg sugar | R33,20 | 0,01 kg | R0,13 |
| 25 foam cups | C | ONE | R1,78 |
| 50 spoons | R12,75 | ONE | R0,26 |
| TOTAL COST | D | ||
- Calculate A, the cost of Milo per cup. (2)
- Determine B, the amount of milk, in litres, used for ONE cup of Milo. (2)
- Write down the value of C, the cost of 25 foam cups. (2)
- Show that the cost of ONE cup of Milo, D, is R7,29. (2)
2.1.5 Determine the selling price of ONE cup of Milo if Susan's intended profit margin is 25%. (4)
2.2 Susan started her business one month later and because of the price increase of products, it then cost her R9,50 to make ONE cup of Milo. She calculated that the daily fixed cost was R90,00 and she would be able to sell 100 cups of Milo per day. She will sell the Milo at R12,50 per cup.
Use the information above to answer the questions that follow.
2.2.1 TABLE 2 shows the income from the sale of cups of Milo.
TABLE 2: INCOME FROM THE SALE OF CUPS OF MILO
| Number of cups of Milo (n) | 0 | 20 | 30 | 40 | 80 | 100 |
| Income in rand (R) | 0 | 250 | 375 | P | 1000 | 1250 |
- Determine the value of P in TABLE 2 above. (2)
- Write down an equation that can be used to calculate the income. (2)
- Identify the independent variable in TABLE 2. (2)
2.2.2 Susan uses the following formula to determine the cost price of the cups of Milo.
Cost = R90,00 + R9,50 × n where n = number of cups of Milo
TABLE 3 shows the cost price for a number of cups of Milo.
TABLE 3: COST PRICE OF A NUMBER OF CUPS OF MILO
| Number of cups of Milo (n) | 0 | 20 | 30 | Q | 80 | 100 |
| Cost price in rand (R) | 90 | 280 | 375 | 612.50 | 850 | 1040 |
Calculate the value of Q in TABLE 3 above. (3)
2.2.3 The graph on ANSWER SHEET 1 shows the total income for making up to 100 cups of Milo. Use the information in TABLE 3 to draw another graph representing the cost from the selling of up to 100 cups of Milo. (3)
2.2.4 Use the tables or graphs on ANSWER SHEET 1 to answer the following questions.
- Explain the meaning of the word break-even in the context of the question. (2)
- Determine the number of cups of Milo at the break-even point. (2)
2.3 Susan decides to send R1 200 to her sister who is studying in Japan. The exchange rate on that date is 1 yen = R0,10976
2.3.1 Calculate the amount of money she sends in Japanese yen. (3)
2.3.2 State whether the yen is stronger or weaker than the rand. (2)
[40]
QUESTION 3
3.1 The Bambanani Crèche in Bethlehem bought the cubic blocks below from an auction. They have a side length of 45 cm. On two opposite sides of the block is a circular hole in the face of the block. They want to use the blocks as chairs for the children.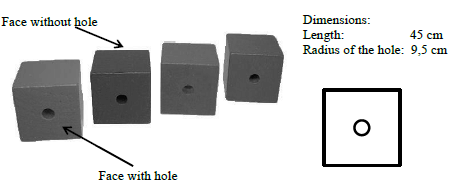
3.1.1 They intend painting the chairs green with Dulux all-purpose paint.
- Calculate the area (in cm2) of ONE of the faces of the block that does not have a circular hole.
You may use the following formula:
Area of square = side × side (3) - Show that the total surface area (area of the faces with circular holes + area of the faces without circular holes) = 11 582,869 cm2.
You may use the following formula:
Area of circle = π × radius2, and using π = 3,142 (5) - The paint has a spread rate of 1,8 mℓ of paint per 15 cm2.
Calculate the total amount of paint, rounded to the nearest litre, needed to paint 12 chairs with ONE coat of paint. (4)
3.1.2 The paint is sold in 5 ℓ tins.
Each tin has a radius of 7 cm and a height of 35 cm.
5 ℓ = 5 000 cm3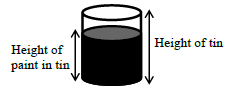
- Write down the diameter of the tin. (2)
- Calculate the height of the paint in the tin:
You may use the following formula:
Volume of a cylinder = π × (radius)2 × height, where π = 3,142 (3)
3.2 The waist-to-hip ratio (WHR) is another way of determining the disease risk related to obesity.
You may use the following formula: Waist-to-hip ratio = waistmeasurement
hipmeasurement
Once the calculation is done, a person's disease risk related to obesity is classified as low, moderate, high or very high, based on their age.
DISEASE RELATED TO OBESITY
| AGE GROUP | CLASSIFICATION | ||||
| (YEARS) | LOW | MODERATE | HIGH | VERY HIGH | |
| MEN | 20–29 | <0,83 | 0,83–0,88 | 0,89–0,94 | >0,94 |
| 30–39 | <0,84 | 0,84–0,91 | 0,92–0,96 | >0,96 | |
| 40–49 | <0,88 | 0,88–0,95 | 0,96–1,00 | >1,00 | |
| 50–59 | <0,90 | 0,90–0,96 | 0,97–1,02 | >1,02 | |
| 60–69 | <0,91 | 0,91–0,98 | 0,99–1,03 | >1,03 | |
| WOMEN | 20–29 | <0,71 | 0,71–0,77 | 0,78–0,82 | >0,82 |
| 30–39 | <0,72 | 0,72–0,78 | 0,79–0,84 | >0,84 | |
| 40–49 | <0,73 | 0,73–0,79 | 0,80–0,87 | >0,87 | |
| 50–59 | <0,74 | 0,74–0,81 | 0,82–0,88 | >0,88 | |
| 60–69 | <0,76 | 0,76–0,83 | 0,84–0,90 | >0,90 | |
Use the information above to answer the questions that follow.
3.2.1 Determine if a 37-year-old man with a WHR of 0,95 has a moderate or a high risk of obesity. (2)
3.2.2 A 50-year-old man has the following measurements: waist = 105 cm ; hip = 92 cm
Calculate this man's WHR. (2)
3.2.3 A woman with a waist of 72 cm has a WHR equal to 0,7826 and is classified as a moderate risk.
- State ONE possible age group of this woman. (2)
- Calculate the woman's hip measurement. Round off your answer to the nearest cm. (3)
[26]
QUESTION 4
4.1 The seating plan below represents the seating arrangement in a coach of a train.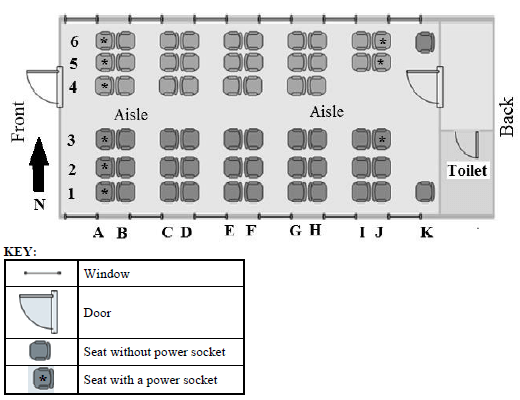
Use the information above to answer the questions that follow.
4.1.1 How many passengers can be seated in ONE coach? (2)
4.1.2 Write down the number of the seat close to the window and the toilet. (2)
4.1.3 In which general direction is the toilet from seat B6? (2)
4.1.4 Determine the probability (as a percentage) of randomly selecting a seat with a power point in this coach. (3)
4.1.5 A man seated on seat J2 uses the following route to move to another seat:
- From J2 turn left and walk towards the aisle
- He turns left and continue straight until he reaches the front of the coach
- He then turns right and sits in the middle seat
Write down his new seat number. (2)
4.2 ANNEXURE C shows the map representing the routes of a South African bus company.
Use ANNEXURE C to answer the questions that follow.
4.2.1 How many airports are along the bus routes? (2)
4.2.2 Explain the meaning of the given scale. (2)
4.2.3 Calculate the actual distance, in km, from Mossel Bay to East London if the distance on the map is 60 mm. (3)
4.2.4 The bus took 7 hours 26 min to travel from Bloemfontein to Grahamstown.
Calculate the average speed (in km/hour) the bus travelled if the distance from Bloemfontein to Grahamstown is 597 km.
You may use the following formula:
Speed =Distance
Time (3)
[21]
QUESTION 5
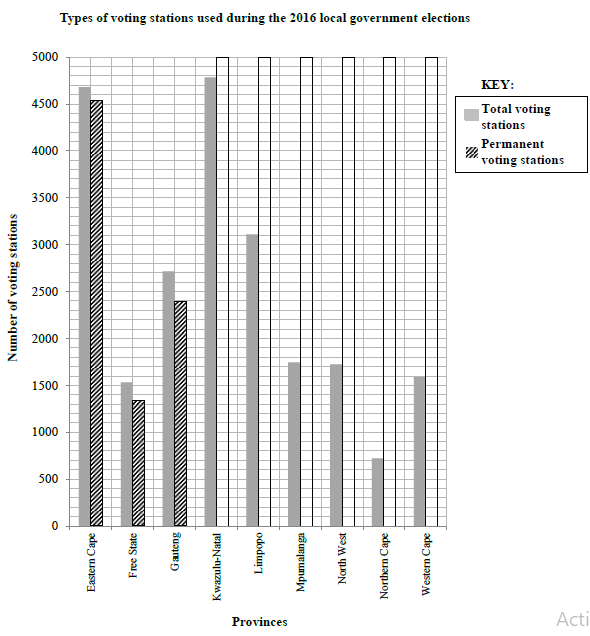
5.1 TABLE 4 shows the types of voting stations (VSs) used during the 2016 local government elections in South Africa.
TABLE 4: TYPES OF VOTING STATIONS
| PROVINCE | VSs | PERMANENT | TEMPORARY | MOBILE |
| Eastern Cape | 4 699 | 4 535 | 161 | 3 |
| Free State | 1 531 | 1 342 | 189 | 0 |
| Gauteng | 2 716 | 2 389 | 327 | 0 |
| KwaZulu-Natal | 4 792 | 4 647 | 133 | 12 |
| Limpopo | 3 111 | 2 966 | 145 | 0 |
| Mpumalanga | 1744 | 1650 | 82 | 12 |
| North West | 1723 | 1605 | 115 | 3 |
| Northern Cape | 710 | 684 | 26 | 0 |
| Western Cape | 1586 | 1534 | 50 | 2 |
| TOTAL | 22612 | 21352 | 1228 | 32 |
5.1.1 Name a type of instrument used to collect this data. (2)
5.1.2 State the province which has the most voting stations. (2)
5.1.3 Determine the mean number of voting stations (VSs) in South Africa. (3)
5.1.4 Write down the modal number of mobile voting stations in South Africa. (2)
5.1.5 Determine the total number of temporary VSs as a percentage of the total number of VSs in South Africa. (3)
5.1.6 Determine the probability of randomly selecting a mobile VS in Gauteng. (2)
5.1.7 Show how the value of 145 was calculated. (2)
5.1.8 The bar graph on ANSWER SHEET 2 shows the total number of voting stations.
On the same ANSWER SHEET, the first three bars are drawn showing the permanent voting stations.
Fill in the remaining bar graphs showing the permanent voting stations. (6)
5.2 The TWO pie charts below show why and how people in South Africa travel.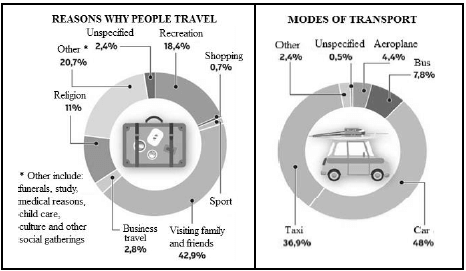
Study the TWO pie charts above and answer the questions that follow.
5.2.1 Calculate the percentage of people whose reason for travel is sport. (2)
5.2.2 Which mode of transport is used by most people? (2)
5.2.3 Determine the probability (written as a fraction in its simplest form) of randomly selecting a person whose mode of transportation is travelling by bus. (3)
5.2.4 A total of 542 267 people took part in this survey.
Calculate the number of people who travel to visit family and friends. (2)
[31]
ANSWER SHEET 1
QUESTION 2.2.3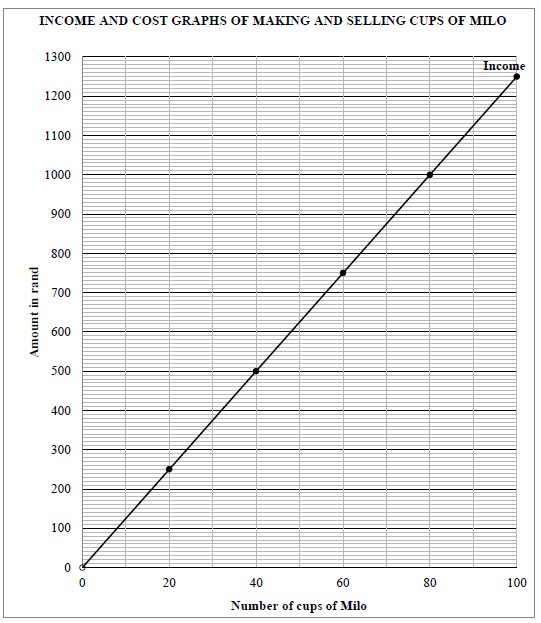
ANSWER SHEET 2
QUESTION 5.1.8