MATHEMATICAL LITERACY PAPER 2 GRADE 12 QUESTIONS - NSC PAST PAPERS AND MEMOS MAY/JUNE 2019
Share via Whatsapp Join our WhatsApp Group Join our Telegram GroupMATHEMATICAL LITERACY PAPER 2
GRADE 12
NATIONAL SENIOR CERTIFICATE EXAMINATIONS
MAY/JUNE 2019
INSTRUCTIONS AND INFORMATION
- This question paper consists of FIVE questions. Answer ALL the questions.
- 2.1 Use the ANNEXURES in the ADDENDUM to answer the following questions:
ANNEXURE A for QUESTION 4.1
ANNEXURE B for QUESTION 5.1
2.2 Answer QUESTION 3.1.4 on the attached ANSWER SHEET.
2.3 Write your centre number and examination number in the spaces on the ANSWER SHEET. Hand in the ANSWER SHEET with your ANSWER BOOK. - Number the answers correctly according to the numbering system used in this question paper.
- Start EACH question on a NEW page.
- You may use an approved calculator (non-programmable and non-graphical), unless stated otherwise.
- Show ALL calculations clearly.
- Round off ALL final answers appropriately according to the given context, unless stated otherwise.
- Indicate units of measurement, where applicable.
- Maps and diagrams are NOT drawn to scale, unless stated otherwise.
- Write neatly and legibly.
QUESTION 1
1.1 The Western Cape water crisis began in 2015 resulting in a severe water shortage in Cape Town.
Hence the province declared Level 6B water restrictions. Level 6B recommends a daily limit of 50 litres per person.
TABLE 1 below is a guide on maximum household water consumption.
TABLE 1: Maximum household water consumption guide
| NUMBER OF OCCUPANTS PER HOUSEHOLD | MAXIMUM LITRES PER DAY | MAXIMUM LITRES PER MONTH |
| 1 | 50 | 1500 |
| 2 | 100 | 3000 |
| 6 | 300 | 9000 |
| 8 | 400 | 12000 |
| A | 750 | 22500 |
| 30 | 1500 | 45000 |
| 50 | 2500 | B |
Use the information above to answer the questions that follow.
1.1.1 Calculate the missing values A and B. (4)
1.1.2 Theo stated that the approximate litres per month were calculated for the number of days in July.
Verify, showing ALL calculations, whether this statement is valid. (3)
1.1.3 If you have more than FOUR occupants living on your property, you need to apply for an increase in your water quota.
- One occupant more than four – an additional 5% is allowed on the maximum litres per day.
- Two occupants more than four – an additional 10% is allowed on the maximum litres per day.
- Three or more occupants more than four – an additional 20% is allowed on the maximum litres per day.
- Mr and Mrs Vellem, their four children, two grandchildren and Mr Vellem's mother and father all live on the Vellem property.
Calculate (in kilolitres) the maximum volume of water the Vellem household can use in May 2018. (7) - TABLE 2 below shows the stepped water tariff rates (sliding scale) for residential properties in Cape Town. As from 1 February 2018 level 6 tariffs were charged.
TABLE 2: Stepped water tariff rates (sliding scale) for residential households in Cape Town
Use the table to calculate the amount a household will have to pay for consuming 15,3 kℓ. (6)STEP VOLUME OF WATER USED
(1 kℓ = 1 000 LITRES)LEVEL 4
R/kℓ
(INCLUDING VAT)LEVEL 6
R/kℓ
(INCLUDING VAT)1 more than 0 kℓ to 6 kℓ R4,65 R29,93 2 above 6 kℓ to 10,5 kℓ R17,75 R52,44 3 above 10,5 kℓ up to 20 kℓ R25,97 R114,00 4 above 20 kℓ up to 35 kℓ R43,69 R34,00 5 above 35 kℓ up to 50 kℓ R113,99 R912,00 6 more than 50 kℓ R302,24 R912,00 - State ONE possible way a household can save water. (2)
1.2 Mr Vellem tries to minimize his usage of municipal water and plans to install a Jojo tank to collect rainwater.
A local supplier gave the following quotation to install a Jojo tank:
| LOCAL HANDYMAN JOE PO Box 4652 Brackenfell | ||
| ITEM | QUANTITY | UNIT PRICE |
| Jojo tank | 1 | R12 958,00 |
| Other materials | 1 | R1 943,70 |
| Labour per hour or part thereof | R129,99 | |
He found out that the installation will take 5 hours 10 minutes on the first day and then 2 hours on the second day.
Mr.Vellem has a total budget of R15 900 to buy and install the tank.
Verify, using calculations, whether the budget will be enough. (6)
[28]
QUESTION 2
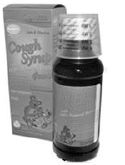
2.1 During winter many children develop coughs. Cough syrups are sold in bottles packed in rectangular prism-shaped boxes.
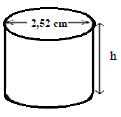
Children are given cough syrup using a cylindrical measuring cup.
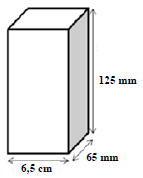
The diagrams below show the bottle, the box and the measuring cup.
| PICTURE OF A COUGH SYRUP BOX AND A BOTTLE OF SYRUP | DIMENSIONS OF A RECTANGULAR COUGH SYRUP BOX | SKETCH OF A CYLINDRICAL MEASURING CUP |
 |  |  |
Total surface area of a rectangular prism:
= 2(length × width) + 2(length × height) + 2(width ×height)
Volume of a rectangular prism = length × width × height
Total surface area of cylinder = (2π × radius2) + (2π × radius × height)
Volume of a cylinder = π × radius2 × height
Use: π = 3,142
1mℓ = 1 cm3
Use the information above to answer the questions that follow.
2.1.1 Consider the cough syrup box.
- Calculate (in cm3) the total surface area of the cough syrup box. (4)
- Give a practical reason why a cartoon picture would feature on the box of the cough syrup for children. (2)
2.1.2 Calculate (in cm) the height of the medicine measuring cup if the diameter is 2,52 cm and the volume is 10 mℓ. (4)
2.2 The pharmacy received the following order of cough syrup:
- 5 large cartons of cough syrup
- Each carton is packed with 4 layers of cough syrup boxes
- Each layer has 8 rows of cough syrup boxes
- Each row has 6 boxes of cough syrup
Calculate the total number of cough syrup boxes the pharmacist received. (4)
2.3 Whooping cough affects the chest and nose and is characterised by a cough that makes a 'whoop' sound.
TABLE 3 below shows data about the reported cases of whooping cough and the percentage of hospitalisation per age group. Some data has been omitted and some reported cases did not indicate the patients' ages.
TABLE 3: Reported whooping cough cases and percentage hospitalised by age group.
| AGE GROUP | NUMBER OF CASES PER AGE GROUP | AGE INCIDENCE PER 100 000 | HOSPITALISED PER AGE GROUP (%) |
| Less than 6 months | 1 280 | 64,5 | 44,2 |
| 6–11 months | 612 | 30,8 | 11,5 |
| 1–6 years | 3 051 | 12,7 | 2,8 |
| 7–10 years | 2 221 | 13,5 | 1 |
| 11–19 years | N | 13,7 | 0,9 |
| 20+ years | 3 429 | 1,4 | 7,6 |
| Unknown age | 76 | N/A | N/A |
| TOTAL | _____ | 4,9 | 6,6 |
Use the information above to answer the questions that follow.
2.3.1 N represents the highest number of whooping cough cases for the known age groups. The range for the number of whooping cough cases for the known age groups is 4 527.
Determine the value of N. (4)
2.3.2 Determine the interquartile range (only known age groups) for the reported number of whooping cough cases per age group. (5)
2.3.3 It was stated that the unknown age group makes up 0,5% of the total number of reported cases for whooping cough.
Explain, by means of calculations, why this statement is CORRECT. (5)
2.3.4 Calculate the difference between the number of cases that were hospitalised in the age group less than 6 months and the age group 20+ years. (4)
[32]
QUESTION 3
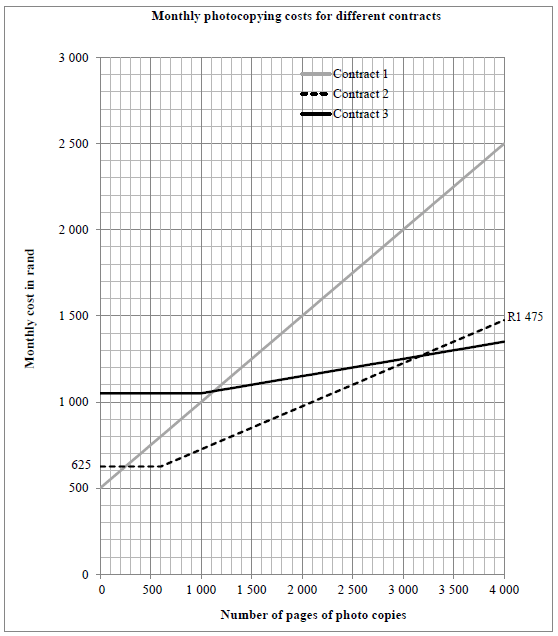
3.1 Pro-Print hires out photocopying machines and offers three contract options. The three contract options are shown in the graph on the ANSWER SHEET.
Use the information in the ANSWER SHEET to answer the questions that follow.
3.1.1 Write down the number of pages at the point where Contract 2 and Contract 3 cost the same. (2)
3.1.2 Academy School makes 1 500 copies per month.
Determine which contract will be the cheapest option. (2)
3.1.3 Use the graph on the ANSWER SHEET to determine a formula for calculating the total cost (in rand) for contract 2. (5)
3.1.4 Copy King charges a rate of R0,70 per copy for hiring their copying machine with no other costs.
Draw on the same grid on the ANSWER SHEET another line graph to show the costs charged by Copy King. (3)
3.2 The layout plan of the copy room at Academy School is given below.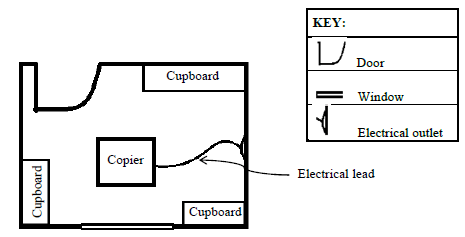
Justify, with a reason, whether or not the copier is suitably placed in the room. (3)
3.3 Scaled models of vehicles are available for collectors.
A model of a Mercedes Benz truck was constructed using a scale of 1 : 50.
Picture and information of a model of a Mercedes Benz truck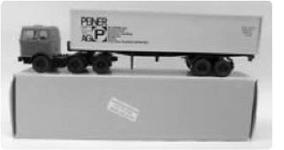
Price: A$45 (cost price, excluding import taxes)
Model of a Mercedes Benz 14313 vintage truck
Scale 1 : 50
Use the information above to answer the questions that follow.
3.3.1 The length of the truck in the picture is 76 mm. However, the copy of the picture was reduced by 58,5%.
Calculate (in metres) the actual length of the truck. (5)
3.3.2 Layla stated that the total cost of the 300 model trucks she intends to import is R159 778,70, including import taxes.
Verify, showing ALL calculations, whether her statement is CORRECT.
Use the following information:
1A$ = R9,41564, where A$ represents Australian dollar.
Import taxes = VAT (15%) on the cost price in rand + import duties (4,7%) on the cost price in rand. (6)
[26]
QUESTION 4
4.1 Welkom is a town in the Free State. ANNEXURE A is a road map showing part of the streets in Welkom. The town is known for having many traffic circles.
Use the information in ANNEXURE A to answer the questions that follow.
4.1.1 Write down the general direction of the Concor circle from the Shell circle. (2)
4.1.2 A railway line passes through Milner Road, Othello, Arrarat and Koppie Alleen Streets.
Explain how it is shown on the map that the road is actually situated above the railway line. (2)
4.1.3 Name the traffic circle that connects FIVE roads. (2)
4.1.4 Describe the route that will be taken by a car entering the town on Stateway from the industrial area if it will be heading to the point in Dagbreek, marked X, passing by the city council building on the left. (5)
4.1.5 The actual distance from exiting the Alfa circle to entering the Engen circle is 500 m. The actual distance from exiting circle 13 to entering circle 14 in Stateway is 1,4 km.
Determine, by measurement, whether the map is drawn to scale. (5)
4.1.6 Samuel stated that it took him 5 minutes to cover a distance of 4 km in Welkom.
Verify, with calculation, whether the car was travelling within the speed limit.
You may use the formula:
Distance = Speed × Time (4)
4.1.7 The same painters must repaint all the road markings at all the traffic circles in Welkom.
Lethu says the probability that the painters are at a circle in Stateway is 0,15.
Verify whether her statement is valid. (4)
4.2 The accelerated schools infrastructure delivery initiative (ASIDI) of the Department of Education was created to renovate schools so that they are conducive to learning.
TABLE 4 shows a summary of the completed renovated projects per province.
TABLE 4: Completed ASIDI renovated projects per province
| PROBLEMS AT THE SCHOOL | |||||
| PROVINCE | INAPPROPRIATE STRUCTURES | WATER | SANITATION | ELECTRICAL | TOTAL NUMBER OF PROJECTS |
| Eastern Cape | 145 | 271 | 171 | 202 | 789 |
| Free State | 21 | 53 | 12 | 50 | 136 |
| Gauteng | 0 | 0 | 14 | 2 | 16 |
| KwaZulu-Natal | 1 | 206 | 103 | 58 | 368 |
| Limpopo | 3 | 104 | 88 | 5 | 200 |
| Mpumalanga | 5 | 36 | 38 | 45 | 124 |
| North West | 2 | 3 | 10 | 0 | 15 |
| Northern Cape | 1 | 5 | 13 | 2 | 21 |
| Western Cape | 25 | 3 | 19 | 8 | 55 |
| TOTAL | 203 | 681 | 468 | 372 | 1724 |
Use the information in the table above to answer the questions that follow.
4.2.1 Write down, in simplified form, the ratio of water projects to sanitation projects in Limpopo. (3)
4.2.2 Determine, as a decimal, the probability of randomly selecting a renovation project that successfully completed inappropriate structures. (3)
4.2.3 Determine, to the nearest percentage, the probability of randomly selecting a completed project at a school in KwaZulu Natal that did NOT have electric repairs. (4)
[34]
QUESTION 5
5.1 When a person buys an asset he can insure this asset against loss or damage. If this asset is lost or damaged the person may claim from the insurance company. In some cases the insurance company may not pay out the claim. In this case the person can contact the ombudsman (a legally appointed person) who will act on behalf of the person to assess if the claim is valid.
ANNEXURE B shows information regarding the value of insurance claims in favour of persons who had valid claims (with the ombudsman) during 2015 to 2017.
Use the information in ANNEXURE B to answer the questions that follow.
5.1.1 Determine (to the nearest million rand) the value of motor claims in 2015. (3)
5.1.2 Calculate the difference in the total value of valid cases from 2016 to 2017. (5)
5.1.3 Determine the percentage difference in the rand value for the complaints resolved in favour of the home owner claims from 2015 to 2017 (4)
5.1.4 Sannie stated that the pie chart for 2015 did not reflect the correct values, since the household and other claims showed the same percentage while the rand values in the tables differed.
- Verify, showing ALL calculations, whether her statement is valid. (5)
- Give ONE reason why the percentages would be shown as the same. (2)
5.1.5 Determine the average amount that was paid out to each insured home owner in 2017 if 14,0858% of the 2 144 claims received were successful. (4)
5.1.6 Describe the trend in the percentage resolved commercial claims from 2015 to 2017. (2)
5.2 The average time it took for a claim, to be processed from registration to final decision was 131 days in 2017.
Mr Hesse stated that his claim which was registered on 10 July 2017 with a final decision reached on 3 November 2017, exceeded the average number of days.
Verify, showing ALL calculations, whether his statement is valid. (3)
5.3 Give ONE reason why insurance companies sometimes refuse to pay out a claim even though the item may be insured. (2)
[30]
TOTAL: 150
ANSWER SHEET
QUESTION 3.1