MATHEMATICS PAPER 2 GRADE 12 QUESTIONS - NSC EXAMS PAST PAPERS AND MEMOS NOVEMBER 2018
Share via Whatsapp Join our WhatsApp Group Join our Telegram GroupMATHEMATICS
PAPER 2
GRADE 12
NSC EXAMS
PAST PAPERS AND MEMOS NOVEMBER 2018
INSTRUCTIONS AND INFORMATION
Read the following instructions carefully before answering the questions.
- This question paper consists of 10 questions.
- Answer ALL the questions in the SPECIAL ANSWER BOOK provided.
- Clearly show ALL calculations, diagrams, graphs, etc. which you have used in determining your answers.
- Answers only will NOT necessarily be awarded full marks.
- You may use an approved scientific calculator (non-programmable and non-graphical), unless stated otherwise.
- If necessary, round off answers correct to TWO decimal places, unless stated otherwise.
- Diagrams are NOT necessarily drawn to scale.
- An information sheet with formulae is included at the end of the question paper.
- Write neatly and legibly.
QUESTIONS
QUESTION 1
1.1 The cumulative frequency graph (ogive) drawn below shows the total number of food items ordered from a menu over a period of 1 hour.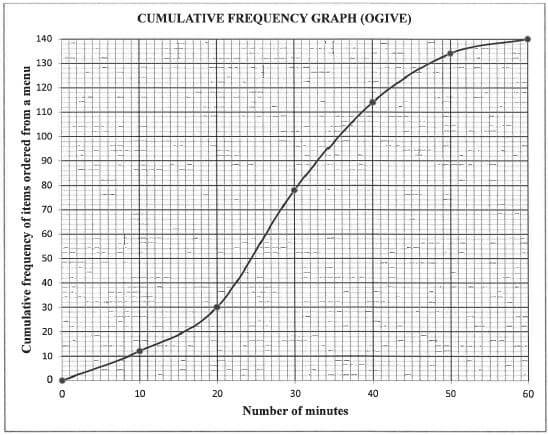
1.1.1 Write down the total number of food items ordered from the menu during this hour. (1)
1.1.2 Write down the modal class of the data. (1)
1.1.3 How long did it take to order the first 30 food items? (1)
1.1.4 How many food items were ordered in the last 15 minutes? (2)
1.1.5 Determine the 75th percentile for the data. (2)
1.1.6 Calculate the interquartile range of the data. (2)
1.2 Reggie works part-time as a waiter at a local restaurant. The amount of money (in rands) he made in tips over a 15-day period is given below.
| 35 | 70 | 75 | 80 | 80 |
| 90 | 100 | 100 | 105 | 105 |
| 110 | 110 | 115 | 120 | 125 |
1.2.1 Calculate:
- The mean of the data (2)
- The standard deviation of the data (2)
1.2.2 Mary also works part-time as a waitress at the same restaurant. Over the same 15-day period Mary collected the same mean amount in tips as Reggie, but her standard deviation was R14. Using the available information, comment on the:
- Total amount in tips that they EACH collected over the 15-day period (1)
- Variation that EACH of them received in daily tips over this period (1) [15]
QUESTION 2
A familiar question among professional tennis players is whether the speed of a tennis serve (in km/h) depends on the height of a player (in metres). The heights of 21 tennis players and the average speed of their serves were recorded during a tournament. The data is represented in the scatter plot below. The least squares regression line is also drawn.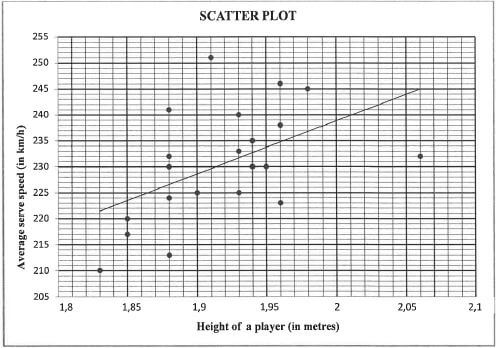
2.1 Write down the fastest average serve speed (in km/h) achieved in this tournament. (1)
2.2 Consider the following correlation coefficients:
A. r = 0,93 B. r = —0,42 C. r = 0,52
2.2.1 Which ONE of the given correlation coefficients best fits the plotted data? (1)
2.2.2 Use the scatter plot and least squares regression line to motivate your answer to QUESTION 2.2.1. (1)
2.3 What does the data suggest about the speed of a tennis serve (in km/h) and the height of a player (in metres)? (1)
2.4 The equation of the regression line is given as y = 27,07 + bx . Explain why, in this context, the least squares regression line CANNOT intersect the y-axis at (0 , 27,07). (1) [51
QUESTION 3
In the diagram, K(-1 ; 2), L and N(1 ; -1) are vertices of AKLN such that LKN = 78,69°. KL intersects the x-axis at P. KL is produced. The inclination of KN is θ. The coordinates of M are (-3 ; -5).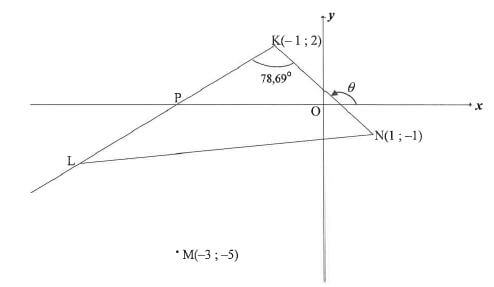
3.1 Calculate:
3.1.1 The gradient of KN (2)
3.1.2 The size of 0, the inclination of KN (2)
3.2 Show that the gradient of KL is equal to 1. (2)
3.3 Determine the equation of the straight line KL in the form y= mx + c. (2)
3.4 Calculate the length of KN. (2)
3.5 It is further given that KN = LM.
3.5.1 Calculate the possible coordinates of L.
3.5.2 Determine the coordinates of L if it is given that KLMN is a parallelogram. (3)
3.6 T is a point on KL produced. TM is drawn such that TM = LM. Calculate the area of ΔKTN. (4) [22]
QUESTION 4
In the diagram, the equation of the circle with centre F is (x - 3)2 + (y - 1)2 = r2. S(6 ; 5) is a point on the circle with centre F. Another circle with centre G(m ; n) in the 4th quadrant touches the circle with centre F, at H such that FH : HG = 1 : 2. The point J lies in the first quadrant such that HJ is a common tangent to both these circles. JK is a tangent to the larger circle at K.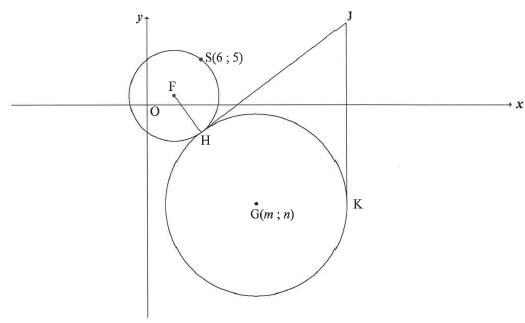
4.1 Write down the coordinates of F. (2)
4.2 Calculate the length of FS. (2)
4.3 Write down the length of HG. (1)
4.4 Give a reason why JH = JK. (1)
4.5 Determine:
4.5.1 The distance FJ, with reasons, if it is given that JK = 20 (4)
4.5.2 The equation of the circle with centre G in terms of m and n in the form (x - a)2 (y - b)2 =r2 (1)
4.5.3 The coordinates of G, if it is further given that the equation of tangent JK is x = 22 (7) [18]
QUESTION 5
5.1 In the diagram, P(k ; 1) is a point in the 2nd quadrant and is √5 units from the origin. R is a point on the positive x-axis and obtuse ROP = θ.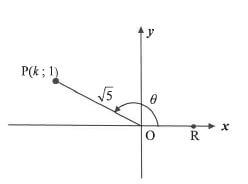
5.1.1 Calculate the value of k. (2)
5.1.2 Without using a calculator, calculate the value of:
- tan θ
- cos(180° + θ)
- sin(θ+ 60°) in the form a + b (2)
√20
5.1.3 Use a calculator to calculate the value of tan(2θ - 40°) correct to ONE decimal place. (3)
5.2 Prove the following identity: cos x + sin x - cos x - sin x = 2 tan 2x (5)
cos x - sin x cos x + sin x
5.3 Evaluate, without using a calculator:  (5) [23]
QUESTION 6
Consider: f (x) = -2 tan x 3 x
2
6.1 Write down the period of f . (1)
6.2 The point A( t ; 2) lies on the graph. Determine the general solution of t. (3)
6.3 On the grid provided in the ANSWER BOOK, draw the graph of f for the interval x ε[-120° ; 180°]. Clearly show ALL asymptotes, intercepts with the axes and endpoint(s) of the graph. (4)
6.4 Use the graph to determine for which value(s) of x will f (x) 2 for x ε[ [-120° ; 180°]. (3)
6.5 Describe the transformation of graph f to form the graph of g(x)= -2 tan (3 x + 60°) (2) [13]
2
QUESTION 7
A pilot is flying in a helicopter. At point A, which is h metres directly above point D on the ground, he notices a strange object at point B. The pilot determines that the angle of depression from A to B is 30°. He also determines that the control room at point C is 3h metres from A and BAC = 2x . Points B, C and D are in the same horizontal plane. This scenario is shown in the diagram below.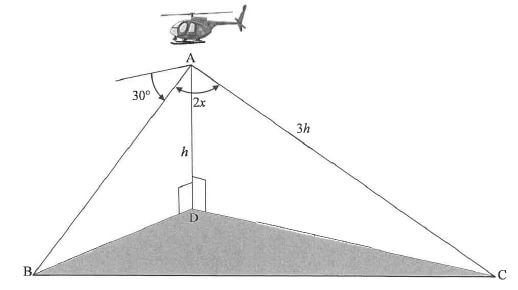
7.1 Determine the distance AB in terms of h. (2)
7.2 Show that the distance between the strange object at point B and the control room at point C is given by ![]() (4) [6]
(4) [6]
QUESTION 8
8.1 PON is a diameter of the circle centred at 0. TM is a tangent to the circle at M, a point on the circle. R is another point on the circle such that OR II PM. NR and MN are drawn. Let M1 = 66° .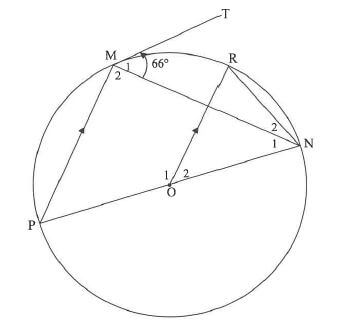
Calculate, with reasons, the size of EACH of the following angles:
8.1.1 P (2)
8.1.2 M2 (2)
8.1.3 N1 (1)
8.1.4 O2 (2)
8.1.5 N2 (3)
\8.2 In the diagram, AAGH is drawn. F and C are points on AG and AH respectively such that AF = 20 units, FG = 15 units and CH = 21 units. D is a point on FC such that ABCD is a rectangle with AB also parallel to GH. The diagonals of ABCD intersect at M, a point on AH.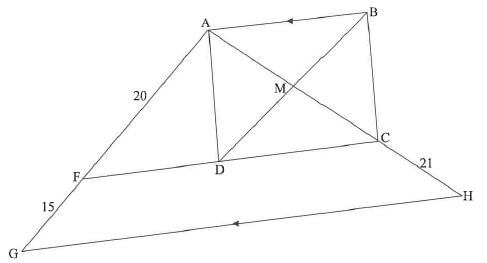
8.2.1 Explain why FC II GH. (1)
8.2.2 Calculate, with reasons, the length of DM. (5) [16]
QUESTION 9
9.1 In the diagram, JKLM is a cyclic quadrilateral and the circle has centre O. Prove the theorem which states that J + L =180°. (5)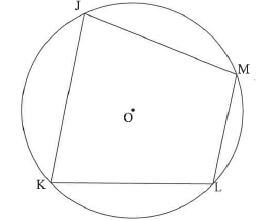
9.2 In the diagram, a smaller circle ABTS and a bigger circle BDRT are given. BT is a common chord. Straight lines STD and ATR are drawn. Chords AS and DR are produced to meet in C, a point outside the two circles. BS and BD are drawn.
A = x and R, = y .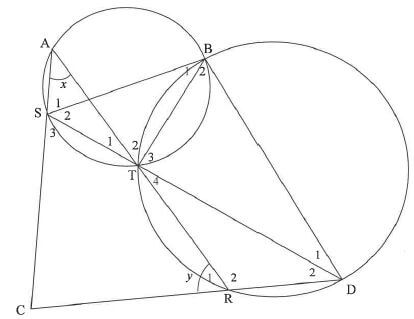
9.2.1 Name, giving a reason, another angle equal to:
- x (2)
- y (2)
9.2.2 Prove that SCDB is a cyclic quadrilateral. (3)
9.2.3 It is further given that D2 = 30° and AST =100°. Prove that SD is not a diameter of circle BDS. (4) [16]
QUESTION 10
In the diagram, ABCD is a cyclic quadrilateral such that AC ⊥ CB and DC = CB. AD is produced to M such that AM ⊥ MC. Let B= x .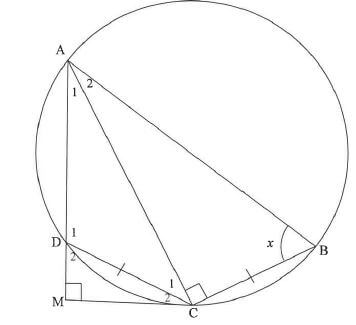
10.1 Prove that:
10.1.1 MC is a tangent to the circle at C (5)
10.1.2 ΔACB III ΔCMD (3)
10.2 Hence, or otherwise, prove that:
10.2.1 CM2 = AM
DC2 AB
10.2.2 AM = sin2x (2) [16]
AB
TOTAL: 150