MATHEMATICS PAPER 2 GRADE 12 QUESTIONS - NSC PAST PAPERS AND MEMOS MAY/JUNE 2019
Share via Whatsapp Join our WhatsApp Group Join our Telegram GroupMATHEMATICS PAPER 2
GRADE 12
NATIONAL SENIOR CERTIFICATE
MAY/JUNE 2019
INSTRUCTIONS AND INFORMATION
Read the following instructions carefully before answering the questions.
- This question paper consists of 10 questions.
- Answer ALL the questions in the SPECIAL ANSWER BOOK provided.
- Clearly show ALL calculations, diagrams, graphs, etc. which you have used in determining your answers.
- Answers only will NOT necessarily be awarded full marks.
- You may use an approved scientific calculator (non-programmable and non-graphical), unless stated otherwise.
- If necessary, round off answers correct to TWO decimal places, unless stated otherwise.
- Diagrams are NOT necessarily drawn to scale.
- An information sheet with formulae is included at the end of the question paper.
- Write neatly and legibly
QUESTION 1
Each child in a group of four-year-old children was given the same puzzle to complete.
The time taken (in minutes) by each child to complete the puzzle is shown in the table below.
TIME TAKEN (t) (IN MINUTES) | NUMBER OF CHILDREN |
| 2 < t ≤ 6 | 2 |
| 6 < t ≤ 10 | 10 |
| 10 < t ≤ 14 | 9 |
| 14 < t ≤ 18 | 7 |
| 18 < t ≤ 22 | 8 |
| 22 < t ≤ 26 | 7 |
| 26 < t ≤ 30 | 2 |
1.1 How many children completed the puzzle?(1)
1.2 Calculate the estimated mean time taken to complete the puzzle.(2)
1.3 Complete the cumulative frequency column in the table given in the ANSWER BOOK(2)
1.4 Draw a cumulative frequency graph (ogive) to represent the data on the grid provided in the ANSWER BOOK(3)
1.5 Use the graph to determine the median time taken to complete the puzzle(2)
[10]
QUESTION 2
Learners who scored a mark below 50% in a Mathematics test were selected to use a computer-based programme as part of an intervention strategy. On completing the programme, these learners wrote a second test to determine the effectiveness of the intervention strategy. The mark (as a percentage) scored by 15 of these learners in both tests is given in the table below.
LEARNER | L1 | L2 | L3 | L4 | L5 | L6 | L7 | L8 | L9 | L10 | L11 | L12 | L13 | L14 | L15 |
TEST 1 (%) | 10 | 18 | 23 | 24 | 27 | 34 | 34 | 36 | 37 | 39 | 40 | 44 | 45 | 48 | 49 |
TEST 2 (%) | 33 | 21 | 32 | 20 | 58 | 43 | 49 | 48 | 41 | 55 | 50 | 45 | 62 | 68 | 60 |
2.1 Determine the equation of the least squares regression line(3)
2.2 A learner's mark in the first test was 15 out of a maximum of 50 marks.
2.2.1 Write down the learner’s mark for this test as a percentage.(1)
2.2.2 Predict the learner's mark for the second test. Give your answer to the nearest integer.(2)
2.3 For the 15 learners above, the mean mark of the second test is 45,67% and the standard deviation is 13,88%. The teacher discovered that he forgot to add the marks of the last question to the total mark of each of these learners. All the learners scored full marks in the last question. When the marks of the last question are added, the new mean mark is 50,67%.
2.3.1 What is the standard deviation after the marks for the last question are added to each learner's total?(2)
2.3.2 What is the total mark of the last question?(2)
QUESTION 3
In the diagram, A, B, C(2 ; –3) and D(–2 ; –5) are vertices of a trapezium with AB || DC. E(–2 ; 0) is the x-intercept of AB. The inclination of AB is a. K lies on the y-axis and KBE = θ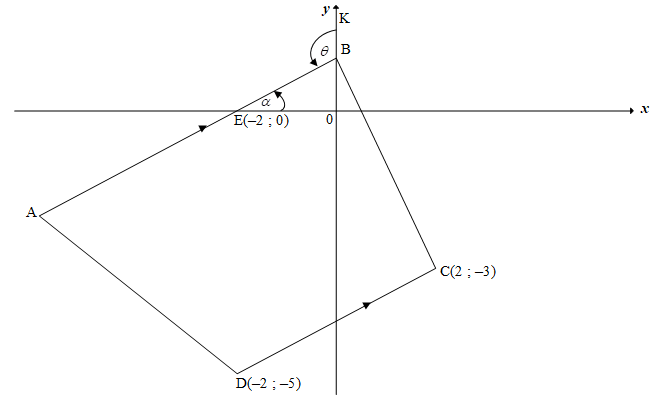
3.1 Determine:
3.1.1The gradient of DC(2)
3.1.2 The midpoint of EC(2)
3.1.3 The equation of AB in the form y= mx + c (2)
3.1.4 The size of θ (3)
3.2 Prove that AB ⊥ BC(3)
3.3 The points E, B and C lie on the circumference of a circle. Determine
3.3.1 The centre of the circle (1)
3.3.2The equation of the circle in the form ( x + a)2 + (y + b)2 = r(4)
[18]
QUESTION 4
In the diagram, the circle is centred at M(2 ; 1). Radius KM is produced to L, a point outside the circle, such that KML || y-axis. LTP is a tangent to the circle at T(–2 ; b). S(-4½; -6) is the midpoint of PK.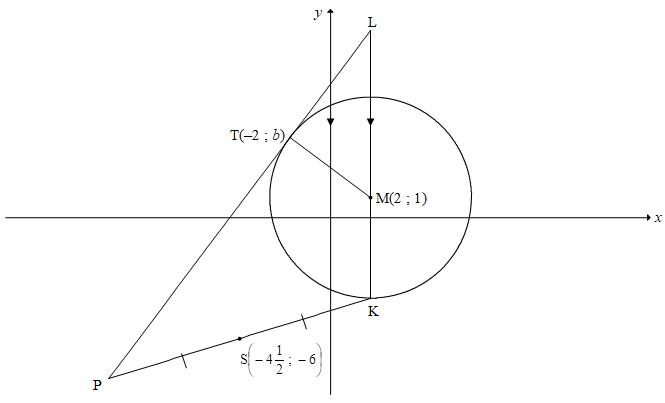
4.1 Given that the radius of the circle is 5 units, show that b = 4
4.2 Determine
4.2.1 The coordinates of K
4.2.2 The equation of the tangent LTP in the form y = mx + c
4.2.3 The area of LPK
4.3 Another circle with equation is drawn. Determine, with an explanation, the value(s) of n for which the two circles will touch each other externally.
QUESTION 5
Without using a calculator, write the following expressions in terms of
5.1.1 sin191º
5.1.2 cos22º
5.2 Simplify to a single trigonometric ratio
5.3 Given: sin P + sin Q = 7/5 and P + Q = 90º
Without using a calculator, determine the value of sin2P
[12]
QUESTION 6
6.1 Determine the general solution of cos(x - 30º) = 2sin x
6.2 In the diagram, the graphs of f(x) = cos (x-30º) and g(x) 2sin x are drawn for the interval x ∈ [-180º;180º]. A and B are the x–intercepts of f. The two graphs intersect at C and D, the minimum and maximum turning points respectively of f.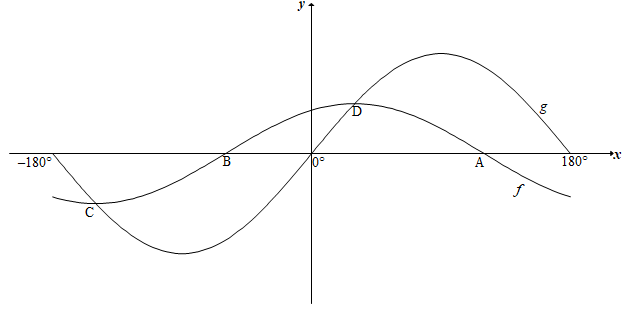
6.2.1 Write down the coordinates of
- A(1)
- C(2)
6.2.2 Determine the values of x in the interval , for which:
- Both graphs are increasing(2)
- f(x + 10º) > g(x + 10º)(2)
6.2.3 Determine the range of y = 22sin x + 3 (5)
[18]
QUESTION 7
In the diagram below, CGFB and CGHD are fixed walls that are rectangular in shape and vertical to the horizontal plane FGH. Steel poles erected along FB and HD extend to A and E respectively. ∆ACE forms the roof of an entertainment centre.
BC = x, CD = x + 2, BAC = θ, ACE = 2θ and ECD = 60º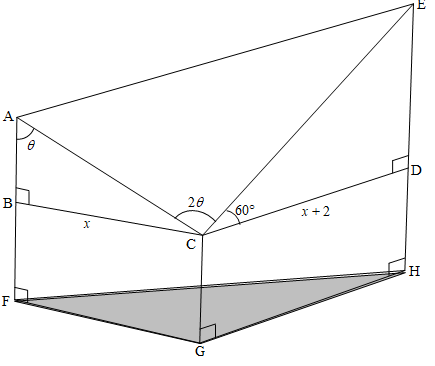
7.1 Calculate the length of:
7.1.1 AC in terms of x and θ
7.1.2 CE in terms of x
7.2 Show that the area of the roof is given by
7.3 If and BC = 12 metres, calculate the length of AE
[11]
QUESTION 8
8.1 In the diagram, O is the centre of the circle and LOM is a diameter of the circle. ON bisects chord LP at N. T and S are points on the circle on the other side of LM with respect to P. Chords PM, MS, MT and ST are drawn. PM = MS and MTS = 31º 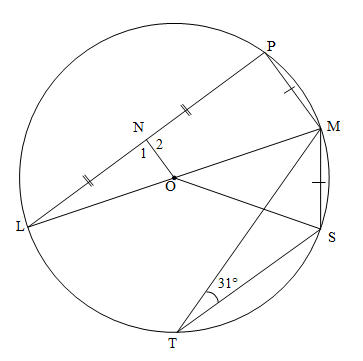
8.1.1 Determine, with reasons, the size of each of the following angles:
- MOS
- L
8.1.2 Prove that ON = ½ MS
8.2 In DABC in the diagram, K is a point on AB such that AK : KB = 3 : 2. N and M are points on AC such that KN || BM. BM intersects KC at L. AM : MC = 10 : 23.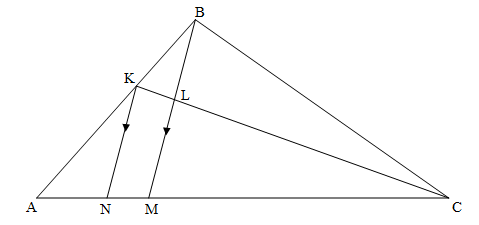
Determine, with reasons, the ratio of:
8.2.1 AN(2)
AM
8.2.2 CL (3)
LK
[13]
QUESTION 9
In the diagram, tangents are drawn from point M outside the circle, to touch the circle at B and N. The straight line from B passing through the centre of the circle meets MN produced in A. NM is produced to K such that BM = MK. BK and BN are drawn.
Let K = x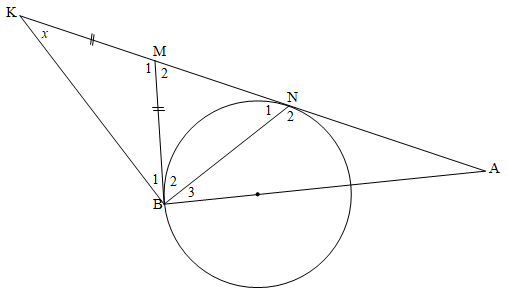
9.1 Determine, with reasons, the size of N1 in terms of x. (6)
9.2 Prove that BA is a tangent to the circle passing through K, B and N. (5)
[11]
QUESTION 10
10.1 In the diagram, ∆ABC and ∆DEF are drawn such that A = D, B = E, and C = F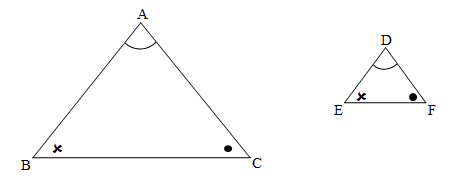
Use the diagram in the ANSWER BOOK to prove the theorem which states that if two triangles are equiangular, then the corresponding sides are in proportion, that is AB = AC
DE DF
10.2 In the diagram,O is the centre of the circle and CG is a tangent to the circle at G. The straight line from C passing through O cuts the circle at A and B. Diameter DOE is perpendicular to CA. GE and CA intersect at F. Chords DG, BG and AG are drawn. 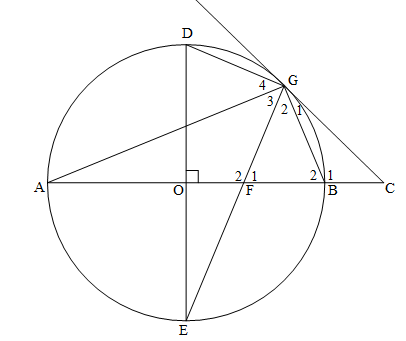
10.2.1 Prove that:
- DGFO is a cyclic quadrilateral
- GC = CF
10.2.2 If it is further given that CO = 11 units and DE = 14 units, calculate
- The length of BC
- The length of CG
- The size of E
INFORMATION SHEET: MATHEMATICS