MATHEMATICAL LITERACY PAPER 2 QUESTIONS - GRADE 12 AMENDED SENIOR CERTIFICATE EXAM PAST PAPERS AND MEMOS MAY/JUNE 2016
Share via Whatsapp Join our WhatsApp Group Join our Telegram GroupMATHEMATICAL LITERACY PAPER 2
GRADE 12
SENIOR CERTIFICATE EXAMINATIONS
2016
INSTRUCTIONS AND INFORMATION
- This question paper consists of FOUR questions. Answer ALL the questions.
- 2.1 Use the ADDENDUM with ANNEXURES to answer the following questions:
ANNEXURE A for QUESTION 1.1
ANNEXURE B for QUESTION 3.1
ANNEXURE C for QUESTION 3.2
ANNEXURE D for QUESTION 4.1 and QUESTION 4.2 ANNEXURE E for QUESTION 4.2
2.2 Answer QUESTION 3.2.1 on the attached ANSWER SHEET.
2.3 Write your centre number and examination number in the spaces on the ANSWER SHEET. Hand in the ANSWER SHEET with your ANSWER BOOK. - Number the answers correctly according to the numbering system used in this question paper.
- Start EACH question on a NEW page.
- You may use an approved calculator (non-programmable and non-graphical), unless stated otherwise.
- Show ALL calculations clearly.
- Round off ALL final answers appropriately according to the given context, unless stated otherwise.
- Indicate units of measurement, where applicable.
- Maps and diagrams are NOT drawn to scale, unless stated otherwise.
- Write neatly and legibly.
QUESTION 1
1.1
| During 2015 students from various universities protested using the slogan #FeesMustFall on social media. The horizontal bar graphs in ANNEXURE A show the annual fees charged by some universities for different degrees studied. |
Study the bar graphs in ANNEXURE A to answer the questions below.
1.1.1 Calculate the range of annual fees charged by the different universities for a BCom degree. (3)
1.1.2 The mean annual fee charged for a BA degree for the listed universities is R36 586, 11. Calculate, to the nearest rand, the missing value Z at the University of Stellenbosch. (5)
1.1.3 Give a suitable reason why there are no bars on the graph in ANNEXURE A for the LLB and Mechanical Engineering degrees at the NMMU. (2)
1.1.4 The information below is an extract from a newspaper article during the protest.
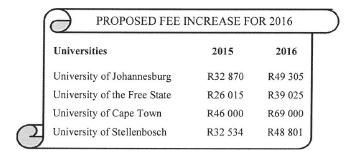
One of the students complained that the fee increase at the University of Cape Town was more than seven times the projected inflation rate of 6, 7% for the 2015/2016 period.
Verify, showing ALL calculations, if the student's statement is CORRECT. (6)
1.1.5 A student approached ABC Loans to borrow money to pay for his university fees for one year. He applied for a loan of R46 000,00. ABC Loans have the following conditions:
- A once-off initial fee of R300
- A monthly service fee of R38,00
- An interest rate of compounded annually
The student stated that the total loan value will be RI 1 633,59 more than the original total amount if he paid it off over a 24-month period.
Verify, showing ALL calculations, if the student's statement is CORRECT. (8)
1.2
Some students painted one letter of the slogan #FeesMustFall on their T-shirts.
|
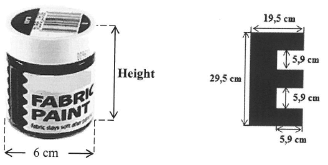
1.2.1 Calculate the height (in mm) of the fabric paint container if the volume of the container is 367,38 cm3
You may use the following formula:
Volume of fabric paint container = π x radius x radius x height, where π = 3,142 (5)
1.2.2 Calculate the amount of fabric paint required to paint the letter E on four T-shirts. (7)
1.2.3 The students used braiding (edging) to place a border around the edges of the letter E.
Calculate the length of braiding (edging) needed to place a border around the edges of the letter E on one T-shirt. (3)
[39]
QUESTION 2
2.1
Mr Kader is a 56-year-old teacher who started teaching on 1 January 1983. He contributed to the Government Employees Pension Fund (GEPF) from January 1983. He considered taking an early retirement on 31 December 2015. He found the information and formula below, which the GEPF uses to calculate retirement pay-out packages, on the Internet. GEPF NORMAL BENEFITS
The gratuity and annuity are calculated using the following formulae: |
2.1.1 Mr Kader's final salary to be used to calculate his gratuity is R26 578 per month. Calculate his gratuity, rounded off to the nearest rand. (4)
2.1.2 TABLE I below shows the income tax rates for the 2015/2016 tax year.
TABLE 1: INCOME TAX RATES FOR THE 2015/2016 TAX YEAR
| TAXABLE INCOME | TAX RATE |
| R0-R181 900 | 18% of each RI |
| R181 901-R284 100 | R32 742 + 26% of the amount above RI 81 900 |
| R284 101-R393 200 | R59 314 + 31% of the amount above R284 100 |
| R393 201-R550 100 | R93 135 + 36% of the amount above R393 200 |
| R550 101-R701 300 | RI 49 619 + 39% of the amount above R550 100 |
| R701 301 and above | R208 587 + 41% of the amount above R701 300 |
| TAX REBATE | |
| Primary rebate | R13 257 |
| Secondary rebate (Age 65 to below 75) | R7 407 |
| Tertiary rebate (Age 75 and older) | R2 466 |
- Calculate Mr Kader's monthly annuity after tax. (9)
- Motivate, with calculations, whether Mr Kader should retire. (4)
2.2
Absenteeism amongst learners in South African schools is a major concern. The pie charts below show some of the common reasons why boys and girls were absent for more than five days during the 2014 school year. LEARNER ABSENTEEISM DURING THE 2014 SCHOOL YEAR
|
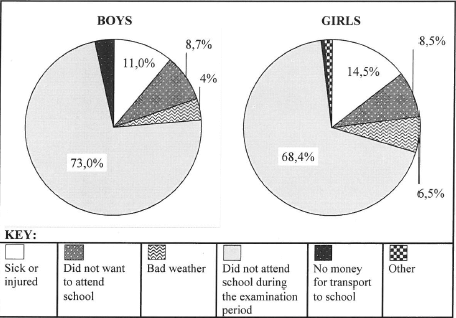
Use the information above to answer the questions that follow.
2.2.1 Determine the probability of randomly selecting a boy who was absent because he did not have money for transport to school. (3)
2.2.2 Explain why the sector 'Other' is not shown in the boys' pie chart, although the boys also had other reasons for being absent. (2)
2.2.3 Explain why the percentage absenteeism is at its highest during the examination period. (2)
2.2.4 A learner concluded from the data that more boys than girls were absent during the examination period.
Give a reason why the learner's conclusion is NOT correct. (2)
[26]
QUESTION 3
3.1.
| In any country water is an important natural resource. The information in ANNEXURE B shows the capacity level of some of South Africa's dams for 2014 and 2015 |
Study the information in ANNEXURE B and answer the questions that follow.
3.1.1 Which provinces have the least number of dams represented in this data set? (4)
3.1.2 Name TWO dams and their provinces where the water levels have risen from 2014 to 2015. (4)
3.1.3 Determine the probability of randomly selecting a dam that exceeded 80% of its capacity in 2015. (3)
3.1.4 The Gariep Dam has a capacity of 5 340 000 megalitres. Calculate the difference (in kilolitres) in the amount of water in the dam from 2014 to 2015. (5)
3.1.5 Give TWO reasons why a dam's water level can decrease from one year to the next. (4)
3.2
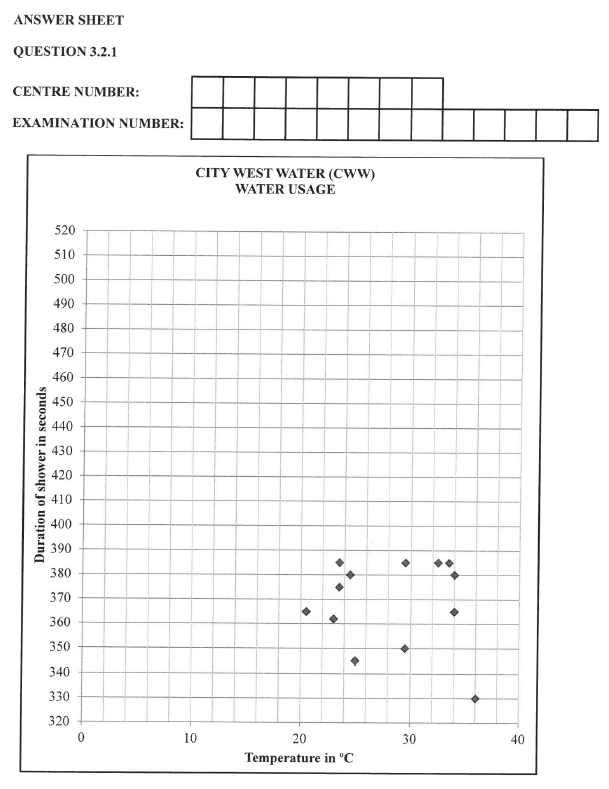
| In order to manage water usage for the future a study was done in Australia on how households in the City West Water (CWW) area and Yarra Valley Water (YWW) area used water for residential purposes during the winter and the summer. The table in ANNEXURE C shows how 26 households in the study used water during the winter and the summer when they showered. |
3.2.1 A scatter plot for the CWW summer data has been plotted on the ANSWER SHEET. On the same grid, plot a scatter plot for the CWW winter data. (6)
3.2.2 Describe the relationship between the seasonal temperature and the duration of a shower. (3)
3.2.3 How can this information help authorities to plan better for the future water needs of residents? (2)
3.2.4 Why cannot one one not use the results from the sample in the study to conclude that all households in Australia show the same trends when they shower during the summer and the winter? (2)
3.2.5 A household from the sample is chosen at random. Determine the probability that this household will shower for longer than 7 minutes and 10 seconds. (3)
3.2.6 The IQR (interquartile range) for the summer shower duration for C WW is 29. Use the incomplete box and whisker diagram in ANNEXURE C to calculate the difference between the IQR for the winter and summer shower duration for CWW. Show ALL calculations. (6)
[42]
QUESTION 4
4.1
| Maria, her husband and child live in Harrismith. They are planning a sightseeing family trip to Springbok to see the flowers. They want to rent a motorhome (see ANNEXURE D) to drive to Springbok. They will use this motorhome for transportation and accommodation. They estimate that the total return distance they will travel is 3 050 km. They have to budget for the vehicle rental, vehicle insurance and fuel. |
Use the information above and ANNEXURE D to answer the questions that follow.
4.1.1 The family is considering renting the two-berth (sleeper) vehicle. They do not want to pay an excess (extra amount) in case of an accident.
- Calculate the average rental cost per person if they rent the vehicle for 8 days using the unlimited kilometre option. (4)
- Compare the total cost of QUESTION 4.1.1(a) above with the cost of renting the two-berth vehicle for 7 days AND advise the family on which would be the most economical option. (8)
4.1.2 The actual length of Bed I in ANNEXURE D is 2,010 m. Determine the length (to the nearest mm) of this bed on the plan if the scale is 1 : 80. (3)
4.1.3 The price of diesel is RI 1,78 per litre. Maria stated that renting the two-berth vehicle instead of the four-berth vehicle would save RI 278,84 on the fuel cost for the trip.
Verify Maria's statement by showing ALL calculations. (10)
4.2
| The family finally decided to rent the smaller motorhome. Maria used the regional map and distance chart in ANNEXURE E to plan their trip to Springbok. They plan to travel via Bloemfontein to Springbok using the following national roads: N5, N1, N8, N1O and N14. The distance between Harrismith and Bloemfontein is 337 km. |
4.2.1 Use the information above, ANNEXURE D and ANNEXURE E to answer the questions that follow.
- Show that the first fuel stop will be at Kimberley.(5)
- Verify that the second fuel stop will be at Kakamas. Use both the distance chart and the scale on the map. (6)
4.2.2 They left Harrismith at 05:00 on Monday morning. The average speed covered while they were driving was 94 km/h. The refuel breaks took 20 minutes each and they took an extra 2¼hour break in Kimberley, with a stop of 180 minutes in Upington, to freshen up.
Determine the time and day they arrived at Springbok.
You may use the following formula:
Distance = speed x time taken (7)
[43]
TOTAL: 150