MATHEMATICAL LITERACY PAPER 2 GRADE 12 QUESTIONS - 2018 SEPTEMBER PREPARATORY EXAM PAPERS AND MEMOS
Share via Whatsapp Join our WhatsApp Group Join our Telegram GroupMATHEMATICAL LITERACY PAPER 2
GRADE 12
NATIONAL SENIOR CERTIFICATE
SEPTEMBER 2018
INSTRUCTIONS AND INFORMATION
Read the following instructions carefully before answering the questions.
- This question paper consists of FOUR questions. Answer ALL the questions.
- Use the ADDENDUM with ANNEXURES for the following questions:
ANNEXURE A for QUESTION 2.2.1
ANNEXURE B for QUESTION 2.3
ANNEXURE C for QUESTION 3.1
ANNEXURE D for QUESTION 3.3
ANSWER SHEET 1 for QUESTION 2.3.5
Write your name in the spaces provided on the ANSWER SHEET and hand in the ANSWER SHEET with your ANSWER BOOK. - Number the questions correctly according to the numbering system used in this question paper.
- An approved calculator (non-programmable and non-graphical) may be used, unless stated otherwise.
- Show ALL calculations clearly.
- Maps and diagrams are NOT drawn to scale, unless otherwise stated.
- Indicate units of measurement, where applicable.
- Round off ALL final answers appropriately accordingly to the given context, unless stated otherwise.
- Start EACH question on a NEW page.
- Write neatly and legibly.
QUESTION 1
1.1 A family with five people are living in a water-restricted area in Johannesburg where they can use 87 litres of water per person per day from the municipality. They have decided to install eco-water storage tanks to be able to use 250 litres per person per day. The family uses 87 litres per person of water from the municipality and uses the extra amount from the water tanks. They have two water tanks with dimensions as shown in TABLE 1 below.
TABLE 1: Dimensions of the two water tanks
| TANK | Diameter in millimetres | Height in millimetres |
| A | 1 050 | 1 420 |
| B | 1 800 | 2 100 |
NOTE: Two tanks with dimensions as shown have been installed at their house.
1.1.1 How many litres of water in total do they use per month (30 days) from the municipality and from the tanks? (5)
1.1.2 Use TABLE 2, the water tariff charges, below to answer the question.
TABLE 2: [NORMAL WATER TARIFF CHARGES FOR JOHANNESBURG IN 2016/2017]
| Tariff Summary (in kilolitre) | Tariff Rand per kilolitre (without VAT) |
| 0 – 6 kℓ | Free |
| 7 – 10 kℓ | R7,14 |
| 11 – 15 kℓ | R12,07 |
| 16 – 20 kℓ | R17,65 |
| 21 – 30 kℓ | R24,03 |
| 31 – 40 kℓ | R25,81 |
| > than 40 | R32,27 |
Conversion: 1 kℓ = 1 000 litres
The family states that, if the water per person (number of litres) used from the water tank were charged using the normal municipality tariffs, they would be paying more than R300 including VAT (14%) for the water bill. Verify, with the necessary calculations, whether their statement is valid or not. (9)
1.1.3 Verify, with the necessary calculations, whether they will have enough water for 30 days with both tanks full, even if it does not rain.
NOTE: Amount of the water in a full tank is equal to the volume of
the tank, rounded to the nearest thousand.
You may use the formula:
Volume of cylindrical tank = π × radius x radius × height; where
π = 3,142
Conversion: 1 000 cm3 = 1 litre (9)
1.2 In a no fee school, book packs (stationary) are supplied to Grade 10, 11 and 12 learners in the ratio 5 : 3 : 2. There are different stickers for each of these grades; blue for Grade 10, beige for Grade 11 and green for Grade 12. Each book pack cost R320,00 including VAT (15%).
1.2.1 The Grade 10 learners received 250 book packs. How many packs were supplied for the whole school? (5)
1.2.2 A government official states that the 15% VAT charged on the total number of book packs is more than the total cost of 50 book packs. Verify, with calculations to show whether the statement is valid or not. (7)
1.2.3 Determine the probability of randomly choosing a book pack belonging to either Grade 11 or Grade 12. Give your final answer as a percentage. (4)
[39]
QUESTION 2
2.1 The two sets of data below represent the percentage passes in 11 chosen subjects for 2015 and 2016.
| 2015 | 59,6; 76,9; 75,7; 68,2; 97,1; 77,0; 84,0; 70,4; 71,4; 49,1; 58,6 |
| 2016 | 69,5; 75,4; 73,7; 65,3; 97,4; 76,5; 84,0; 70,5; 71,3; 51,1; 52,0 |
2.1.1 Study the data sets for 2015 and 2016 and answer the following questions.
- Calculate the mean for the 2015 data set. (3)
- An educator stated that, if only the mean was considered, the 2016 learners performed better than the 2015 learners did. Verify the statement by showing all calculations. (3)
2.1.2 The box and whisker diagrams below are representing the two sets of data for the percentage passes in 11 chosen subjects. Some information has been omitted.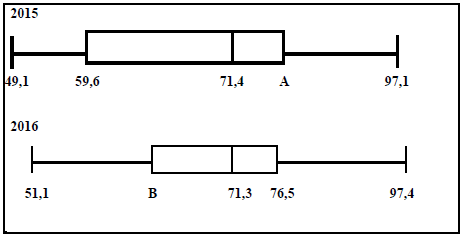
An educator claimed that the 2015 results were better than the 2016 results when comparing the two box and whisker diagrams. Verify this statement by commenting on the interquartile range. (6)
2.2 Use the tax table in ANNEXURE A to answer the following questions.
2.2.1 A 56-year-old woman is earning R31 625 taxable income per month. She is not contributing to any medical aid. She claims that with her monthly tax she can pay old age grants for two old age people and ten child support grants. Prove, with calculations, whether her statement is valid or not.
NOTE: Child support grant is R380 and old age grant is R1 600. (10)
2.2.2 She is working for a company offering 5,8% increment for the first year and 6,8% for the following year. Calculate her total annual income after two years. (5)
2.3 The table in ANNEXURE B shows a statistical summary of social grants in South Africa. Answer the questions based on the table.
2.3.1 Calculate the difference in the total of the old age grant and child support grant for KwaZulu-Natal and Western Cape. (4)
2.3.2 Identify the province with the lowest number of social grants, excluding war veteran grants and grant in aid. (2)
2.3.3 The following table represents the War Veteran grants for 2017 and 2018 for the different provinces.
| EC | FS | GP | KZN | LP | MP | NC | NW | WC | |
| 2017 | 23 | 1 | 51 | 22 | 6 | 4 | 4 | 2 | 46 |
| 2018 | 21 | 1 | 48 | 15 | 3 | 3 | 3 | 2 | 42 |
Give a possible reason why the number of the War Veteran grants for Gauteng and North West provinces differ from one another. (2)
2.3.4 Describe the trend of the number of War Veteran Grants between the two years. (4)
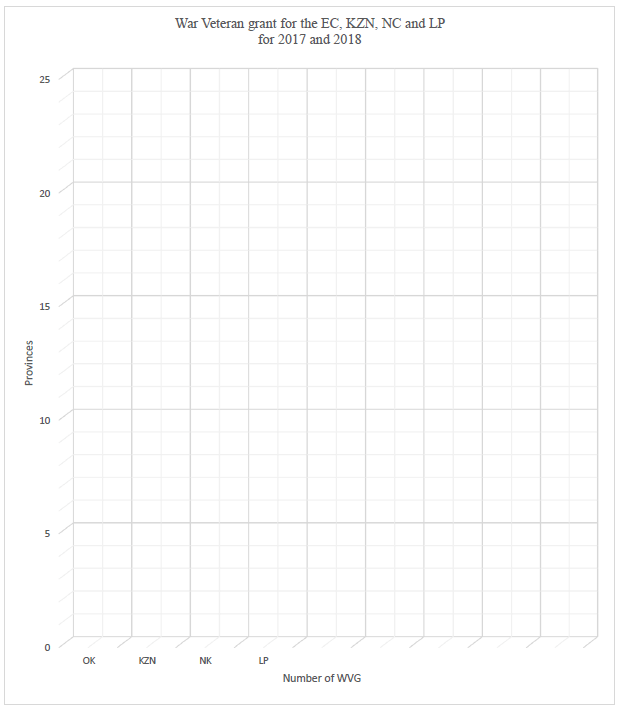
2.3.5 Draw a compound bar graph on ANSWER SHEET 1 to represent the total number of War Veterans’ grants for the Eastern Cape, KwaZulu-Natal, Northern Cape and Limpopo for the two years. (4)
[43]
QUESTION 3
3.1 Two families are travelling from Cape Town to Durban for a holiday. The first family leaves Cape Town at 08:00 and the second family leaves 30 minutes later. Both families have one and a half hour rest during their trip. The arrival time in Durban for both families was 21:00.
Use the map of Southern Africa with the given scale in ANNEXURE C to answer the questions below.
3.1.1 The first family claims that the second family might have been travelling at a greater speed. Verify, with the necessary calculations, whether their claim is valid.
You may use the following formula:
Speed = ???????? ?? ?????????? (10)
???? ?? ?????
3.1.2 Identify the country on the map, which is situated northwest of Zimbabwe. (2)
3.2 A Mathematical Literacy educator is teaching measurement to her class. She prepares shapes on a page as shown below. Learners must paste it in their books with dimensions as shown below.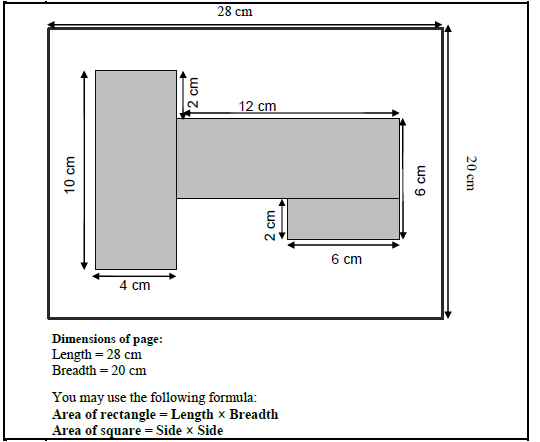
3.2.1 A learner uses string to measure the perimeter of the shaded figure. What is the length of the string needed? (4)
3.2.2 Calculate the area of the unshaded part in square centimetres (cm2). (7)
3.3 ANNEXURE D represents the gates and camp distances for the Kruger National Park.
3.3.1 Tourists in Kruger National Park state that travelling from Satara to Olifants will take them half the time from N’wanetsi to Lower Sabi. By considering the distances, explain whether their statement is valid or not.
NOTE: They are not travelling at the same speed. (4)
3.3.2 The distance from Punda Maria to Paul Kruger via Mopani is 30 km less than the distance from Skukuza to Pafuri. Verify, showing all calculations, whether this statement is true. (4)
[31]
QUESTION 4
4.1 TABLE 3 below shows information for fees payable for undergraduate studies in Australia. It shows 3 faculties at 10 selected universities. Study the table below and answer the questions.
TABLE 3: UNIVERSITY FEES
Bachelor’s Degree (Undergraduate) – Fees
| University | Business | Engineering | Arts |
| Australian Catholic University | $23 800 | $21 000 | |
| Australian National University | $39 024 | $41 040 | $36 720 |
| Bond University | $33 640 | $33 640 | $33 640 |
| CQ University | $23 760 | $30 240 | $21 120 |
| Charles Darwin University | $20 440 | $26 000 | $18 520 |
| Charles Sturt University | $22 800 | $18 400 | |
| Curtin University | $30 000 | $34 000 | $30 000 |
| Deakin University | $28 952 | $33 000 | $25 088 |
| Edith Cowan University | $27 600 | $25 760 | $27 200 |
| Federation University Australia | $24 700 | $28 800 | $23 300 |
4.1.1 Give a possible explanation for no fees payable in Engineering at certain universities. (2)
4.1.2 Calculate the total amount (fees) payable in Rand, if two students are studying Business and Engineering at Bond and Edith Cowan Universities respectively.
Given that the exchange rate was the following on 30 January 2018:
1 Australian dollar (AUSD) = R9,68. (4)
4.1.3 Determine the probability to randomly choose a university where the fees for Arts is greater than $15 000 but less than $30 000. Give your final answer as a decimal fraction. (3)
4.2 The table below represents the sales in Europe for all models of Mercedes Benz from July to December for three consecutive years.
TABLE 4: MERCEDES-BENZ SALES IN EUROPE
| Month | Mercedes Benz sales | ||
| 2014 | 2015 | 2016 | |
| July | 29 406 | 29 689 | 31 795 |
| August | 28 958 | 30 633 | 31 556 |
| September | 29 523 | 29 678 | 32 470 |
| October | 30 733 | 31 749 | 31 383 |
| November | 37 110 | 32 813 | 32 927 |
| December | 37 297 | 38 249 | 35 871 |
4.2.1 Calculate the percentage increase in Mercedes-Benz sales from September 2015 to December 2015. (4)
4.2.2 Which month shows the highest Mercedes-Benz sales for all the years? Give a possible reason for these high Mercedes-Benz sales. (3)
4.2.3 Calculate the difference in sales for August 2015 and August 2016 if a car is sold at an average price of R550 000. Give your final answer in Euro.
Given that 1 Euro = R14,81 (5)
4.3 A construction company has employed people for a project to be done in 14 days. There are 3 different levels of employees with different rates of payments.
There are two Level 3 employees paid at a rate of R248 per hour, six Level 2 employees at a rate of R218,24 per hour and thirty-two Level 1 employees at a rate of R163,68 per hour.
They work from 14:00 until 20:00 on the first day, with an hour mealtime in-between. For the other days, they work from 08:00–20:00 with 2 hours mealtime in-between. On the last day, Level 1 employees work for four hours while Level 2 and 3 employees work for eight hours.
Employees are staying 14 km from the construction site and are transported by bus daily to and from the construction site at a rate of R3,18 per kilometre per person.
NOTE:
- The construction company is paying the bus company for transport.
- Employees are not paid for any breaks.
4.3.1 The chief financial officer of the construction company states that the amount needed for the employees without transport cost is R800 000. Verify, with the necessary calculations, whether his statement is valid or not. (10)
4.3.2 The chief financial officer reported to the board of managers that the total amount the construction company is paying for transport cost as a decimal fraction of the total amount for employees, is less than 0,5. Verify, with the necessary calculations, whether the report is valid or not. (6)
[37]
TOTAL: 150
ANSWER SHEET for QUESTION 2.3.5
Name and Surname: ……………………………………………………….. Grade 12: …….