MATHEMATICAL LITERACY PAPER 1 GRADE 12 QUESTIONS - AMENDED SENIOR CERTIFICATE EXAMS PAST PAPERS AND MEMOS MAY/JUNE 2018
Share via Whatsapp Join our WhatsApp Group Join our Telegram GroupMATHEMATICAL LITERACY
PAPER 1
GRADE 12
AMENDED SENIOR CERTIFICATE EXAMS
PAST PAPERS AND MEMOS
MAY/JUNE 2018
INSTRUCTIONS AND INFORMATION
- This question paper consists of FIVE questions. Answer ALL the questions.
-
- 2.1 Use the ANNEXURES in the ADDENDUM to answer the following questions:
- ANNEXURE A for QUESTION 2.1
- ANNEXURE B for QUESTION 4.1
- ANNEXURE C for QUESTION 5.2
- 2.2 Answer QUESTION 5.1.8 on the attached ANSWER SHEET.
- 2.3 Write your centre number and examination number in the spaces on the ANSWER SHEET. Hand in the ANSWER SHEET with your ANSWER BOOK.
- 2.1 Use the ANNEXURES in the ADDENDUM to answer the following questions:
- Number the answers correctly according to the numbering system used in this question paper.
- Start EACH question on a NEW page.
- You may use an approved calculator (non-programmable and non-graphical), unless stated otherwise.
- Show ALL calculations clearly.
- Round off ALL final answers appropriately according to the given context, unless stated otherwise.
- Indicate units of measurement, where applicable.
- Maps and diagrams are NOT necessarily drawn to scale, unless stated otherwise.
- Write neatly and legibly.
QUESTION 1
1.1
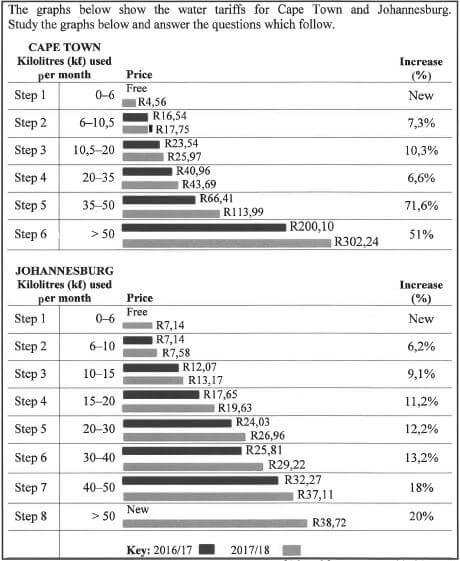
[Adapted from www.graphics24.co.za]
1.1.1 State the type of graph used to represent this data. (2)
1.1.2 Arrange Cape Town's percentage increase in descending order. (2)
1.1.3 Identify the step that indicates the largest increase (in rand) in Cape Town's water tariff from 2016/17 to 2017/18. (2)
1.1.4 Determine in which ONE of the two cities water is more expensive. (2)
1.1.5 Calculate the cost of 3,5 kC of water in Johannesburg during 2017/18. (2)
1.1.6 Is the data given categorically or numerically? (2)
1.2 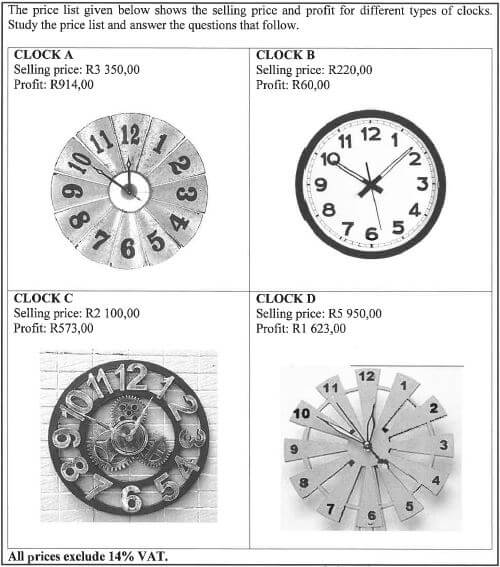
[Adapted from www.pricecheck.co.za]
1.2.1 Explain the term cost price. (2)
1.2.2 Calculate the cost price of CLOCK A, excluding VAT. (2)
1.2.3 Write down the time on CLOCK B, using the 24-hour format if it represents the time in the evening. (2)
1.2.4 Calculate the total profit made if all four clocks are sold. (2)
1.3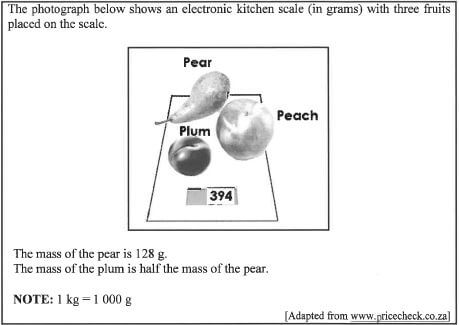
[Adapted from www.pricecheck.co.za]
Use the photograph and information above to answer the questions that follow.
1.3.1 Convert the total mass of the fruit into kg. (2)
1.3.2 The pear is removed from the kitchen scale. Write down the new reading (in grams) shown on the kitchen scale. (2)
1.3.3 Show how the mass of 202 g for the peach was calculated. (3)
1.3.4 Determine the probability of randomly selecting a banana from the fruit placed on the kitchen scale. (2)
1.3.5 Write down the simplified ratio of the total mass of fruit to the total mass of the pear. (2) [31]
QUESTION 2
2.1
| Mrs Chan, a teacher from Brakpan, received a monthly statement from GEMS (Government Employee Medical Scheme), as shown in ANNEXURE A. Mrs Chan has one dependent, her son Lee, on her medical aid. |
Use ANNEXURE A to answer the questions that follow.
2.1.1 Which month is covered by this statement? (2)
2.1.2 State why the member had to pay R445,10 to the supplier. (2)
2.1.3 Write down the name of the general practitioner visited. (2)
2.1.4 Calculate the new price of the acute medication (under the tariff code) if the price increased by 6,3%. (3)
2.1.5 Calculate the total amount of tax claimable in the previous statements if the tax claimable is the amount paid by the member directly to the supplier. (2)
2.1.6 Define the term debit within the context of the statement. (2)
2.1.7 Show how the total amount of R479,75 was calculated. (2)
2.2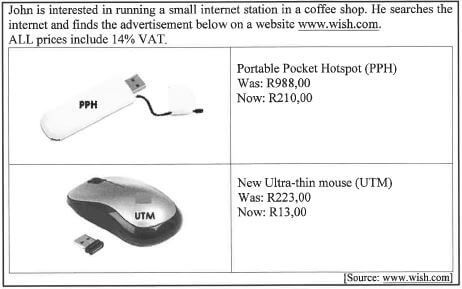
[Source: www.wish.com
Study the advertisement above and answer the questions that follow.
2.2.1 What does the acronym VAT stand for? (2)
2.2.2 Calculate the amount of VAT payable on the old price for the PPH. (3)
2.2.3 Calculate the difference between the new price and the old price of the UTM. (2)
2.3
John told his friend Errol, who lives in Botswana, about the profit he made when he sold the ultra-thin mouse (UTM).
[Source: www.x-rates.com] |
Use the table and the information above to answer the questions that follow.
2.3.1 Write down the exchange rate between the Botswana pula (BWP) and the South African rand (ZAR). (2)
2.3.2 List the currencies which are weaker than the ZAR. (3)
2.3.3 Each mouse costs R13,00 and is sold for BWP48.
- Convert R13,00 into BWP (2)
- Calculate the total number of UTMs sold if a total profit of BWP7526 was made. (4)
2.3.4 Calculate the amount (in BWP) that Errol will receive if a total profit of BWP7526 was made. (3)
2.3.5 Show how the Algerian dinar of 0,104747 ZAR per unit was obtained. (2) [38]
QUESTION 3
3.1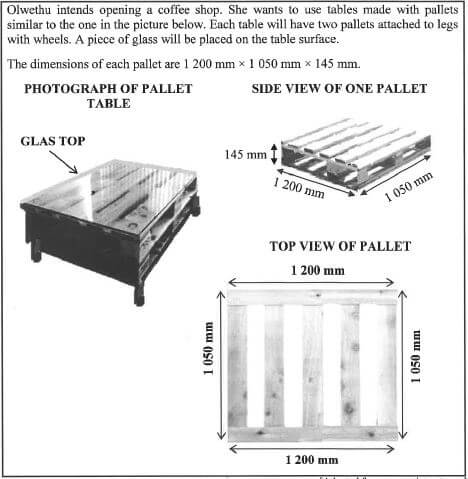
[Adapted from www.pintrest.com
Use the information and photographs above to answer the questions that follow. (2)
3.1.1 Calculate the number of pallets needed to produce 12 tables. (3)
3.1.2 Calculate the total height of the table, excluding the glass top, if the leg, including the wheel, is 200 mm high. (3)
3.1.3 Calculate the area (in mm2) of the glass top.
You may use the formula:
Area = length x width (3)
3.1.4 For safety reasons a rubber strip will be placed around the edge of the glass top. Calculate the total length (in mm) of rubber required for this purpose. (3)
3.2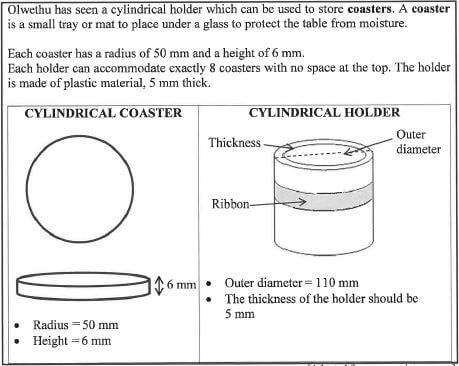
[Adapted from www.pintrest.com]
Use the information above to answer the questions that follow.
3.2.1 The holder will have a decorative ribbon around it. The ribbon will be 2 cm longer than the circumference of the holder so that a bow can be tied in the ribbon. Calculate the total length (in cm) of ribbon needed for one holder. You may use the following formula:
Total length of ribbon = ir x diameter + overlap, and using it = 3,142 (4)
3.2.2
- Write down the inner radius (in mm) of the cylindrical holder. (2)
- Hence, calculate the space needed in the holder to fit exactly 8 coasters.
You may use the following formula:
Volume of cylinder = it x radius2 x height; and using it = 3,142 (4) [21]
QUESTION 4
4.1
| Crazy Daisy Coffee Shop is situated in the north wing of a shopping mall. The layout plan (drawn to scale) of the shopping mall is given in ANNEXURE B. |
Use ANNEXURE B to answer the questions that follow.
4.1.1 Write down the shop number of Crazy Daisy Coffee Shop. (2)
4.1.2 State which parking area is closest to Toy World. (2)
4.1.3 Write down the name of the shop which has the biggest floor area. (2)
4.1.4 The manager of shop 18 ordered a cup of coffee and a slice of cake to be delivered by Crazy Daisy Coffee Shop. Give the delivery man a set of directions from Crazy Daisy Coffee Shop up to the entrance of shop 18. (4)
4.1.5 Calculate the total number of doors shown on this layout plan. (2)
4.1.6 Write down the probability of randomly selecting a shop that has TWO door entrances. (2)
4.1.7 Determine the probability of randomly selecting a shop that is NOT labelled with an even number. (2)
4.2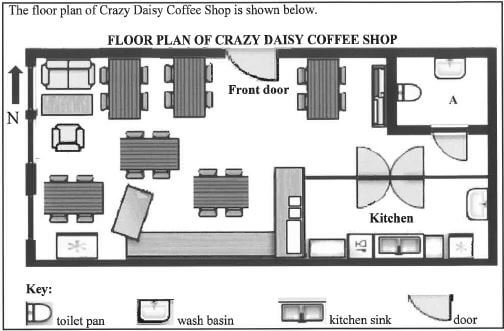
[Adapted from www.shopkeep.com
Use the floor plan above to answer the questions that follow.
4.2.1 Explain the meaning of the term floor plan. (2)
4.2.2 Identify the room labelled A. (2)
4.2.3Give the general direction of the kitchen from the front door. (2)
4.2.4 The measured width of the coffee shop is 70 mm. The actual width is 15 m. Determine the scale (rounded off to the nearest whole number) of the floor plan. (3) [25]
QUESTION 5
5.1
| Statistics South Africa (STATSSA) collects and releases data based on passenger transport annually. TABLE 2 below shows the 2016 data for land passenger transportation. TABLE 2: 2016 DATA FOR LAND PASSENGER TRANSPORT
[Adapted from www.statssa.co.za] | ||||||||||||||||||||||||||||||||||||||||||||||||||||||||||||||||||||||||||||||||||||||||||||||||||||||||||||||
Use the table above to answer the questions that follow.
5.1.1 Write down the month with the highest income for rail transportation. (2)
5.1.2 Calculate the mean monthly income for rail transportation. (3)
5.1.3 Calculate the road transportation income for April as a percentage of the total land income. (3)
5.1.4 Write down the total number of land passenger journeys for December. (2)
5.1.5 Write down (in words) the total number of passenger journeys for September. (2)
5.1.6 Calculate the median total land income. (3)
5.1.7 Write down the probability, as a decimal, of randomly selecting a month when the rail income for passenger transport was less than R200 000 000. (3)
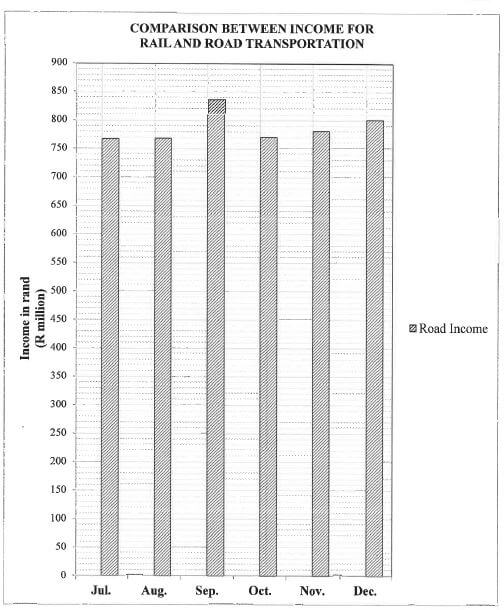
5.1.8 A bar graph showing the monthly income for road transport for the last six months of the year, is drawn on ANSWER SHEET 1. On the same set of axes, draw another bar graph representing the monthly income for rail transport for the last six months of the year. (6)
5.2 The pie charts on ANNEXURE C show the different sources of income for households in the Western Cape and the Northern Cape in 2016.
Use ANNEXURE C to answer the questions that follow.
5.2.1 If the total number of households in the Western Cape was 2 768 000 during 2016, calculate the number of households that depend on grants as a source of income. (3)
5.2.2 Identify the THIRD HIGHEST source of income in the Western Cape. (2)
5.2.3 Calculate the difference between the number of households in the Western Cape and the Northern Cape that depended on business as a source of income for 2016. (3)
5.2.4 Determine the percentage (to TWO decimal places) of remittances in the Northern Cape if there were 532 000 households. (3) [35]
TOTAL: 150
ANSWER SHEET 1
QUESTION 5.1.8
CENTRE NUMBER:
EXAMINATION NUMBER: