GEOGRAPHY PAPER 1 GRADE 12 ANNEXURE - AMENDED SENIOR CERTIFICATE EXAMS PAST PAPERS AND MEMOS MAY/JUNE 2018
Share via Whatsapp Join our WhatsApp Group Join our Telegram GroupGEOGRAPHY
PAPER 1
GRADE 12
AMENDED SENIOR CERTIFICATE EXAMS
PAST PAPERS AND MEMOS
MAY/JUNE 2018
ANNEXURE
FIGURE 1.1: STAGES IN THE DEVELOPMENT OF MID-LATITUDE CYCLONES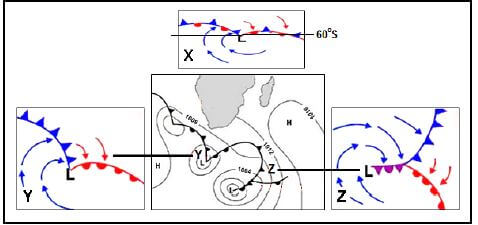
[Adapted from geography myschoolstuff.co.za]
FIGURE 1.3: INFLUENCE OF THE PLATEAU ON SOUTH AFRICAꞌS CLIMATE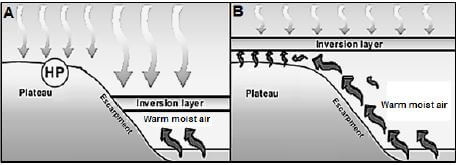
[Source: https://www.google.co.za/search?biw=1366&bih=613&tbm=isch&sa=1&q=+inversion+on+SA]
FIGURE 1.4: VALLEY CLIMATE
Pietermaritzburg is located in a valley. Air pollution concentration is at its worst during winter. Pollutants are trapped in the valley and cannot be easily dispersed. This condition causes the city's well-known brown haze which is a mixture of fog and pollutants. This condition is mainly visible between 08:00 and 11:00 during the winter when the radiation fog has not been dispersed yet. This also coincides with peak hour traffic, which creates a spike in pollution levels that increases to as much as 10 times the normal level. The brown haze disappears after 11:00.
|
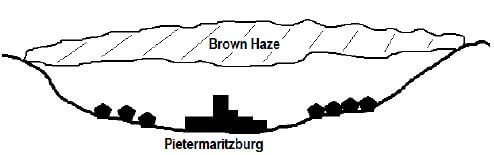
[Adapted from News24, with examiner's sketch]
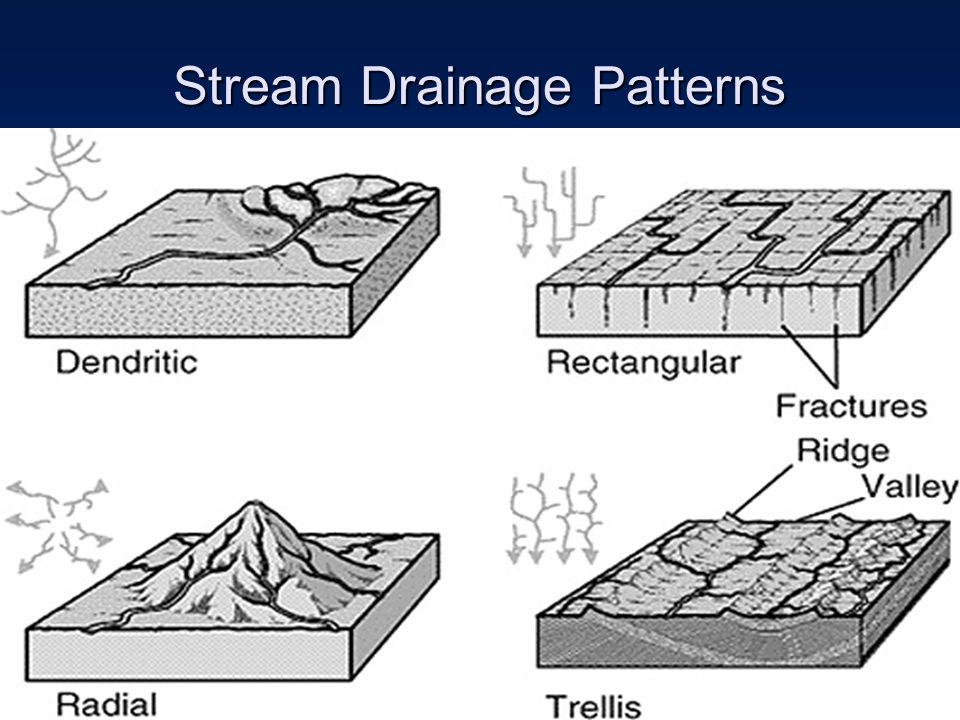
FIGURE 1.5: TYPES OF DRAINAGE PATTERNS 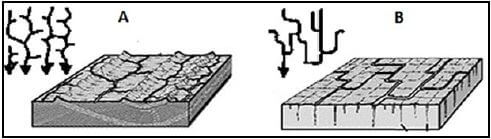
[Source: http://slideplayer.com/7545408/24/images/30/Stream+Drainage+Patterns.jpg]
FIGURE 1.6: DELTA 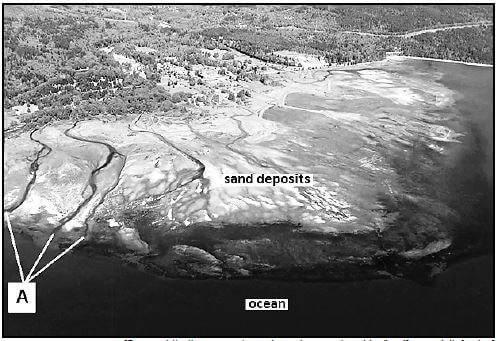
[Source: http://www.pugetsoundnearshore.org/graphics/landforms_deltafan.jpg]
FIGURE 2.1: PRESSURE CELLS – SUMMER CONDITIONS 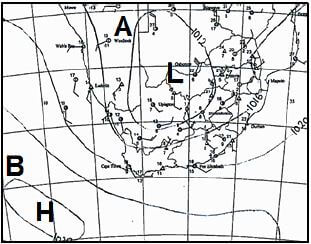
[Source: South African Weather Services]
FIGURE 2.3: TROPICAL CYCLONES
IS SOUTH AFRICA DUE FOR A TROPICAL CYCLONE? Most South Africans don't associate tropical cyclones with our shores, but they can and do affect the eastern part of our country. They are rare (unusual) conditions, with only one storm having crossed into our borders in the last 33 years. [Adapted from eNCA news] |
FIGURE 2.4: COASTAL LOW PRESSURE 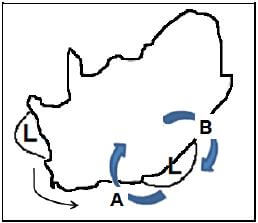
[Source: Examiner's Sketch]
FIGURE 2.5: THE COURSE OF A RIVER 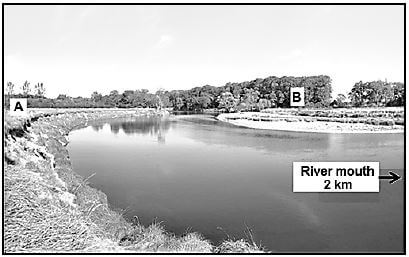
[Adapted from https://upload.wikimedia.org/wikipedia/commons/thumb/0/0f/Mulde_%28Fluss%29%2CPrallhang% 2CGleithang.jpg/1200px-Mulde_%28Fluss%29%2CPrallhang%2CGleithang.jpg]
FIGURE 2.6: HUMAN IMPACT ON THE VAAL DAM
SEWAGE IN GAUTENG DRINKING WATER | |
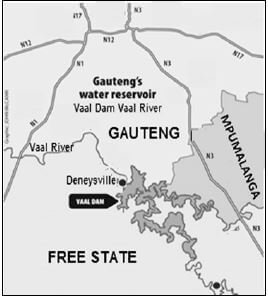 | Sitting on the bank of the Vaal Dam is the town of Deneysville which is being overwhelmed by streams of human waste. The billion cubic metres of water of the dam supply most of Gautengꞌs drinking water. At fault are the townꞌs two sewerage-pumping stations and the wastewater works that should be cleaning that waste. (through the Highlands Water Scheme) into the Vaal Dam is polluted so much that it has to be heavily treated to become drinking water again. The majority of municipalities around the dam are in contravention of the National Water Act because they are not preventing the release of unsafe levels of bacteria like E. coli. |
[Adapted from https://mg.co.za/article/2015-07-23-sewage-in-gautengs-drinking-water]
FIGURE 3.2: DATA RELATING TO ECONOMIC ACTIVITIES OF SOUTH AFRICA 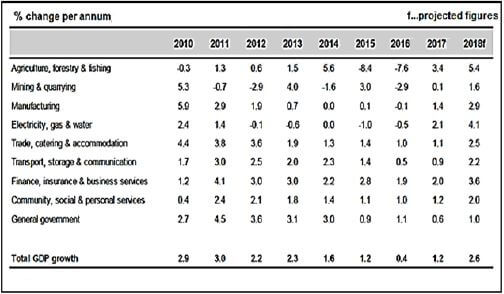
[Adapted from Stats SA (historical data) IDC forecasts]
FIGURE 3.4: URBAN LAND-USE ZONES 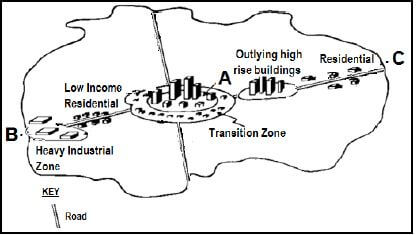
[Adapted from http://www.globalsecurity.org/military/library/policy/army/accp/in0726/image5.gif]
FIGURE 3.5: AGRICULTURAL TRADE
EXPORTS | INPORTS | |
Unprocessed Processed | Maize, sugar cane, grapes Wine, syrup, mealie meal | Rice, wheat Flour, breakfast cereal |
[Adapted from News24 Wire]
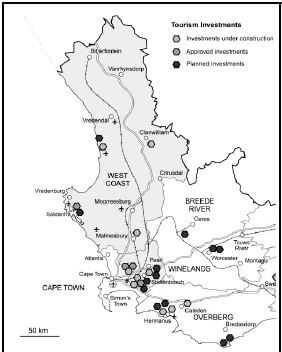
FIGURE 3.6: WEST COAST SPATIAL DEVELOPMENT INITIATIVE
[Adapted from http://0- www.tandfonline.com.innopac.wits.ac.za/doi/pdf/10.108 0/03768350500163014] | GROWTH OF THE WEST COAST ECONOMY Africa is experiencing accelerated growth in oil and gas production. This increase in oil and gas activity, the location of Saldanha Bay in relation to West and East Africa, and the size of the harbour ensures that Saldanha Bay is ideally placed for rig repair and servicing. With 120 oil rigs passing around the Cape coast annually, the West Coast SDI has been designated as an oil and gas processing and marine vessel repairing and logistics services complex. [Adapted from http://acceleratecapetown.co.za/saldanha-idz west-coast-economy/] |
FIGURE 4.1: RURAL SETTLEMENTS 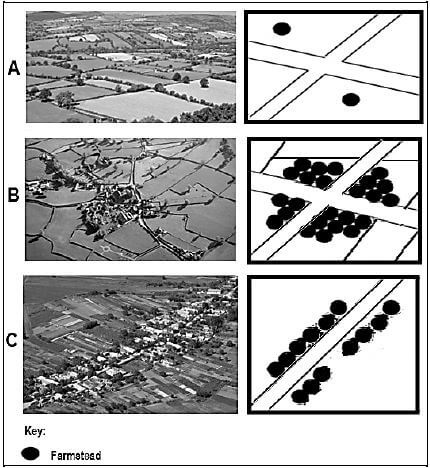
[Adapted from https://images.search.yahoo.com/yhs/search;_ylt=A0LEVvwh_YFZ73sA6rwPxQt.?p=r ural+settlement+patterns and http://rogpalmer.cantabphotos.com]
FIGURE 4.3: INFORMAL SETTLEMENTS
INFORMAL SETTLEMENTS One in five residents of South African cities lives in a shack, most of which is densely clustered in informal settlements. These areas present the country with its biggest challenges. Shack dwellers are exposed to hardship, insecurity and hazards from living in unhygienic and overcrowded conditions on un-serviced and sometimes unsuitable land. They believe they deserve better, which adds to their growing discontent (unhappiness) and violent protests in recent years. [Adapted from www.hsrc.co.za] |
FIGURE 4.4: ENVIRONMENTAL INJUSTICE
ENVIRONMENTAL INJUSTICE IN SOUTH AFRICA Through its work at the Medupi site (mega coal-fired power station), Eskom is guilty of an environmental injustice. In South Africa it is the poor who bear the impact of poor air quality caused by coal-fired power stations. These power stations are situated close to poor mining communities who live in poorly built houses that provide little protection against bad air quality. [Source: www.twitter.com/NezirSinani] |
FIGURE 4.5: MANUFACTURING ACTIVITIES 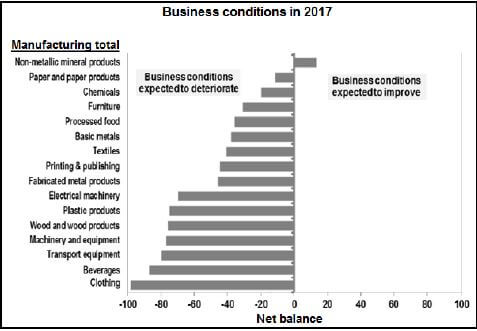
[Adapted from IDC, compiled from BER data]
FIGURE 4.6: INFORMAL TRADING
THE SLEEPING GIANT – INFORMAL TRADE IN SOUTH AFRICA The SA food market is worth R485 billion. Of this, 66% is accounted for by the major supermarkets and branded superettes (R320 billion); while informal and wholesalers account for the rest of the total market. [Source: http://www.supermarket.co.za/news-article.asp?ID=6851&CatTags=16-Economic%20factors] |