STATISTICS QUESTIONS AND ANSWERS GRADE 12
Share via Whatsapp Join our WhatsApp Group Join our Telegram GroupActivity 1
The table below represents Mathematics test scores and frequency for each score.
| Scores (x) | Frequency (f) |
| 13 | 5 |
| 17 | 6 |
| 20 | 4 |
| 25 | 10 |
- Determine the median (2)
- Determine the mean (2)
[4]
Solutions
|
Activity 2
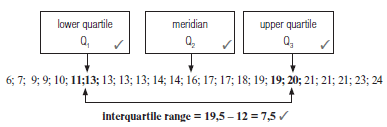
If the test scores in another class are represented by the data below, find the interquartile range of the test results:
6; 7; 9; 9; 10; 11; 13; 13; 13; 13; 14; 14; 16; 17; 17; 18; 19; 19; 20; 21; 21; 21; 23; 24. [8]
Solution
[8] |
Activity 3
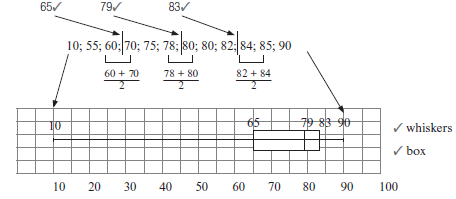
- These are the scores of ten students in a Science test:
90; 85; 10; 75; 70; 60; 78; 80; 82; 80; 55; 84- Draw a box and whisker diagram for the given data. (5)
- Determine the interquartile range. (2)
- State whether the data is skewed or not. (1)
- State whether 10 is an outlier or not. (2)
[10]
Solutions
|
Activity 4
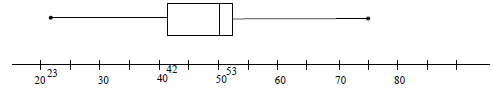
- The five number summary of heights of trees three months after they were planted is (23 ; 42 ; 50 ; 53 ; 75). This information is shown in the box and whisker diagram below.

- Determine the interquartile range. (2)
- What percentage of plants has a height excess of 53 cm? (2)
- Between which quartiles do the heights of the trees have the least variation? Explain. (2)
[6]
Solutions
|
Activity 5
An ice cream vendor has kept a record of sales for October and November 2012. The daily sales in rands is shown in the histogram below.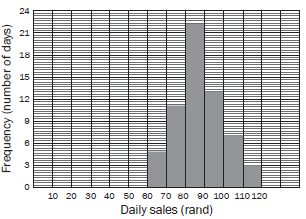
1.1 Draw up a cumulative frequency table for the sales over October and November. (2)
1.2 Draw an ogive for the sales over October and November. (3)
1.3 Use your ogive to determine the median value for the daily sales. Explain how you obtain your answer. (1)
1.4 Estimate the interval of the upper 25% of the daily sales. (2)
[8]
| Solutions 1.1 Cumulative frequency table:
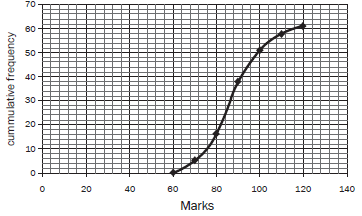 1.3 There are 61 data points, so the median is the 31st data point. We can read the data point off the graph at 31. It gives a rand value of R87. 3 (1) 1.4 The upper 25% lies above 75% of 61 = 45,75. 3 Read from the y-axis across to the graph and down to the x-axis. The upper 25% of sales lies in the interval: 96 ≤ sales < 120 3(2) [8] |
- 1st three points plotted correctly
- last three points plotted correctly
- grounding at 0
We can find the median, the range and the interquartile range from a cumulative frequency graph.
We cannot find the mean from a cumulative frequency graph
Activity 6
The data below shows the energy levels, in kilocalories per 100 g, of 10 different snack foods.
440 520 480 560 615 550 620 680 545 490
- Calculate the mean energy level of these snack foods. (2)
- Calculate the standard deviation. (2)
- The energy levels, in kilocalories per 100 g, of 10 different breakfast cereals had a mean of 545,7 kilocalories and a standard deviation of 28 kilocalories. Which of the two types of food show greater variation in energy levels?
What do you conclude? (2)
[6]
Solutions
|
Activity 7
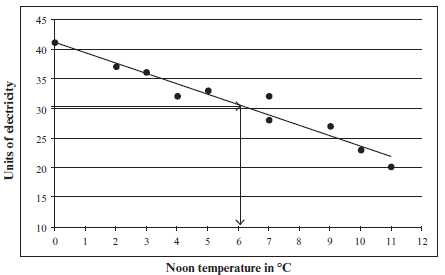
The outdoor temperature (in °C) at noon is measured. It is compared with the number of units of electricity used to heat a house each day.
| Temp in °C | 7 | 11 | 9 | 2 | 4 | 7 | 0 | 10 | 5 | 3 |
| units of electricity used | 32 | 20 | 27 | 37 | 32 | 28 | 41 | 23 | 33 | 36 |
- Draw a scatter graph to represent this data. (3)
- Draw in a line of best fit. (1)
- Use your line of best fit to estimate the noon temperature when 30 units of electricity are used. (1)
[5]
Solutions
|
Activity 8
- Pick ’n Pay wants to survey how long in seconds (y) it takes a teller to scan (x) items at the till.
The table shows the results from 9 shoppers.Shoppers A B C D E F G H I x (no of items 5 8 12 15 15 17 20 21 25 y (time in seconds) 3 11 9 6 15 13 25 15 13 - Use your calculator to determine the equation of the line of best fit (the regression line or the least squares regression line) correct to two decimal places. (3)
- Calculate the value of r, the correlation coefficient for the data. What can you say about the correlation between x and y? (3)
- How long would the teller take to scan 21 items at the till? (2)
- How many items could a teller scan in 21,28 seconds? (2)
- A restaurant wants to know the relationship between the number of customers and the number of chicken pies that are ordered.
number of customers (x) 5 10 15 20 25 30 35 40 number of chicken pies (y) 3 5 10 10 15 20 20 24 - Determine the equation of the regression line correct to two decimal places. (3)
- Determine the value of r, the correlation coefficient. Describe the type and strength of the correlation between the number of people and the number of chicken pies ordered. (3)
- Determine how many chicken pies 100 people would order. (2)
- If they only have 12 pies left, how many people can they serve? (2)
[20]Solutions
- A = 2,68
B = 0,62
y = 2,68 + 0,62x (3) - r = 0,62847…. = 0,63
This is a weak positive correlation (3) - y = 2,68 + 0,62(21) = 15,7
(about 16 seconds) (2) - 21,28 = 2,68 + 0,62 x 3
21,28 – 2,68 = 0,62 x
18,6 = x
0.62
30 = x
30 items can be scanned in 21,28 seconds. (2)
- A = 2,68
- A = –0,39285…
B = 0,61190
y = –0,4 + 0,6 x 3 (3) - r = 0,9866…
This is a very strong positive correlation
(r is close to +1) (3) - y = –0,4 + 0,6 x
y = –0,4 + 0,6(100)
y = 59,6
About 60 chicken pies are ordered by 100 3 people. (2) - 12 = –0,4 + 0,6 x 3
12 + 0,4 = 0,6 x
12,4 = x
0.6
20,6… = x
About 21 people will order 12 pies. (2)
[20]
- A = –0,39285…
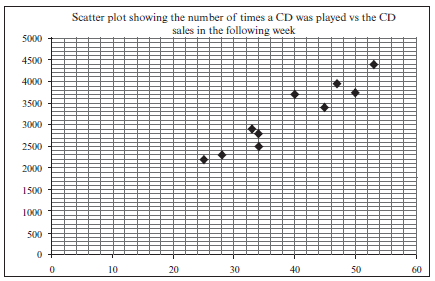
A recording company investigates the relationship between the number of times a CD is played by a national radio station and the national sales of the same CD in the following week. The data below was collected for random sample of CDs. The sales figures are rounded to the nearest 50
Number of times CD is played 47 34 40 34 33 50 28 53 25 45 Weekly sales of
the CD3950 2500 3700 2800 2900 3750 2300 4400 2200 3400 - Identify the independent variable. (1)
- Draw a scatter plot of this data. (3)
- Determine the equation of the least squares regression line. (3)
- Calculate the correlation coefficient. (2)
- Predict, correct to the nearest 50, the weekly sales for a CD that was played 45 times by the station in the previous week. (2)
- Comment on the strength of the relationship between the variables. (1)
[12]Solutions
a) the number of times the CD is played (1)b)

(3)c) a = 264,326
b = 75,21
y = 264,33 + 75,21x 3 (3)d) r = 0,95 (2)
e) y = 264,33 + 75,21x(45) (substitution)
≈ 3 648,78
≈ 3 648
≈ 3 650 (to the nearest 50) (2)f) There is a very strong positive relationship between the number of times that a CD was played and
the sales of that CD in the following week. (1)
[12]